
Fig 1.

Fig 2.

Fig 3.
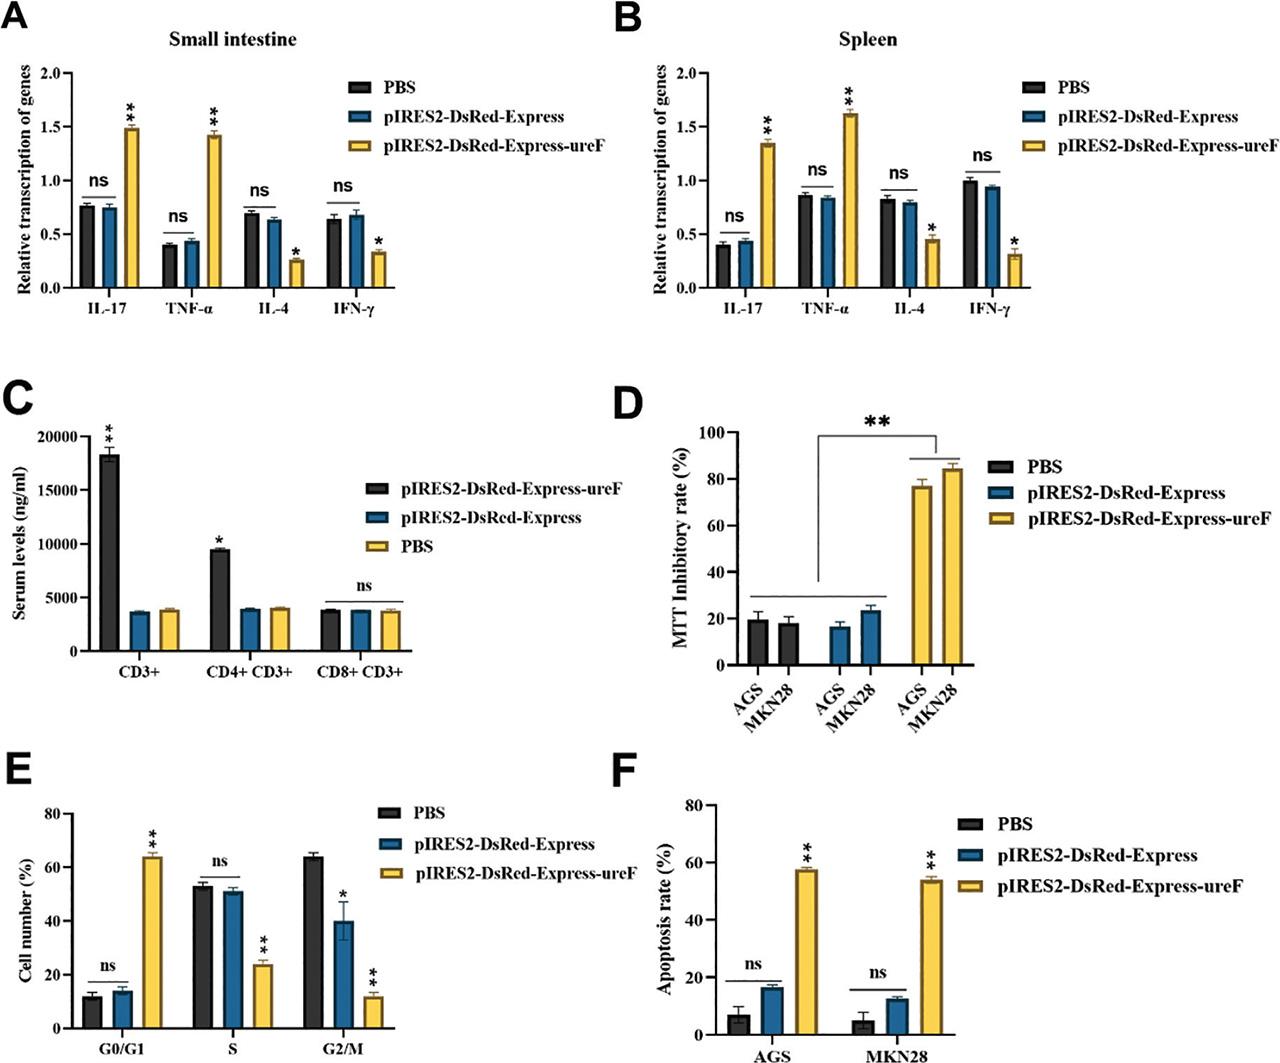
Fig 4.
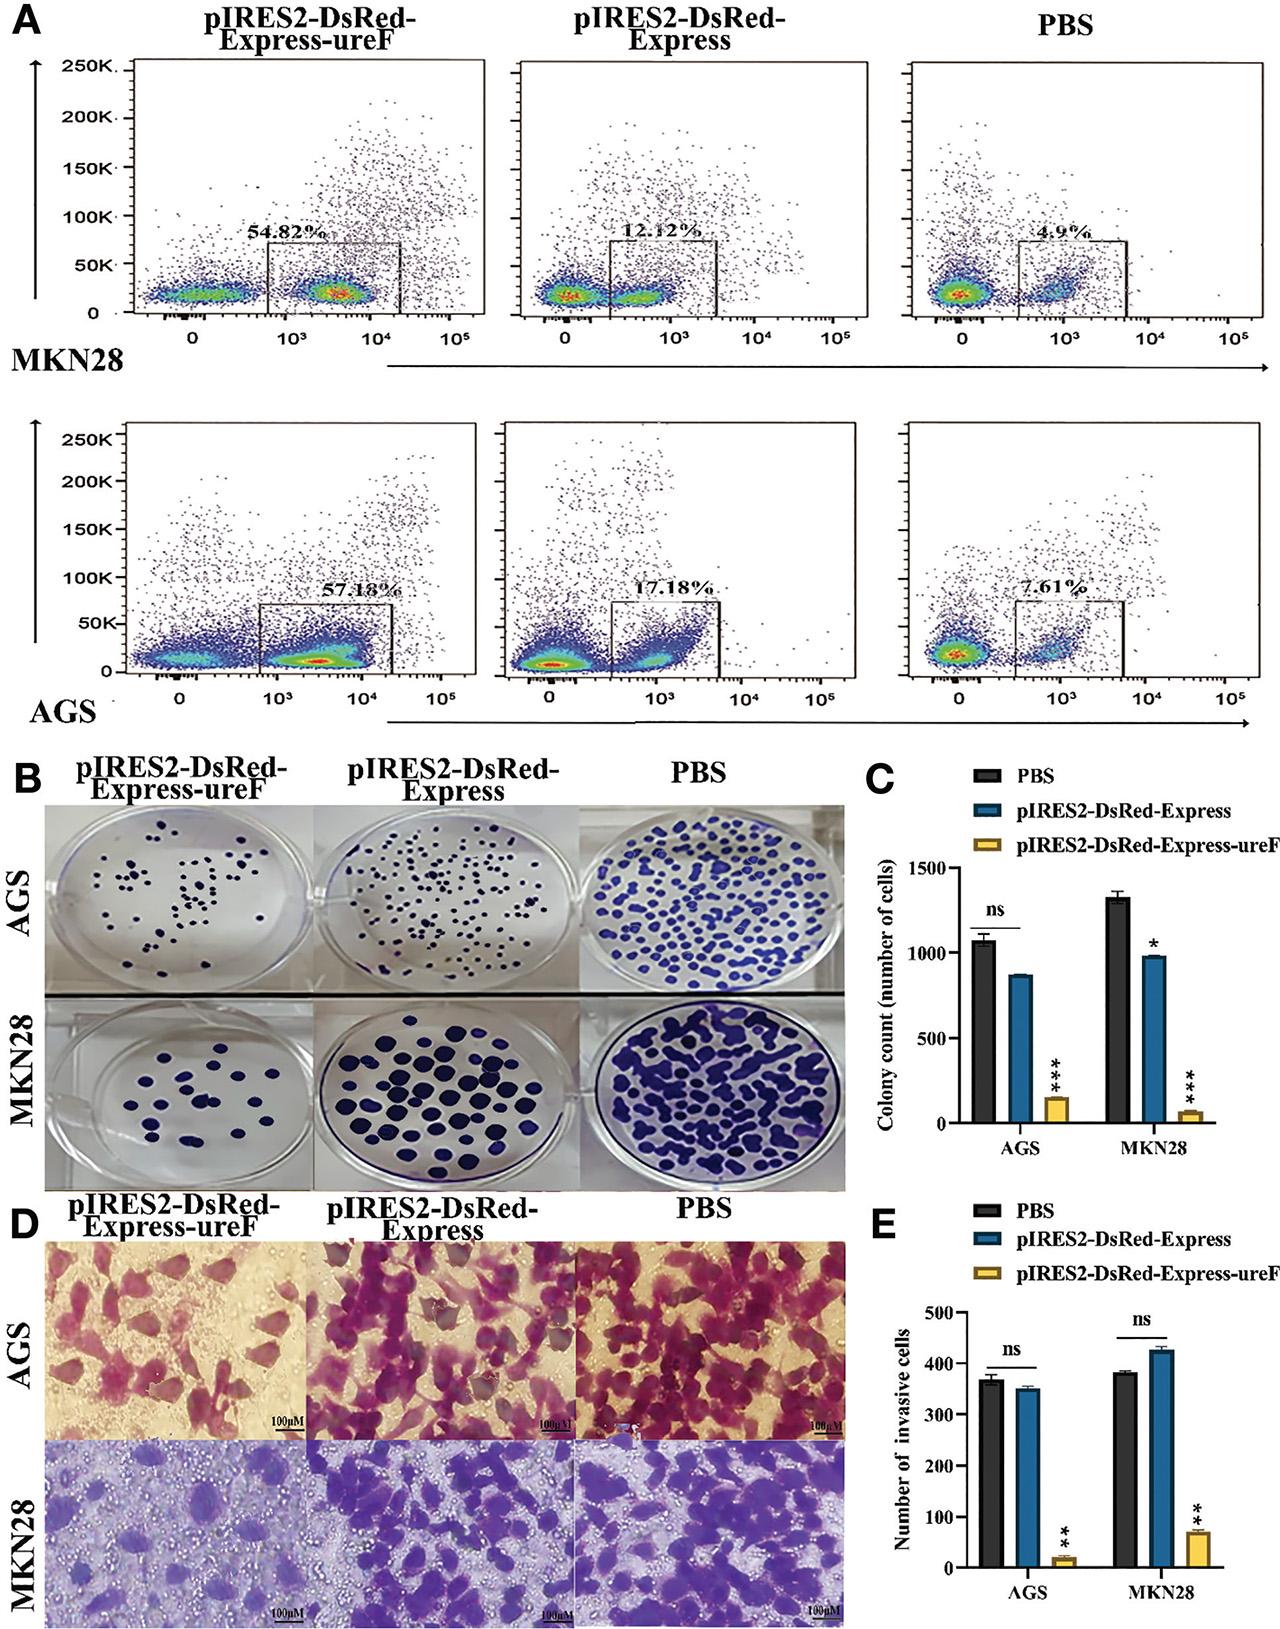
Fig 5.
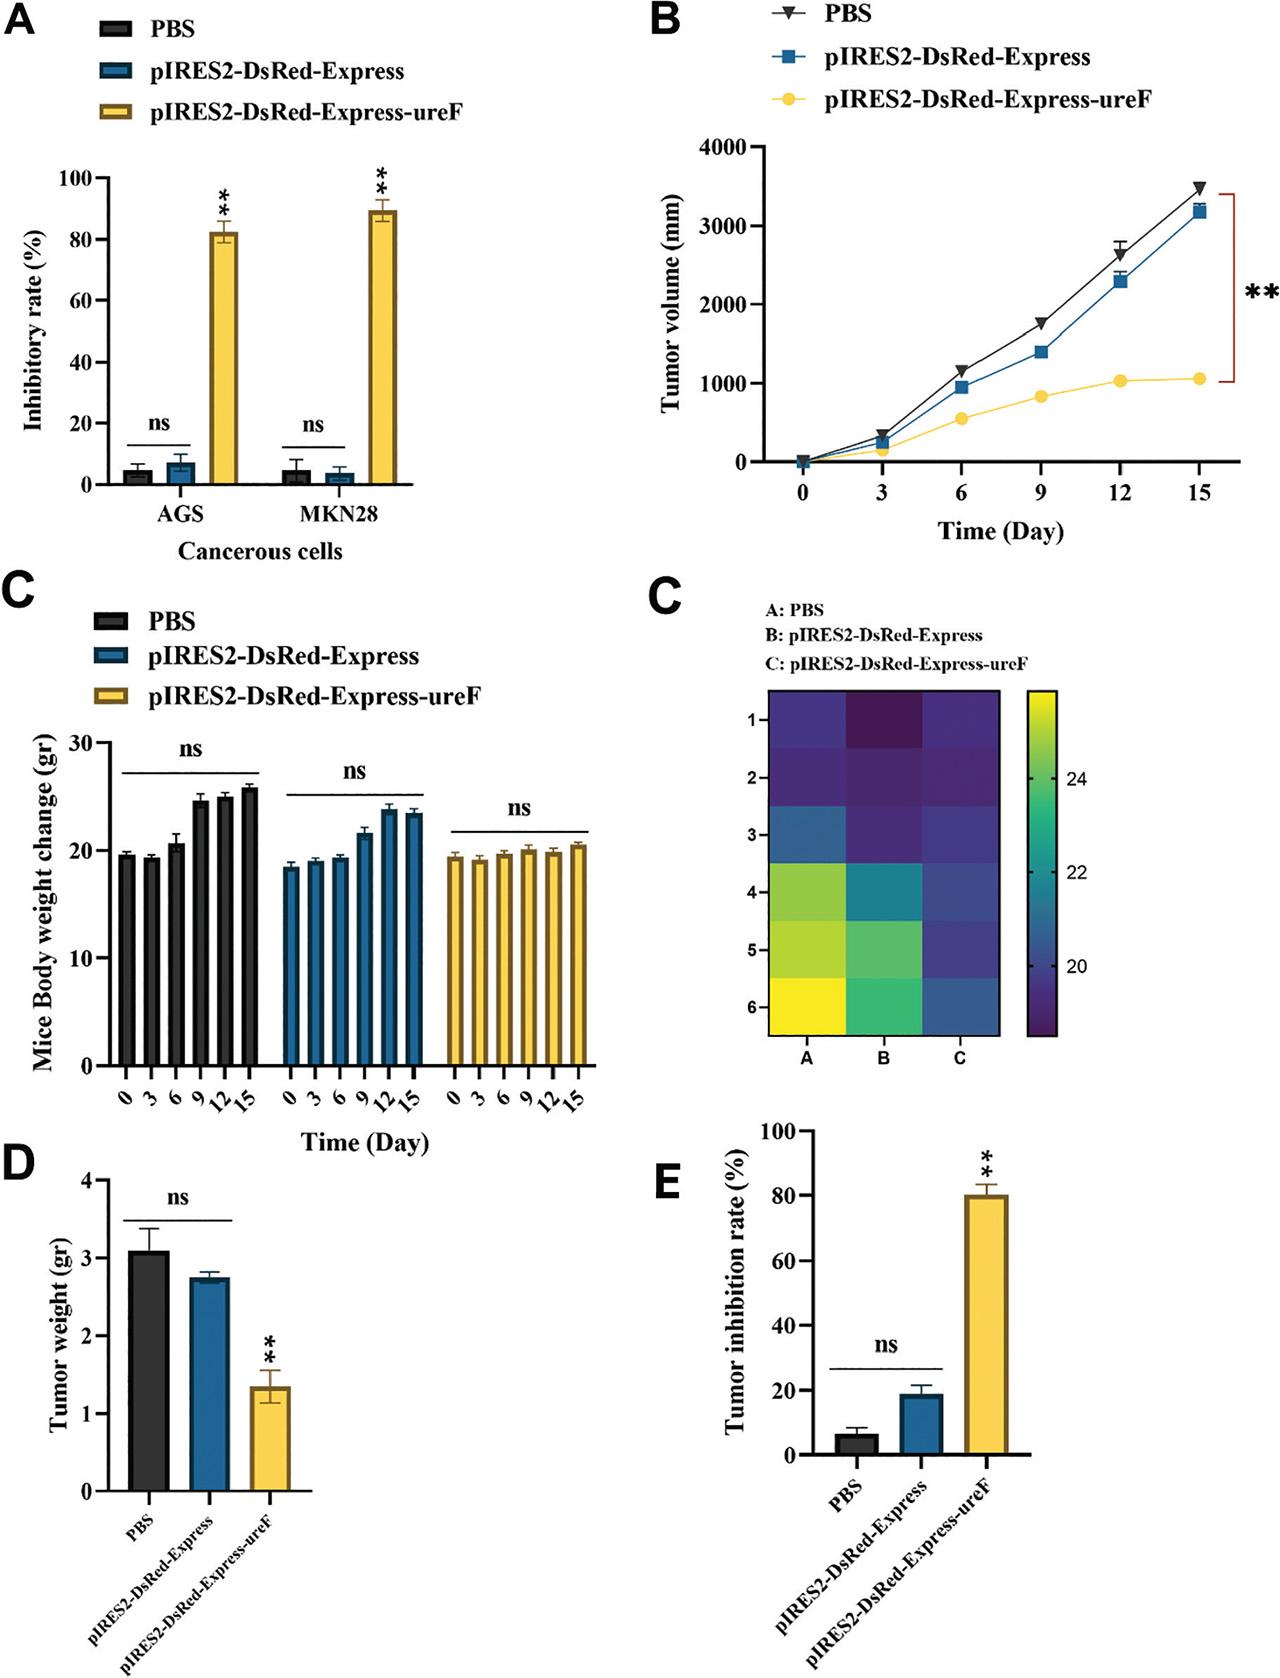
Fig 6.

Fig 7.
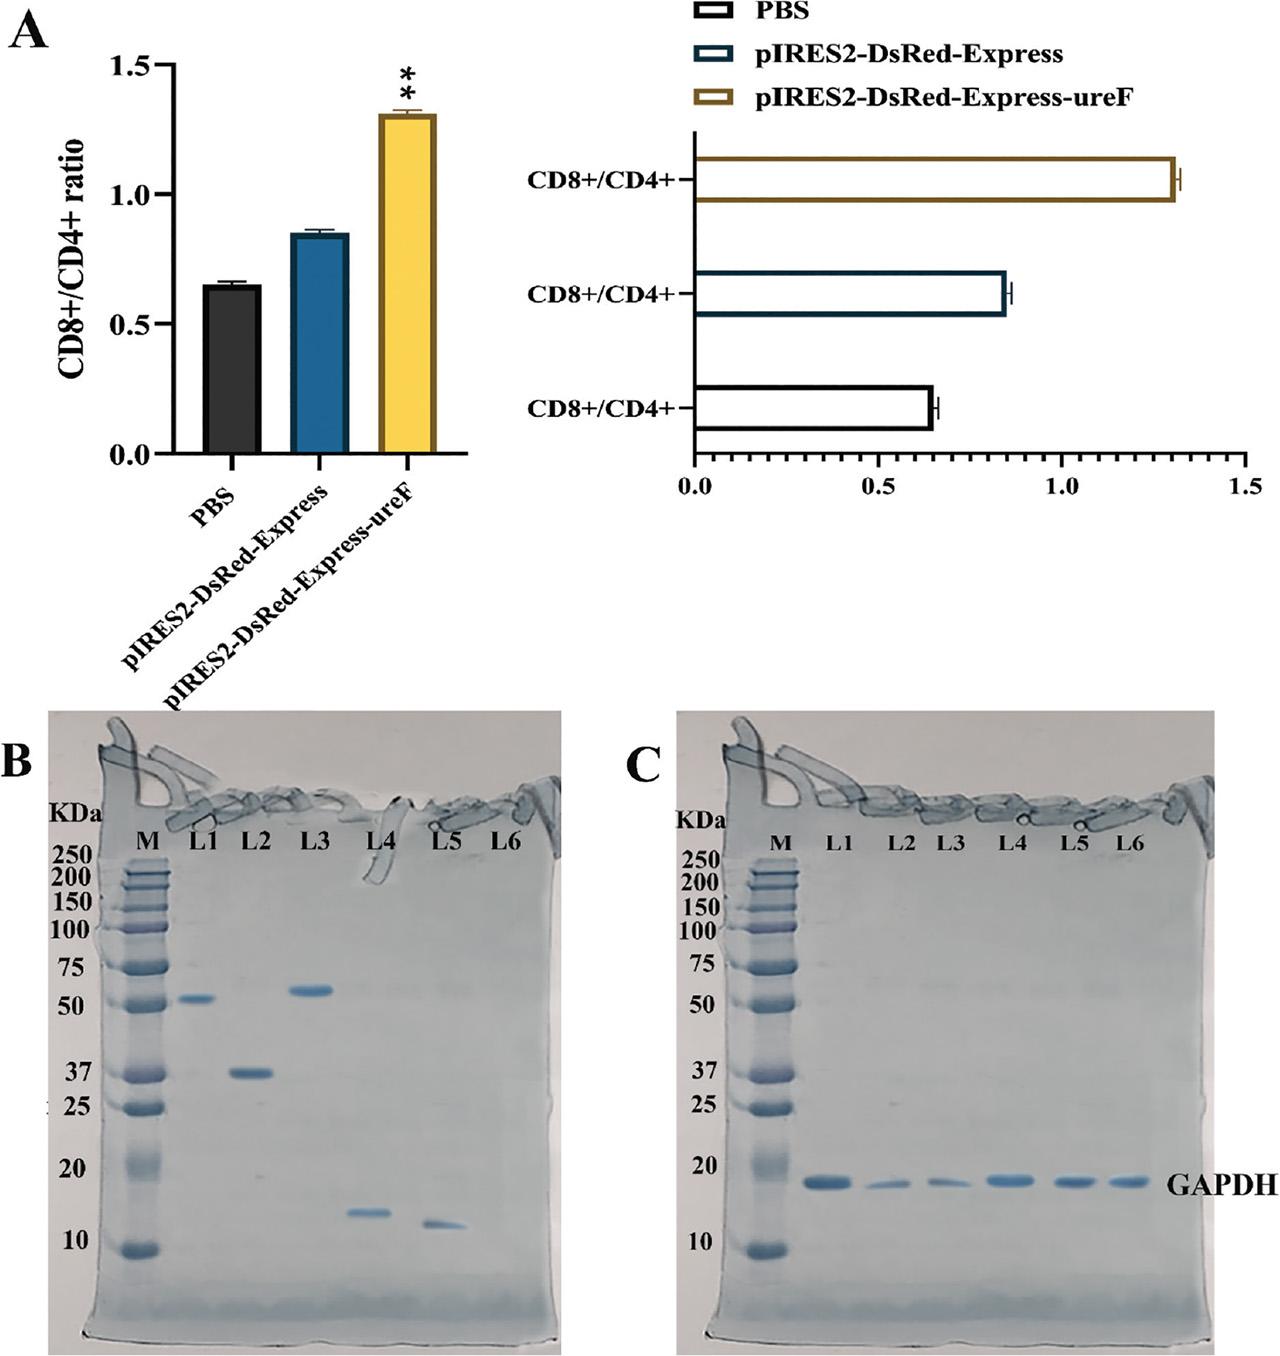
Fig 8.
Fig S1.

Fig S2.

Fig S3.
Sequence of specific primers for real-time PCR reaction
| Gene | Size | Primer sequence |
|---|---|---|
| IFN-γ | 188 bp |
|
| IL4 | 263 bp |
|
| IL17 | 246 bp |
|
| GAPDH | 250 bp |
|
| ureF | 802 bp |
|
The number of mice used in this experiment
| Group number | Injection composition | Number of mice | Average weight of mice | Type of injection | Time of injection (Day) |
|---|---|---|---|---|---|
| 1 | pIRES2-DsRed-Express-ureF | 20 | 19.7 ± 0.5 | IM | 0, 15, 30 |
| 2 | pIRES2-DsRed-Express | 20 | 18.2 ± 0.7 | IM | 0, 15, 30 |
| 3 | PBS | 20 | 19.4 ± 0.68 | IM | 0, 15, 30 |