
Table 1
Baseline characteristics of 50 patients with non-small cell lung cancer
| Characteristics | Value (number and %) | |
|---|---|---|
| Sex | ||
| Male | 45 (90) | |
| Female | 5 (10) | |
| Histology | ||
| Squamous Cell Carcinoma | 23 (46) | |
| Adenocarcinoma | 27 (54) | |
| Stage at diagnosis | ||
| Stage I | 20 (40) | |
| Stage II | 17 (34) | |
| Stage III | 13 (26) | |
| Smoking Status | ||
| Never | 11 (22) | |
| Current | 39 (78) | |
| Age (years) | ||
| Mean±SD (range) | 58.52±8.07 (41–77) | |
Table 2
Number of patients with positive CYP protein expression in tumour tissues and the number of patients with higher CYP protein expression in tumour tissues than in paired peripheral normal tissues
| CYP isoenzymes | Expression category | NSCLC (N=50) n (%) | AC (N=27) n (%) | SCC (N=23) n (%) |
|---|---|---|---|---|
| CYP1A1 | Positive expression in tumour tissue | 46 (92.00) | 26 (96.30) | 20 (86.96) |
| Higher expression in tumour than in paired normal tissue | 21 (42.00) | 15 (55.56) | 6 (26.09) | |
| CYP1B1 | Positive expression in tumour tissue | 48 (96.00) | 26 (96.30) | 22 (95.65) |
| Higher expression in tumour than in paired normal tissue | 7 (14.00) | 4 (14.81) | 3 (13.04) | |
| CYP2E1 | Positive expression in tumour tissue | 30 (60.00) | 14 (51.85) | 16 (69.57) |
| Higher expression in tumour than in paired normal tissue | 27 (54.00) | 13 (48.15) | 14 (60.87) |
[i] The staining intensity is graded as 0 (no staining), 1 (weak staining), 2 (moderate staining), and 3 (strong staining). Positive expression in tumour tissue is defined as a staining score greater than 0. Higher tumour expression is defined as a staining score in the tumour tissue greater than that in the paired peripheral normal tissue. Percentages are calculated using the total number of patients in each column as the denominator. AC – adenocarcinoma; N – number of patients; n – number of patients in the specific subgroup; NSCLC – non-small cell lung cancer; SCC – squamous cell carcinoma
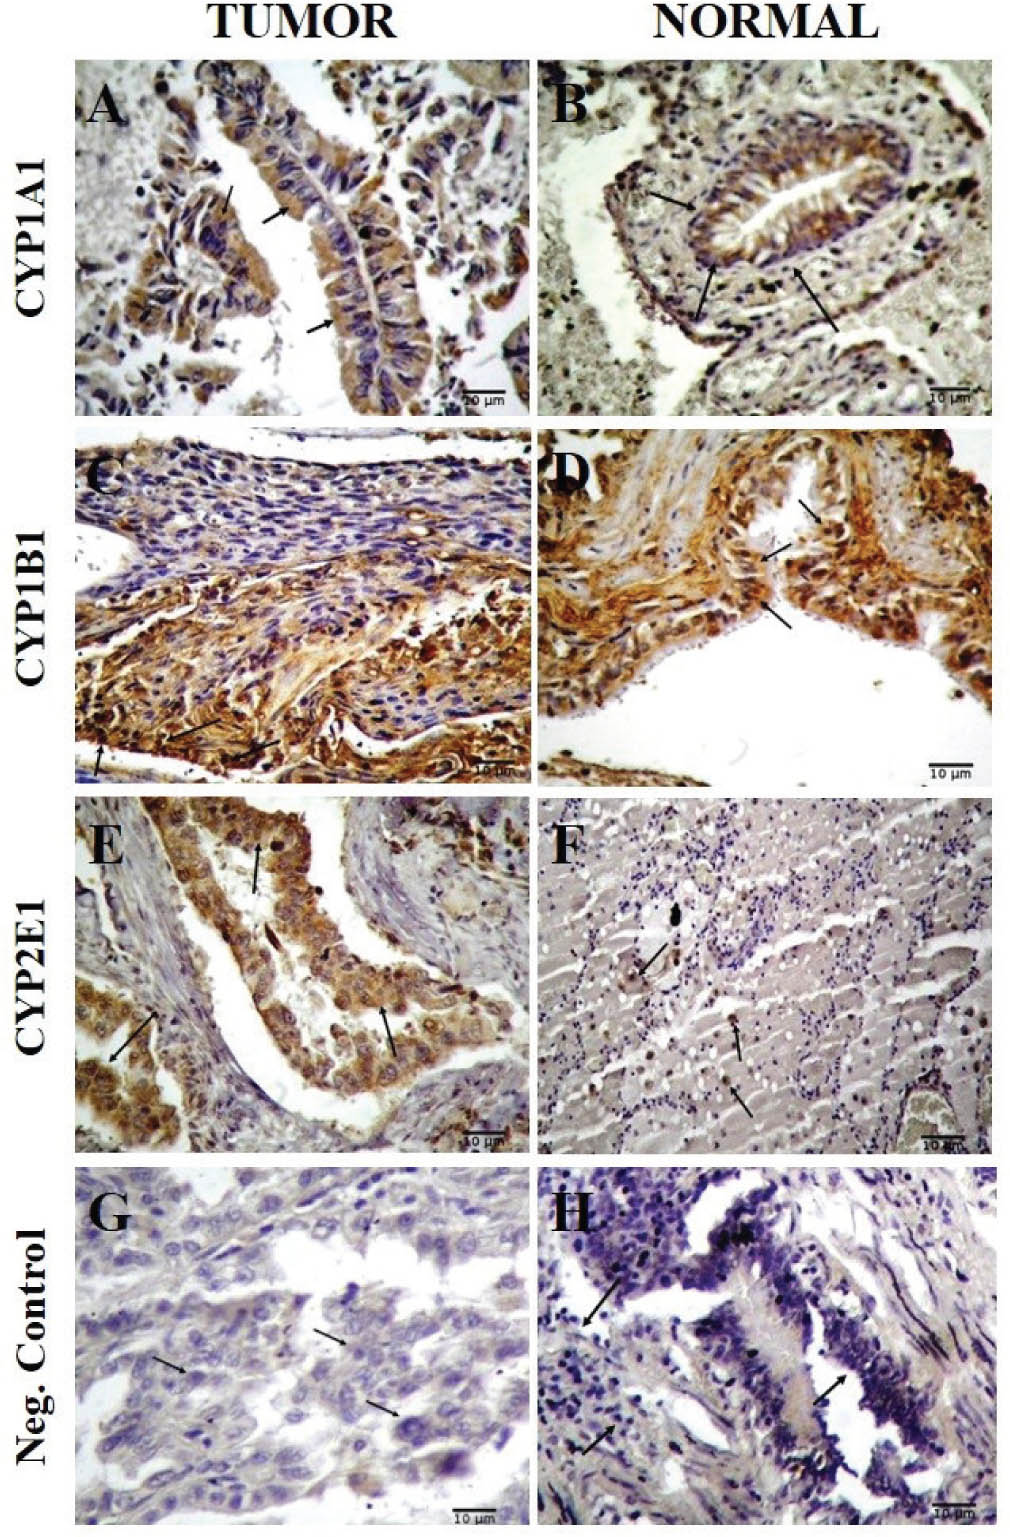
Figure 1
Immunohistochemical staining of CYP isoenzymes in tumour and peripheral normal lung tissues. A) CYP1A1 immunoreactivity in AC tumour cells; B) CYP1A1 immunoreactivity in bronchial epithelial cells of peripheral normal lung tissue; C) CYP1B1 immunoreactivity in SCC tumour cells; D) CYP1B1 immunoreactivity in bronchial epithelial cells of peripheral normal lung tissue; E) CYP2E1 immunoreactivity in AC tumour cells; F) CYP2E1 immunoreactivity in alveolar epithelial cells of peripheral normal lung tissue; and G–H) negative controls prepared without the primary antibody. Arrows in panels A–F indicate brown cytoplasmic immunoreactivity for the respective CYP isoenzyme. No specific brown cytoplasmic immunoreactivity was observed in the negative controls. Immunoreactivity was visualised using DAB, and nuclei were counterstained with haematoxylin. Images were acquired at 400× magnification. AC – adenocarcinoma; CYP – cytochrome P450; DAB – 3,3′-diaminobenzidine; Neg. Control – negative control; SCC – squamous cell carcinoma
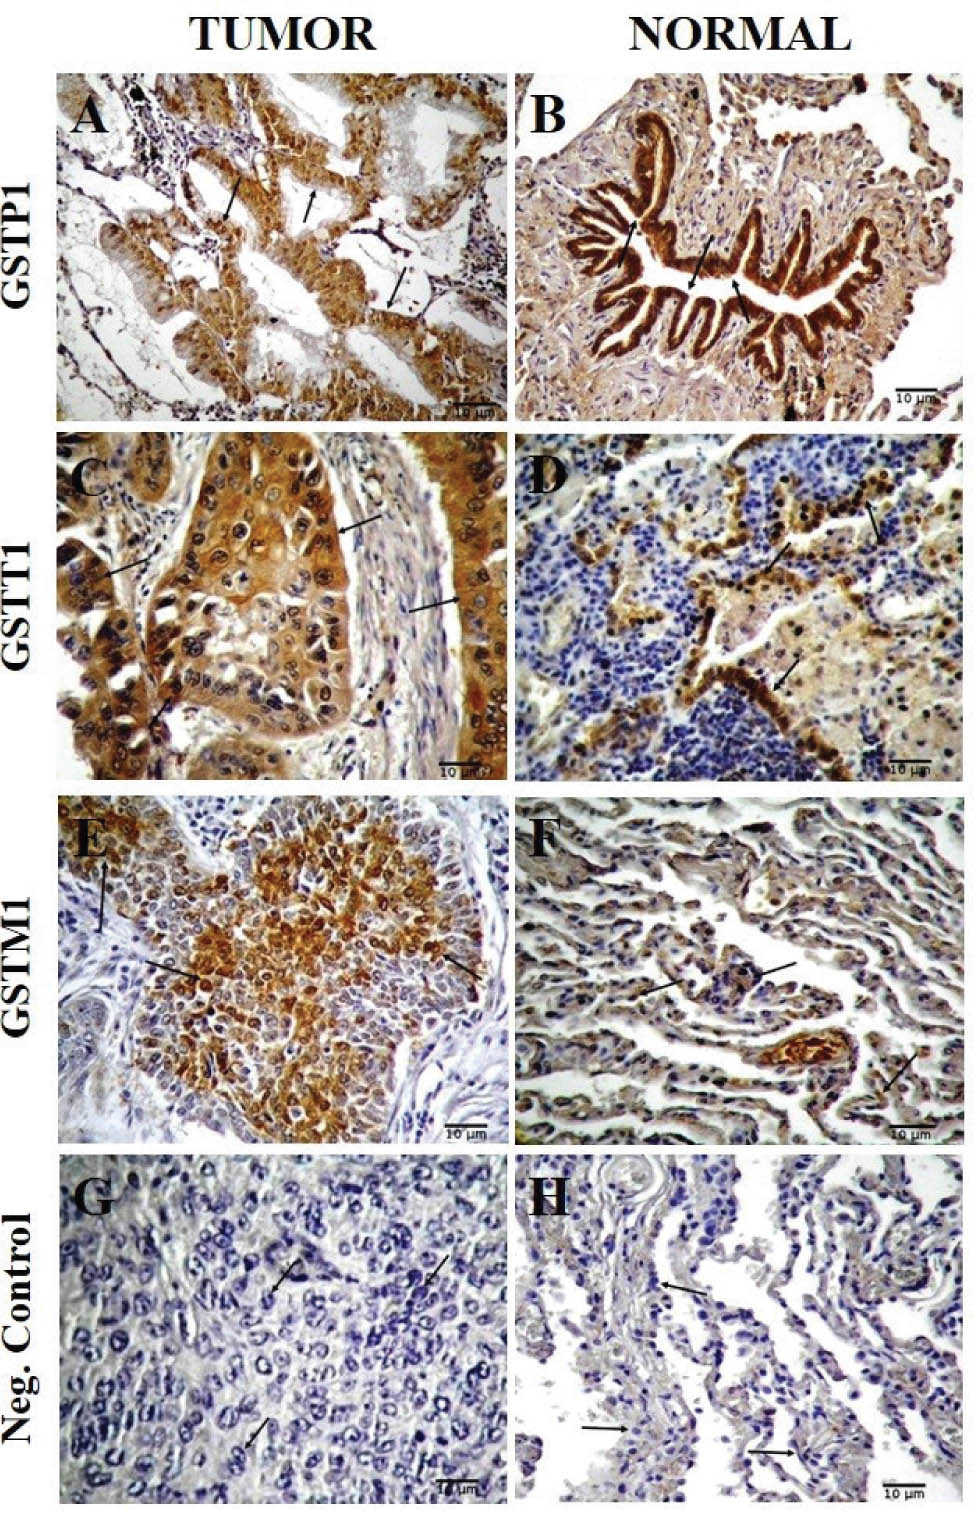
Figure 2
Immunohistochemical staining of GST isoenzymes in tumour and peripheral normal lung tissues. A) GSTP1 immunoreactivity in AC tumour cells; B) GSTP1 immunoreactivity in bronchial epithelial cells of peripheral normal lung tissue; C) GSTT1 immunoreactivity in AC tumour cells; D) GSTT1 immunoreactivity in alveolar epithelial cells of peripheral normal lung tissue; E) GSTM1 immunoreactivity in SCC tumour cells; F) GSTM1 immunoreactivity in alveolar epithelial cells of peripheral normal lung tissue; and G–H) negative controls prepared without the primary antibody. Arrows in panels A–F indicate brown cytoplasmic immunoreactivity for the respective GST isoenzyme. No specific brown cytoplasmic immunoreactivity was observed in the negative controls. Immunoreactivity was visualised using DAB, and nuclei were counterstained with haematoxylin. Images were acquired at 400× magnification. AC – adenocarcinoma; DAB – 3,3′-diaminobenzidine; GST – glutathione S-transferase; Neg. Control – negative control; SCC – squamous cell carcinoma.
Table 3
Comparison of CYP protein expression scores between tumour and peripheral normal tissues and between histological subtypes in patients with NSCLC
| CYP1A1 | CYP1B1 | CYP2E1 | ||||||||
|---|---|---|---|---|---|---|---|---|---|---|
| N | Tumour | Normal | T/N | Tumour | Normal | T/N | Tumour | Normal | T/N | |
| p* value | p* value | p* value | ||||||||
| NSCLC | 50 | 1.90±0.14a | 1.54±0.16 | 1.23 0.1144 | 2.62±0.11 | 2.82±0.06 | 0.92 0.3521 | 0.84±0.13 | 0.12±0.05 | 7.00 0.0001 |
| (0–3)b | (0–3) | (0–3) | (1–3) | (0–3) | (0–2) | |||||
| AC | 27 | 2.44±0.17 | 1.56±0.23 | 1.56 0.0068 | 2.67±0.15 | 2.85±0.07 | 0.93 0.7424 | 0.82±0.19 | 0.07±0.05 | 11.71 0.0040 |
| (0–3) | (0–3) | (0–3) | (2–3) | (0–3) | (0–1) | |||||
| SCC | 23 | 1.26±0.16 | 1.52±0.22 | 0.83 0.5241 | 2.57±0.15 | 2.78±0.11 | 0.92 0.3337 | 0.87±0.16 | 0.17±0.10 | 5.12 0.0013 |
| (0–3) | (0–3) | (0–3) | (1–3) | (0–3) | (0–2) | |||||
| AC/SCC | 1.94 | 1.03 | 1.04 | 1.03 | 0.94 | 0.40 | ||||
| p** value | 0.0001 | 0.9457 | 0.4192 | 0.8533 | 0.5143 | 0.7261 | ||||
[i] T/N is the ratio of the mean expression score in tumour tissue to that in peripheral normal tissue within each group. AC/SCC is the ratio of the mean expression score in AC to that in SCC, calculated separately for tumour and peripheral normal tissues.
[ii] p* value indicates the difference in expression scores between tumour and peripheral normal tissues in the overall NSCLC cohort and separately in the AC and SCC groups.
[iii] p** value indicates the difference in expression scores between AC and SCC, calculated separately for tumour tissues (AC tumour vs SCC tumour) and peripheral normal tissues (AC normal vs SCC normal). Comparisons were performed using the Mann-Whitney U test, and p<0.05 is considered statistically significant
Table 4
Number of patients with positive GST protein expression in tumour tissues and the number of patients with higher GST protein expression in tumour tissues than in paired peripheral normal tissues
| GST isoenzyme | Expression category | NSCLC (N=50) n (%) | AC (N=27) n (%) | SCC (N=23) n (%) |
|---|---|---|---|---|
| GSTP1 | Positive expression in tumour tissue | 48 (96.00) | 25 (92.59) | 23 (100.00) |
| Higher expression in tumour than in paired normal tissue | 15 (30.00) | 8 (29.63) | 7 (30.43) | |
| GSTT1 | Positive expression in tumour tissue | 39 (78.00) | 24 (88.89) | 15 (65.22) |
| Higher expression in tumour than in paired normal tissue | 16 (32.00) | 10 (37.04) | 6 (26.09) | |
| GSTM1 | Positive expression in tumour tissue | 19 (38.00) | 6 (22.22) | 13 (56.52) |
| Higher expression in tumour than in paired normal tissue | 17 (34.00) | 5 (18.52) | 12 (52.17) |
[i] The staining intensity is graded as 0 (no staining), 1 (weak staining), 2 (moderate staining), and 3 (strong staining). Positive expression in tumour tissue is defined as a staining score greater than 0. Higher tumour expression is defined as a staining score in the tumour tissue greater than that in the paired peripheral normal tissue. Percentages are calculated using the total number of patients in each column as the denominator. AC – adenocarcinoma; N – number of patients; n – number of patients in the specific subgroup; NSCLC – non-small cell lung cancer; SCC – squamous cell carcinoma
Table 5
Comparison of GST protein expression scores between tumour and peripheral normal tissues and between histological subtypes in patients with NSCLC
| GSTP1 | GSTM1 | GSTT1 | ||||||||
|---|---|---|---|---|---|---|---|---|---|---|
| N | Tumour | Normal | T/N | Tumour | Normal | T/N | Tumour | Normal | T/N | |
| p* value | p* value | p* value | ||||||||
| NSCLC | 50 | 2.44±0.12a | 2.22±0.12 | 1.09 0.2121 | 0.70±0.15 | 0.14±0.06 | 5.00 0.0122 | 1.54±0.16 | 1.48±0.18 | 1.08 0.7459 |
| (0–3)b | (1–3) | (0–3) | (0–2) | (0–3) | (0–3) | |||||
| AC | 27 | 2.33±0.19 | 2.15±0.18 | 1.08 0.4312 | 0.41±0.17 | 0.19±0.11 | 2.15 0.4835 | 2.11±0.20 | 1.67±0.26 | 1.26 0.2796 |
| (0–3) | (1–3) | (0–3) | (0–2) | (0–3) | (0–3) | |||||
| SCC | 23 | 2.57±0.14 | 2.30±0.17 | 1.11 0.3448 | 1.04±0.23 | 0.09±0.06 | 11.60 0.0032 | 0.87±0.18 | 1.26±0.26 | 0.69 0.4485 |
| (1–3) | (1–3) | (0–3) | (0–1) | (0–3) | (0–3) | |||||
| AC/SCC | 0.91 | 0.93 | 0.39 | 2.11 | 2.43 | 1.33 | ||||
| p** value | 0.5724 | 0.6060 | 0.0373 | 0.8609 | 0.0003 | 0.3304 | ||||
[i] T/N is the ratio of the mean expression score in tumour tissue to that in peripheral normal tissue within each group. AC/SCC is the ratio of the mean expression score in AC to that in SCC, calculated separately for tumour and peripheral normal tissues.
[ii] p* value indicates the difference in expression scores between tumour and peripheral normal tissues in the overall NSCLC cohort and separately in the AC and SCC groups.
[iii] p** value indicates the difference in expression scores between AC and SCC, calculated separately for tumour tissues (AC tumour vs SCC tumour) and peripheral normal tissues (AC normal vs SCC normal). Comparisons were performed using the Mann-Whitney U test, and p<0.05 is considered statistically significant