
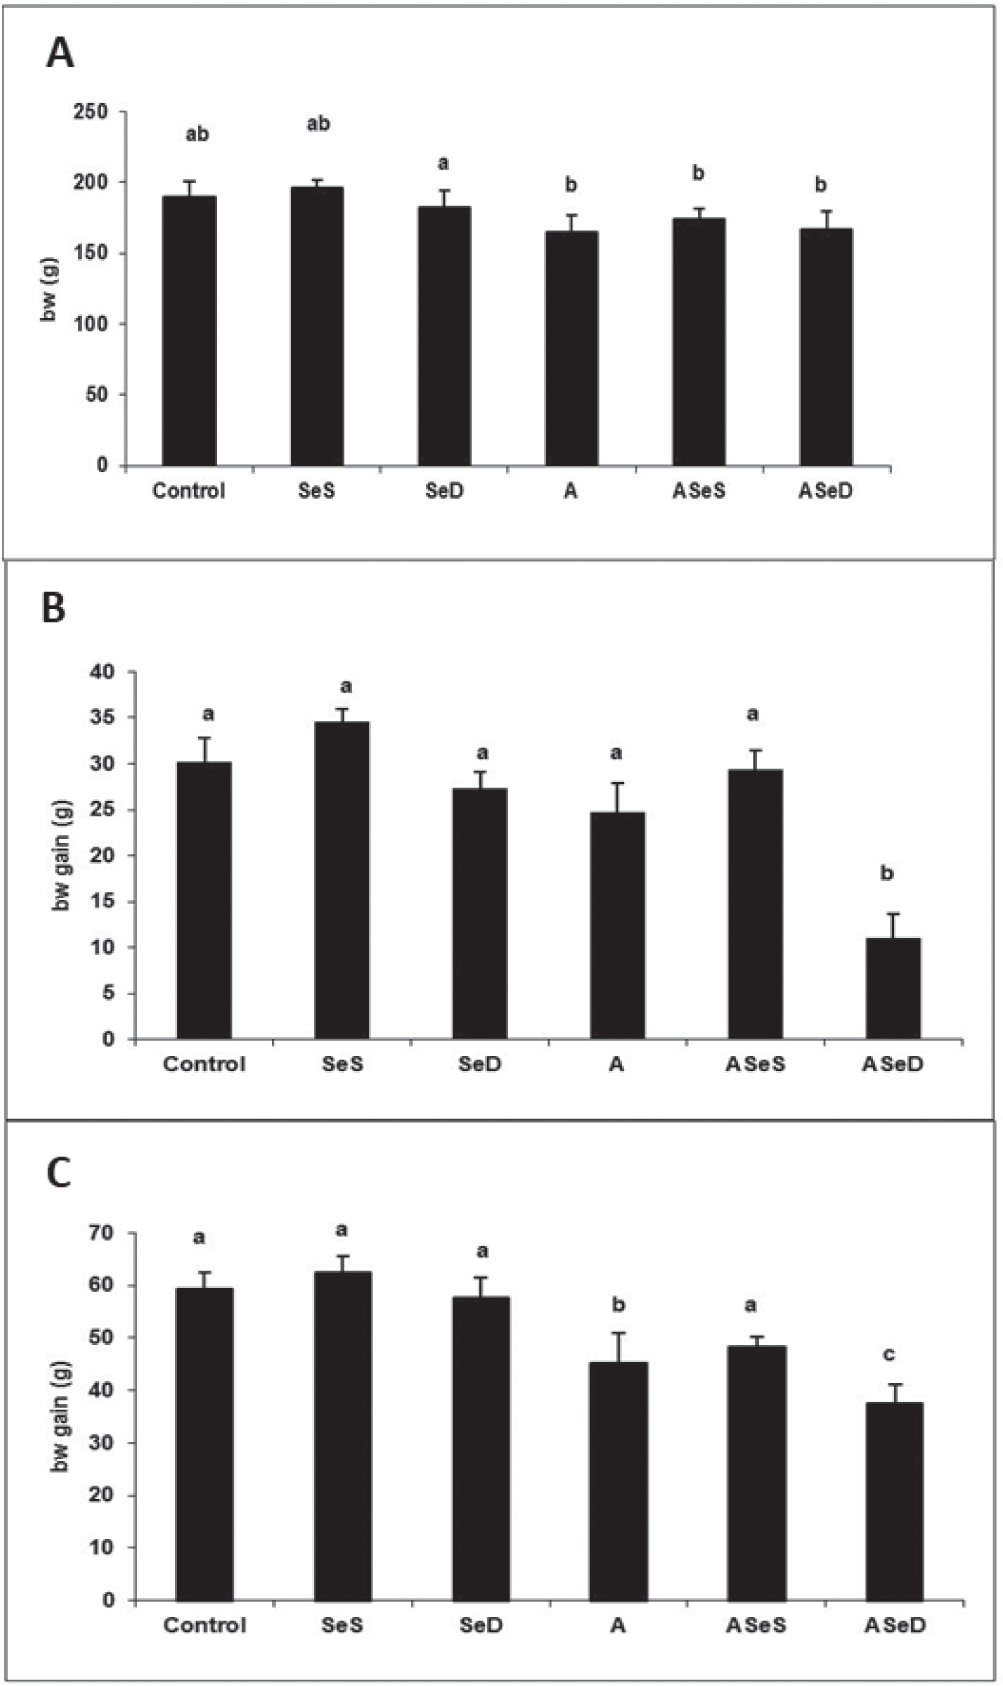
Figure 1
Mean (±SD) body weights (A) and body weight gain in the first week (B) and the last 14 days (C) of treatment. a, b Bars that do not share same superscript letters are significantly different (p<0.05). A – Aroclor 1254 group receiving 0.15 mg/kg/day of Se for 5 weeks and 10 mg/kg/day of Aroclor 1254 in corn oil for the last 15 days; ASeD – Se-deficient group receiving Aroclor 1254 as described above.; ASeS –Se-supplemented group receiving Aroclor 1254 as described above; Control – group receiving 0.15 mg/kg/day of Se for 5 weeks; SeD – Se-deficient group receiving 0.50 mg/kg/day of Se for 5 weeks; SeS – Se-supplemented group receiving 1 mg selenium/kg/day for 5 weeks
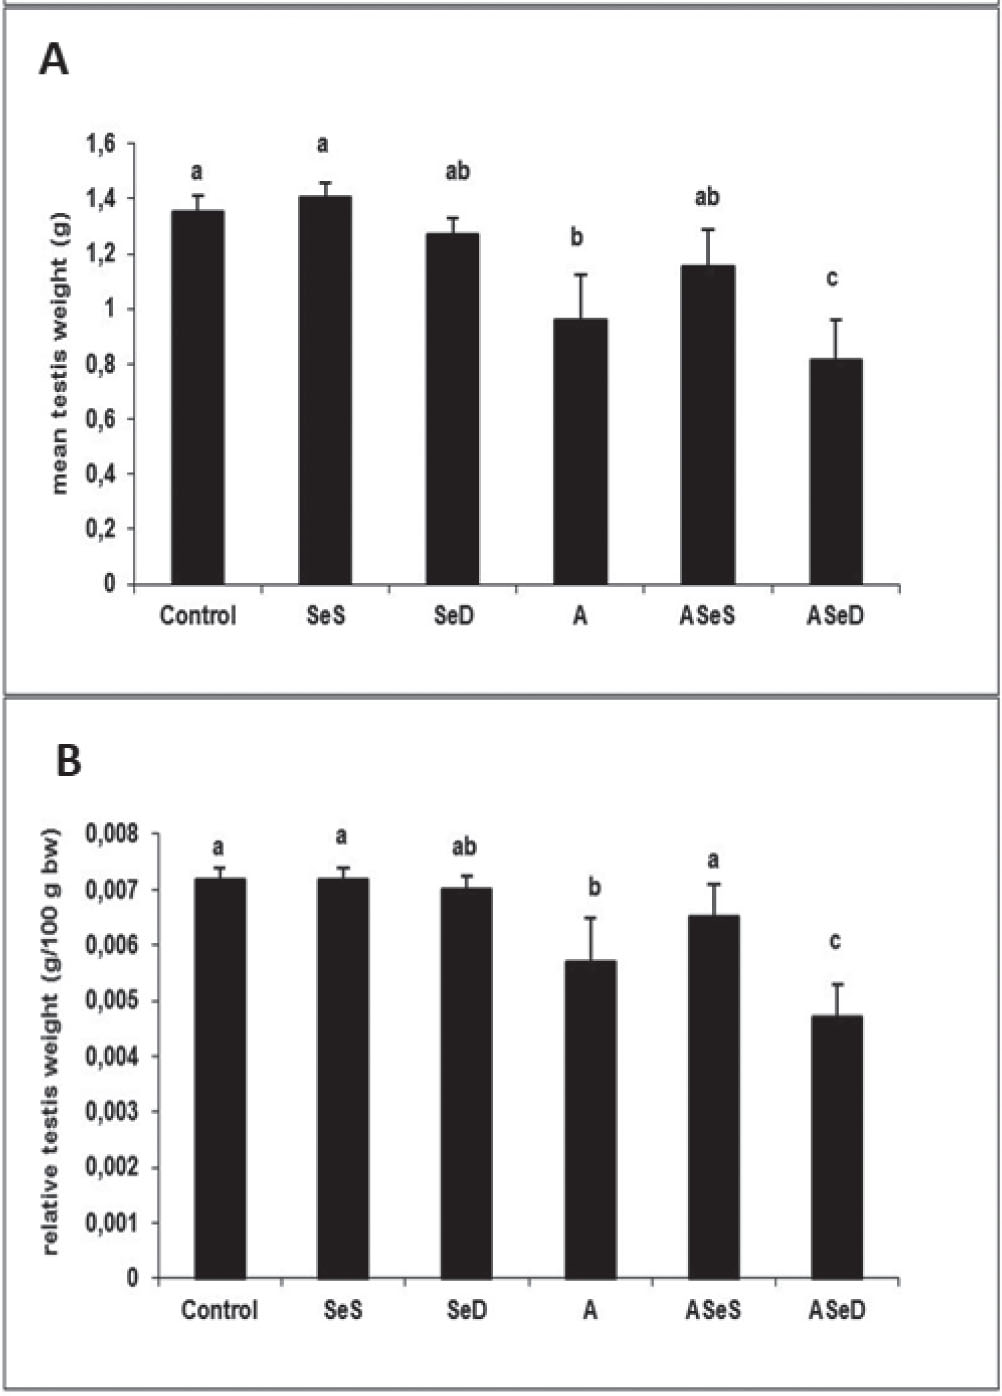
Figure 2
Mean (A) and relative (B) testis weights in our study groups. a, b, c Bars that do not share same superscript letters are significantly different (p<0.05). A – Aroclor 1254 group receiving 0.15 mg/kg/day of Se for 5 weeks and 10 mg/kg/day of Aroclor 1254 in corn oil for the last 15 days; ASeD – Se-deficient group receiving Aroclor 1254 as described above.; ASeS –Se-supplemented group receiving Aroclor 1254 as described above; Control – group receiving 0.15 mg/kg/day of Se for 5 weeks; SeD – Se-deficient group receiving 0.50 mg/kg/day of Se for 5 weeks; SeS – Se-supplemented group receiving 1 mg selenium/kg/day for 5 weeks
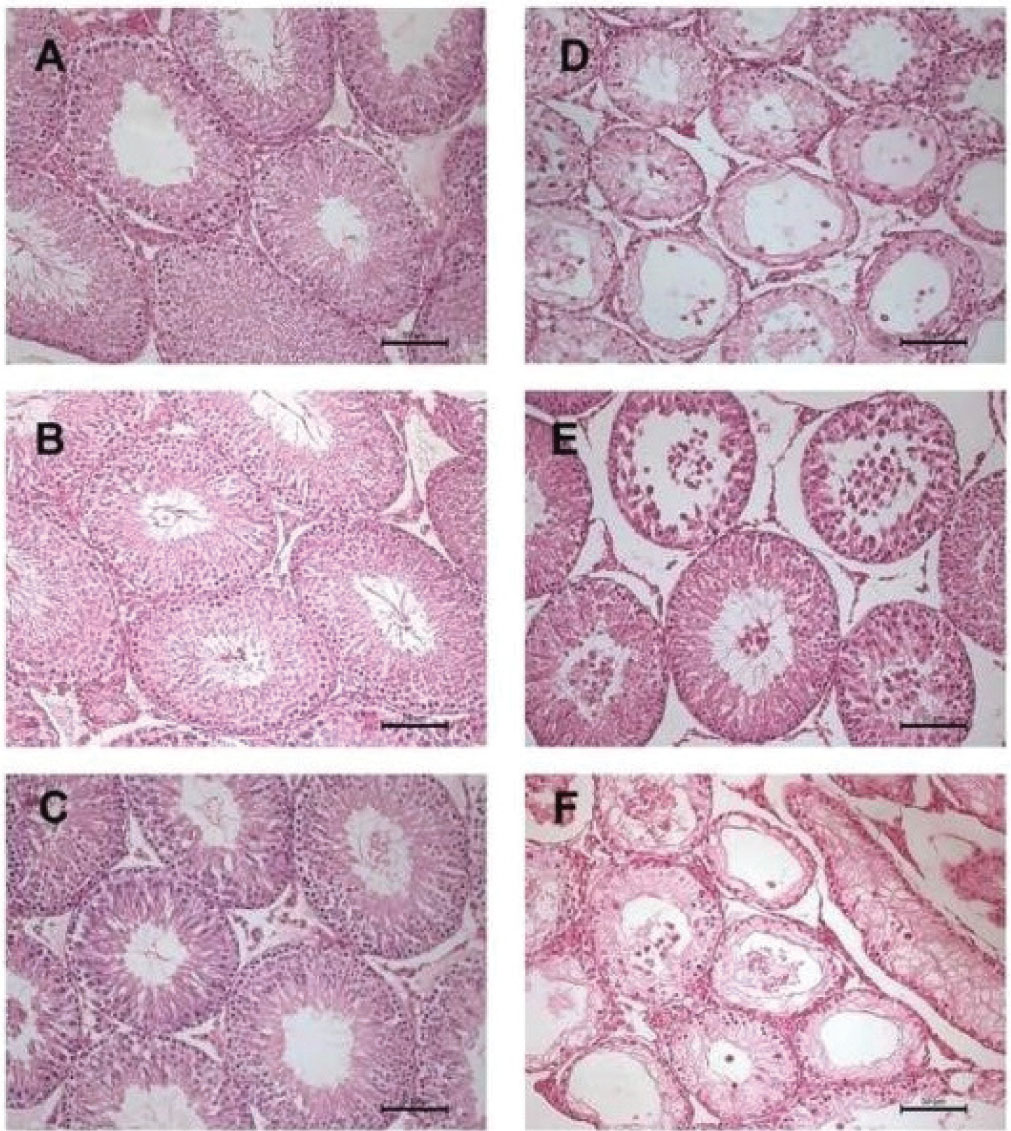
Figure 3
Histopathological changes in the study groups: seminiferous tubules with normal morphology in control (A), SeS (B), SeD (C) and ASeS (E) groups; prominent degeneration of seminiferous epithelium in A1254 (D) and ASeD groups (F) (haematoxylin-eosin, 200× magnification). A1254 – Aroclor 1254 group receiving 0.15 mg/kg/day of Se for 5 weeks and 10 mg/kg/day of Aroclor 1254 in corn oil for the last 15 days; ASeD – Se-deficient group receiving Aroclor 1254 as described above.; ASeS –Se-supplemented group receiving Aroclor 1254 as described above; Control – group receiving 0.15 mg/kg/day of Se for 5 weeks; SeD – Se-deficient group receiving 0.50 mg/kg/day of Se for 5 weeks; SeS – Se-supplemented group receiving 1 mg selenium/kg/day for 5 weeks
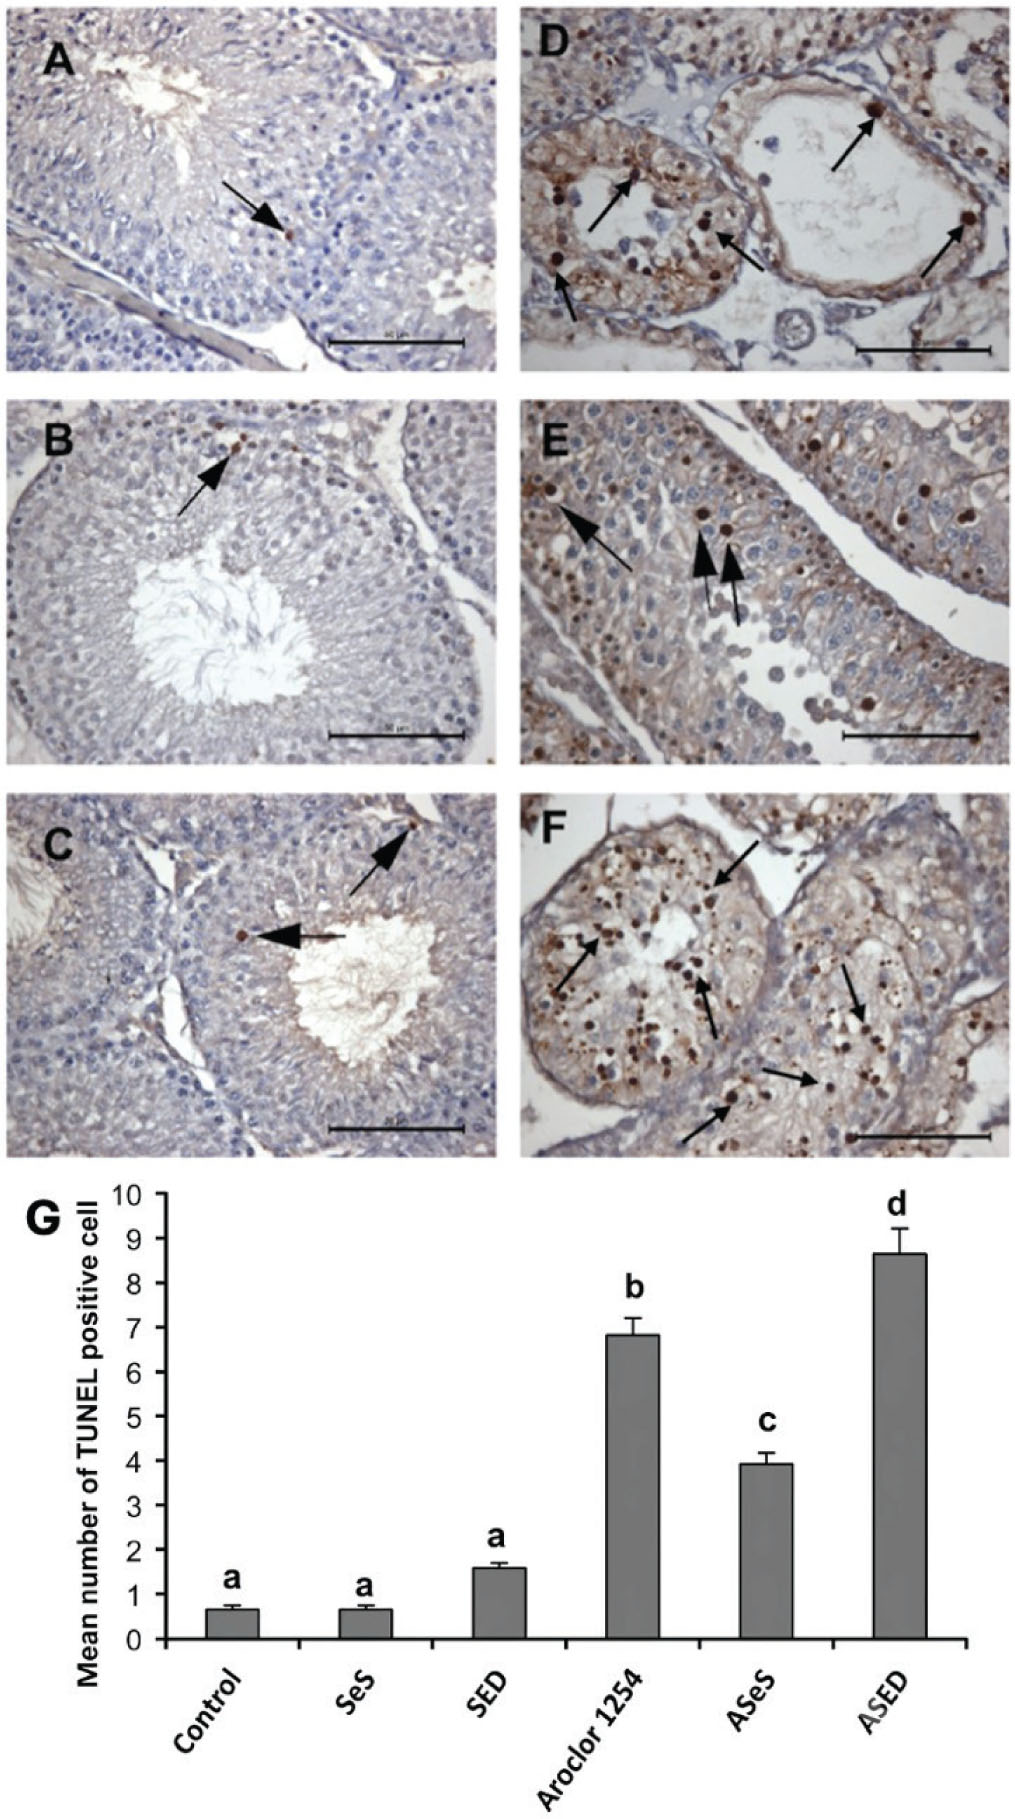
Figure 4
TUNEL-positive (apoptotic) cells in seminiferous tubules of A) control; B) SeS; C) SeD; D) A1254; E) ASeS; and F) ASED group indicated by arrows (400× magnification) and G) mean (±SD) apoptotic cell counts across the groups. a, b, c, d Bars that do not share same superscript letters are significantly different (p<0.05). A – Aroclor 1254 group receiving 0.15 mg/kg/day of Se for 5 weeks and 10 mg/kg/day of Aroclor 1254 in corn oil for the last 15 days; ASeD – Se-deficient group receiving Aroclor 1254 as described above.; ASeS – Se-supplemented group receiving Aroclor 1254 as described above; Control – group receiving 0.15 mg/kg/day of Se for 5 weeks; SeD – Se-deficient group receiving 0.50 mg/kg/day of Se for 5 weeks; SeS – Se-supplemented group receiving 1 mg selenium/kg/day for 5 weeks
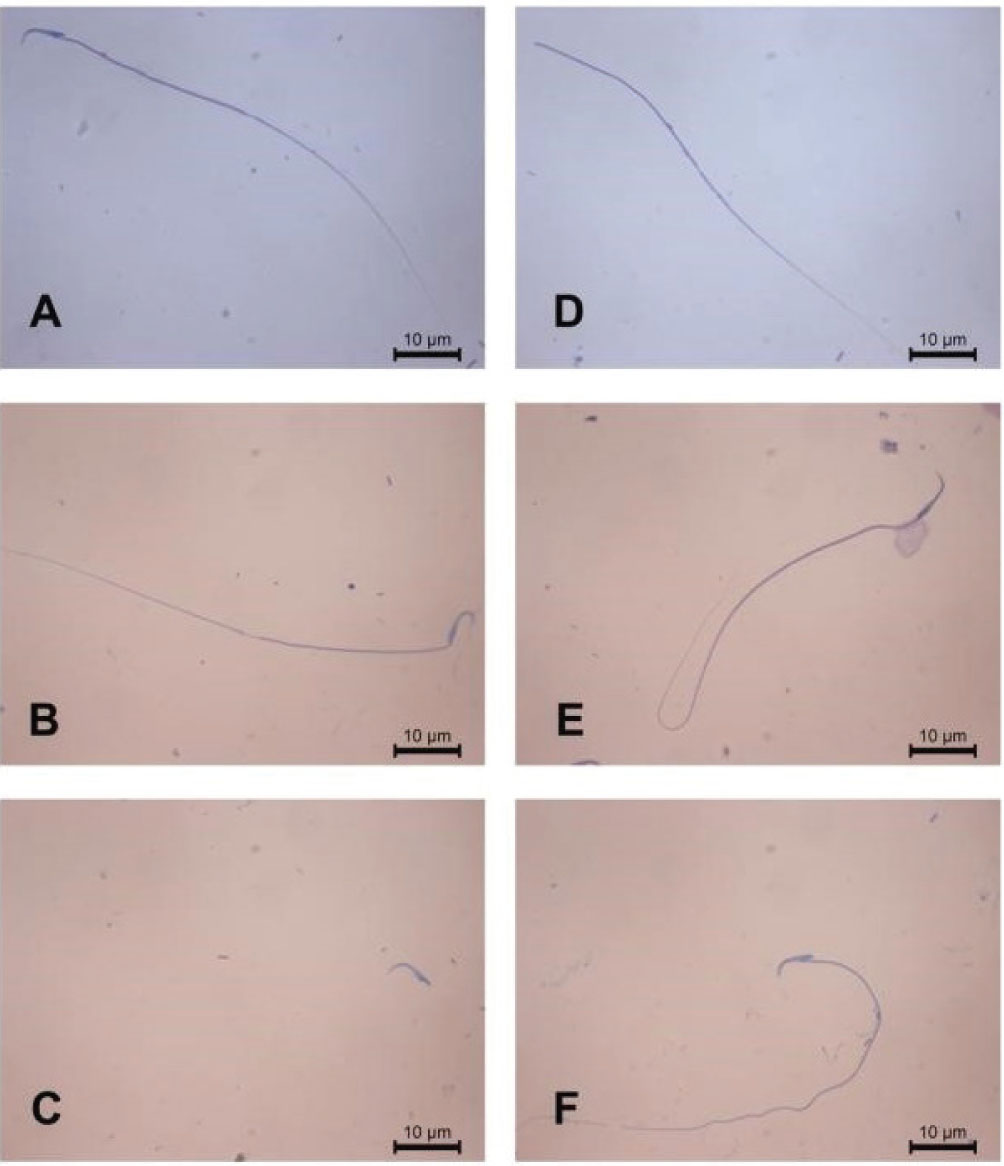
Figure 5
Sperm images across the A) control; B) SeS; C) SeD; D) A1254; E) ASeS; and F) ASeD group. A – Aroclor 1254 group receiving 0.15 mg/kg/day of Se for 5 weeks and 10 mg/kg/day of Aroclor 1254 in corn oil for the last 15 days; ASeD – Se-deficient group receiving Aroclor 1254 as described above.; ASeS – Se-supplemented group receiving Aroclor 1254 as described above; Control – group receiving 0.15 mg/kg/day of Se for 5 weeks; SeD – Se-deficient group receiving 0.50 mg/kg/day of Se for 5 weeks; SeS – Se-supplemented group receiving 1 mg selenium/kg/day for 5 weeks
Table 1
Sperm morphologies across the study groups
| Control | SeS | SeD | A | ASeS | ASeD | |
|---|---|---|---|---|---|---|
| Normal sperm (%) | 71.43 | 82.69 | 48.40 | 28.06 | 54.65 | 26.91 |
| Sperms without tail (%) | 1.75 | 0.43 | 0.99 | 2.36 | 0.96 | 3.79 |
| Sperms without head (%) | 5.75 | 4.30 | 8.13 | 12.60 | 10.39 | 23.64 |
| Sperms with rudimentary tail (%) | 0.48 | 0.00 | 0.37 | 1.84 | 1.58 | 3.92 |
| Sperms with curved tail (%) | 14.37 | 6.13 | 10.96 | 46.49 | 25.62 | 34.49 |
| Sperms with bend mid-piece (%) | 0.87 | 1.94 | 2.71 | 1.18 | 1.96 | 3.21 |
| Sperms with coiled tail (%) | 5.24 | 1.83 | 5.30 | 7.48 | 4.84 | 4.05 |
| Sperms with curved mid-piece (%) | 0.12 | 2.69 | 23.15 | 0.00 | 0.00 | 0.00 |
| Sperms with swapped tail (%) | 0.00 | 0.00 | 0.00 | 0.00 | 0.00 | 0.00 |
| Total N of abnormal sperm (%) | 28.57 | 17.31 | 51.60 | 59.95 | 45.35 | 73.09 |
| Total N of sperm (%) | 100 | 100 | 100 | 100 | 100 | 100 |
[i] A – Aroclor 1254 group receiving 0.15 mg/kg/day of Se for 5 weeks and 10 mg/kg/day of Aroclor 1254 in corn oil for the last 15 days; ASeD – Se-deficient group receiving Aroclor 1254 as described above; ASeS – Se-supplemented group receiving Aroclor 1254 as described above; Control – group receiving 0.15 mg/kg/day of Se for 5 weeks; SeD – Se-deficient group receiving 0.50 mg/kg/day of Se for 5 weeks; SeS – Se-supplemented group receiving 1 mg selenium/kg/day for 5 weeks
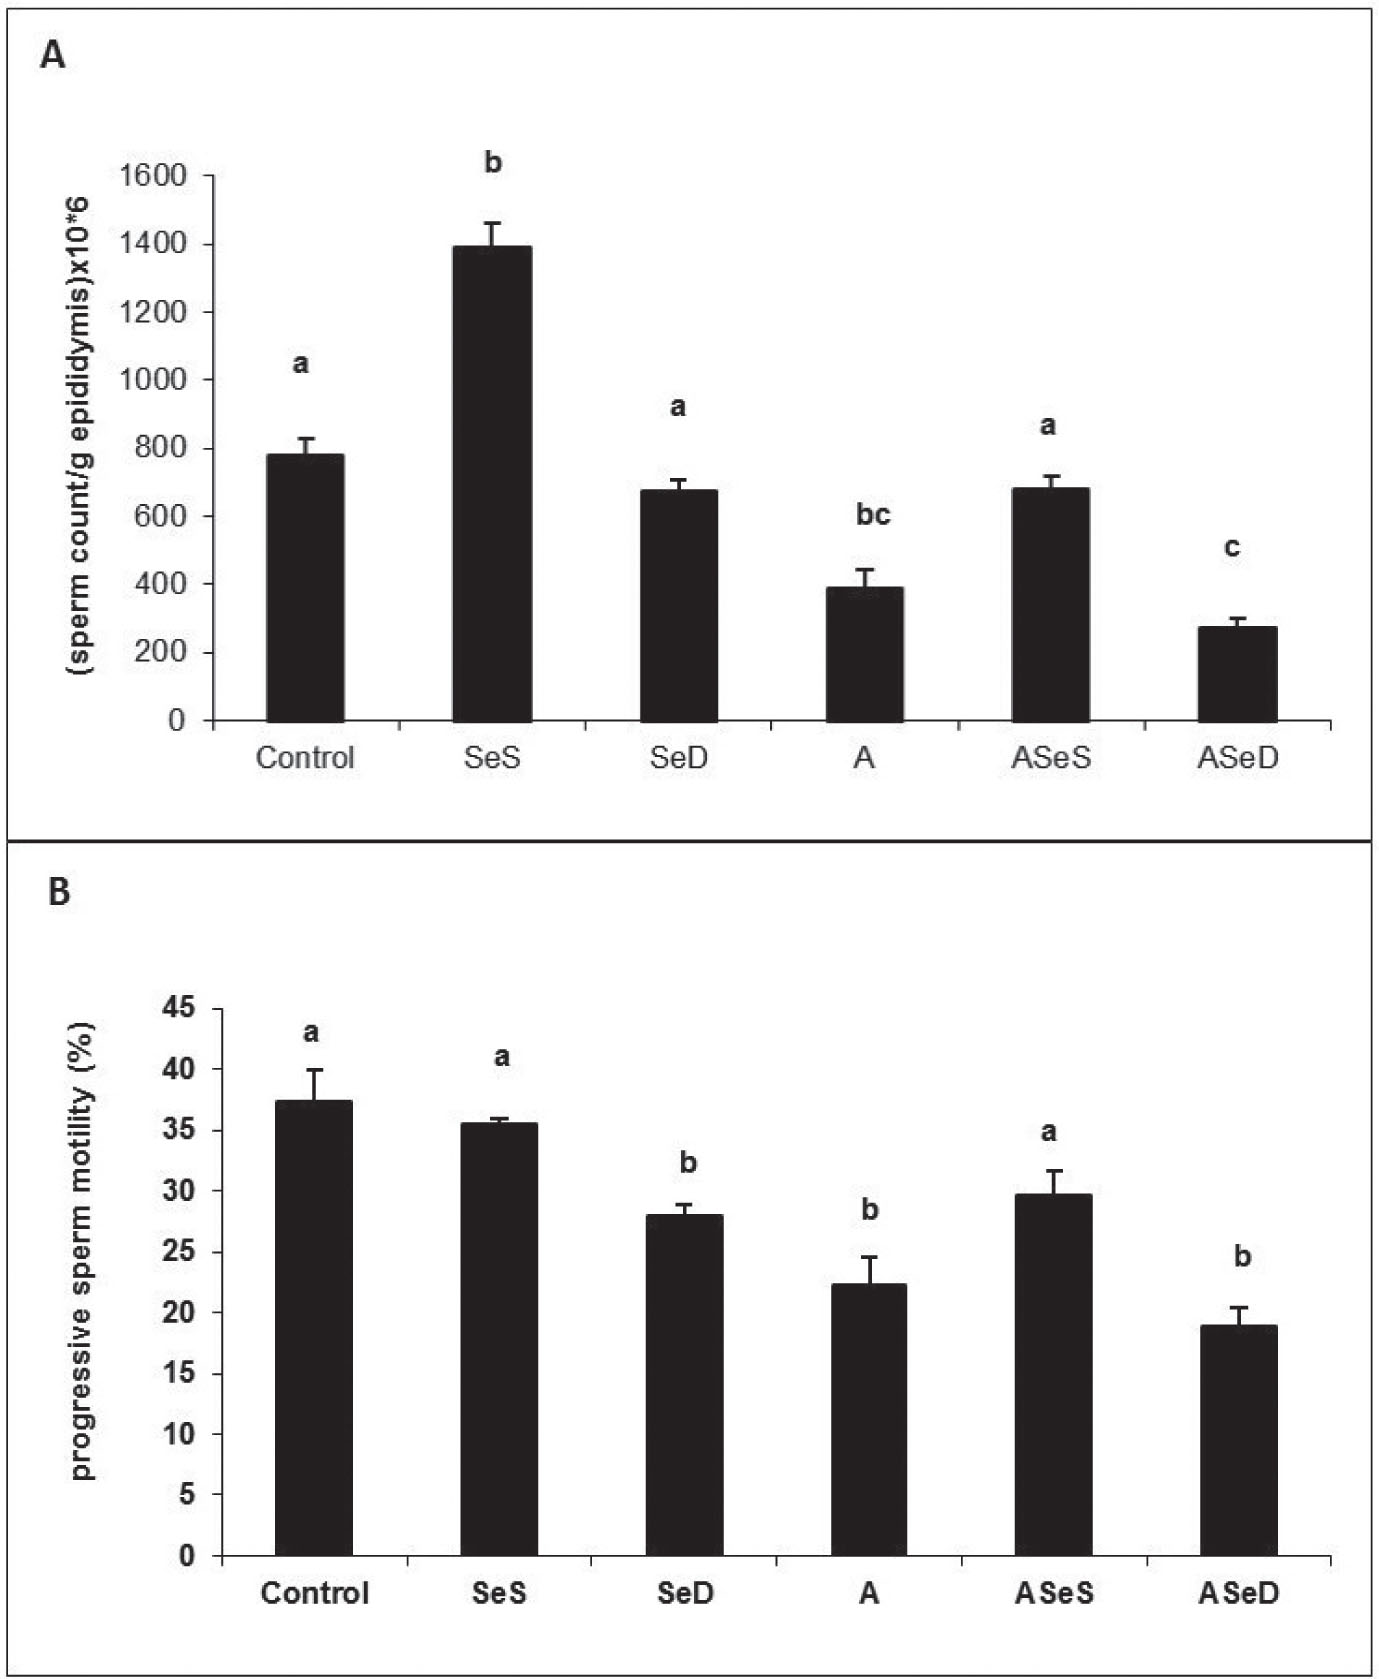
Figure 6
Mean sperm count (A) and viability (B) across the study groups. a, b, c Bars that do not share same superscript letters are significantly different (p<0.05). A – Aroclor 1254 group receiving 0.15 mg/kg/day of Se for 5 weeks and 10 mg/kg/day of Aroclor 1254 in corn oil for the last 15 days; ASeD – Se-deficient group receiving Aroclor 1254 as described above.; ASeS – Se-supplemented group receiving Aroclor 1254 as described above; Control – group receiving 0.15 mg/kg/day of Se for 5 weeks; SeD – Se-deficient group receiving 0.50 mg/kg/day of Se for 5 weeks; SeS – Se-supplemented group receiving 1 mg selenium/kg/day for 5 weeks
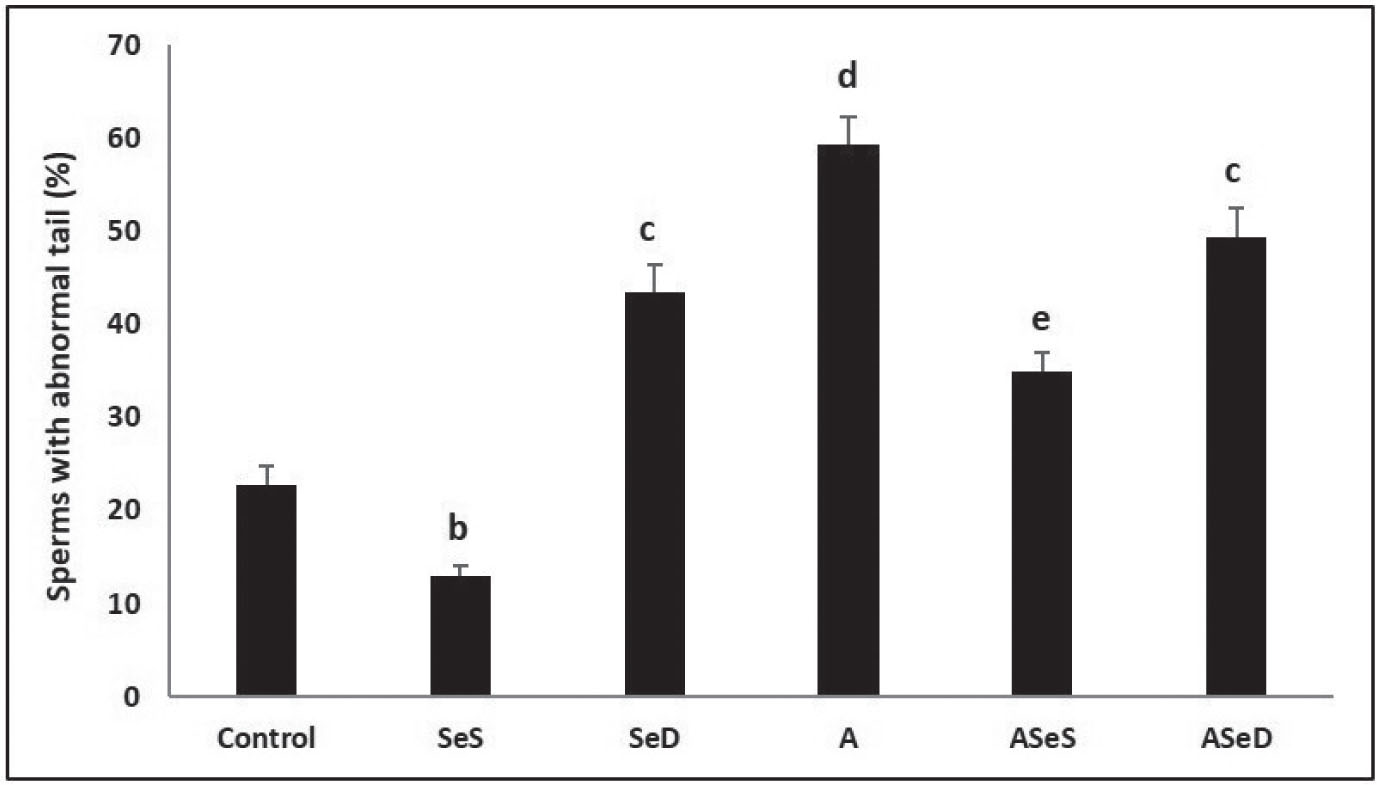
Figure 7
Mean prevalence of sperms with abnormal tails (%) across the study groups. a, b, c, d Bars that do not share same superscript letters are significantly different (p<0.05). A – Aroclor 1254 group receiving 0.15 mg/kg/day of Se for 5 weeks and 10 mg/kg/day of Aroclor 1254 in corn oil for the last 15 days; ASeD – Se-deficient group receiving Aroclor 1254 as described above.; ASeS – Se-supplemented group receiving Aroclor 1254 as described above; Control – group receiving 0.15 mg/kg/day of Se for 5 weeks; SeD – Se-deficient group receiving 0.50 mg/kg/day of Se for 5 weeks; SeS – Se-supplemented group receiving 1 mg selenium/kg/day for 5 weeks
Table 2
Antioxidant enzyme activities; antioxidant, lipid peroxidation, protein oxidation, and selenoprotein P levels and total antioxidant capacity in the study groups
| GPx1 (U/mg protein) | TrxR (U/mg protein) | SOD (U/mg protein) | CAT (nmol/min/mg protein) | GSH (nmol/mg protein) | MDA (nmol/mg protein) | Carbonyl groups (nmol/mg protein) | TAOC (nmol/mg protein) | SePP (ng/µg protein) | |
|---|---|---|---|---|---|---|---|---|---|
| Control | 0.12±0.01a | 0.19±0.02a | 0.13±0.01a | 3.71±0.22 ac | 3.32±0.24a | 1.42±0.04a | 0.72±0.04a | 25.27±0.60a | 7.25±0.64a |
| SeS | 0.14±0.01a | 0.25±0.01b | 0.14±0.02a | 4.04±0.26a | 3.67±0.14a | 1.34±0.15a | 0.63±0.08a | 26.69±1.46a | 8.59±1.65a |
| SeD | 0.06±0.01b | 0.12±0.02c | 0.11±0.01a | 2.97±0.15c | 1.75±0.04b | 1.55±0.07a | 0.75±0.04a | 26.15±0.53a | 4.31±0.74b |
| A | 0.10± 0.01c | 0.15±0.02c | 0.10±0.02b | 1.95±0.59b | 1.21±0.11c | 1.95±0.09b | 0.93±0.09b | 24.52±0.66a | 4.10±1.04b |
| ASeS | 0.13±0.01a | 0.19±0.02a | 0.12±0.01a | 3.75±0.2ac | 3.31±0.10a | 1.61±0.05a | 0.83±0.08a | 25.21±0.35a | 4.24±1.08b |
| ASeD | 0.08±0.02d | 0.11±0.02c | 0.09±0.01b | 2.10±0.19bc | 1.06±0.04c | 2.01±0.07b | 0.97±0.03b | 20.93±1.68b | 3.62±0.40b |
a, b, c, d Bars that do not share same superscript letters are significantly different (p<0.05). A – Aroclor 1254 group receiving 0.15 mg/kg/day of Se for 5 weeks and 10 mg/kg/day of Aroclor 1254 in corn oil for the last 15 days; ASeD – Se-deficient group receiving Aroclor 1254 as described above; ASeS – Se-supplemented group receiving Aroclor 1254 as described above; CAT – Catalase; Control – group receiving 0.15 mg/kg/day of Se for 5 weeks; GPx1 – Glutathione peroxidase 1; GSH – Glutathione; MDA – Malondialdehyde; SeD – Se-deficient group receiving 0.50 mg/kg/day of Se for 5 weeks; SePP – Selenoprotein P; SeS – Se-supplemented group receiving 1 mg selenium/kg/day for 5 weeks; SOD – Superoxide dismutase; TAOC – Total antioxidant capacity; TrxR – Thioredoxin reductase
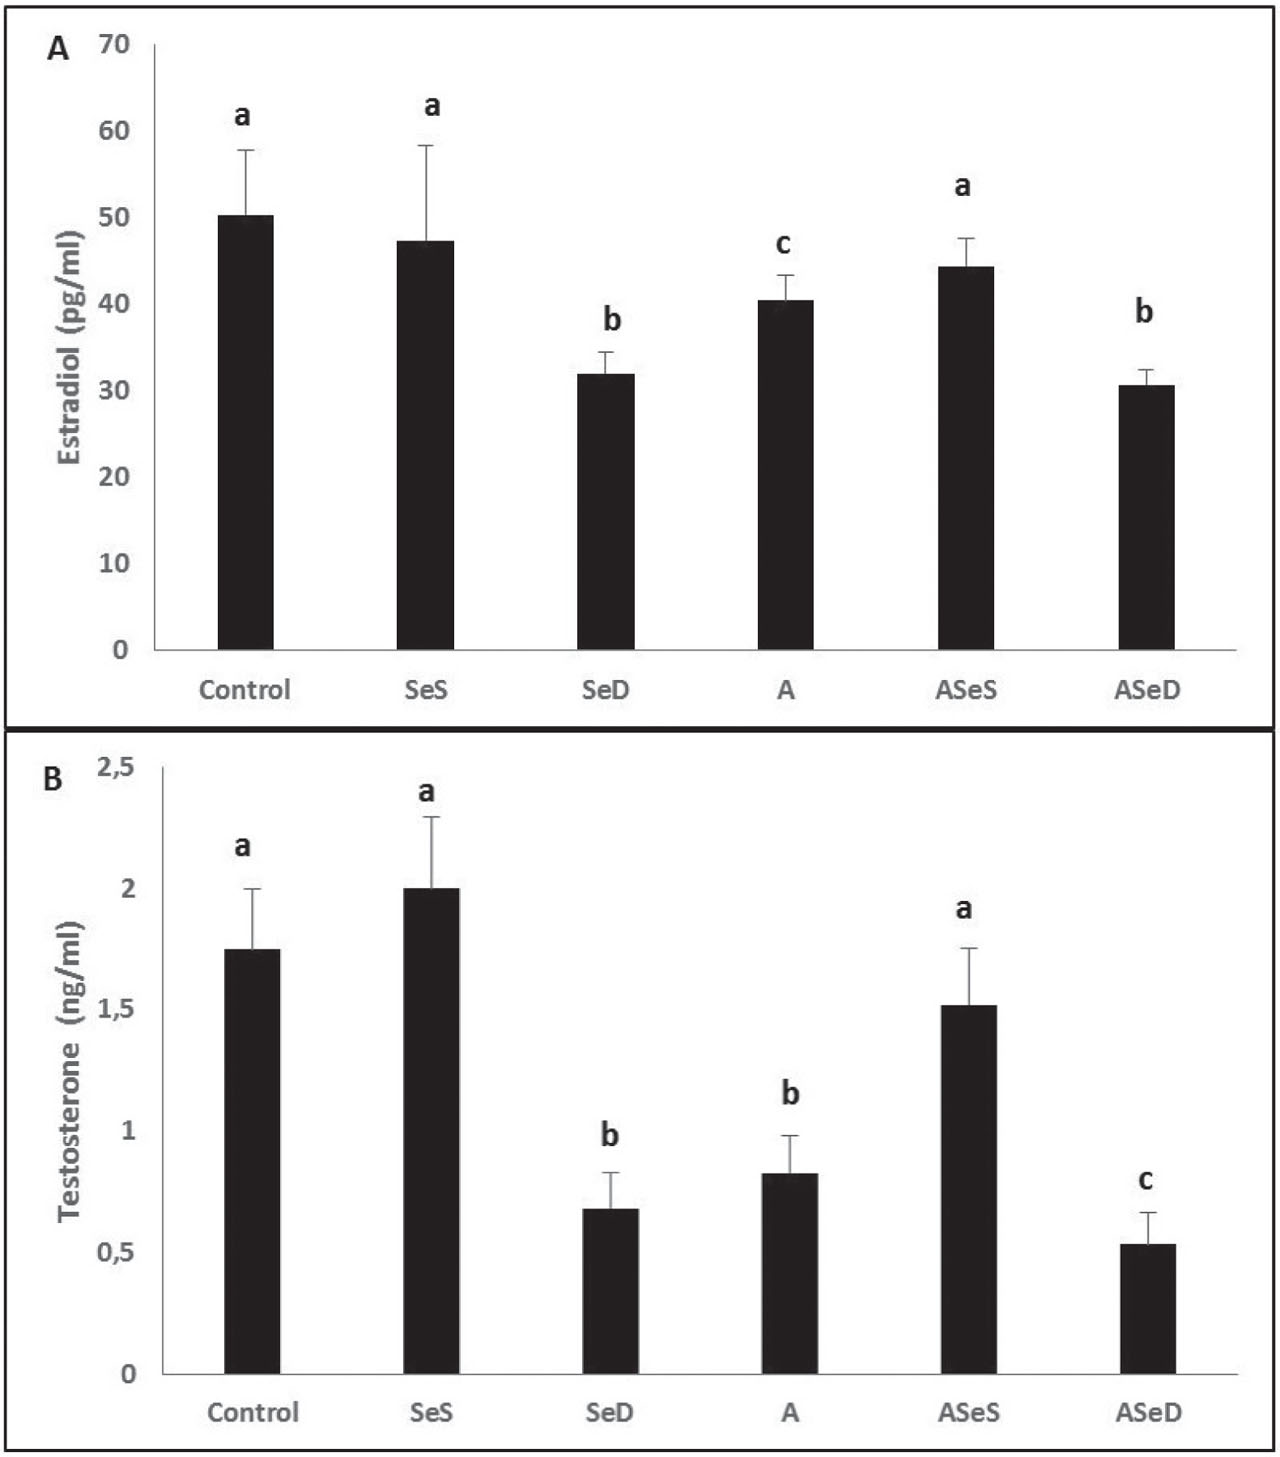
Figure 8
Mean oestradiol (A) and testosterone (B) levels across the study groups. a, b, c Bars that do not share same superscript letters are significantly different (p<0.05). A – Aroclor 1254 group receiving 0.15 mg/kg/day of Se for 5 weeks and 10 mg/kg/day of Aroclor 1254 in corn oil for the last 15 days; ASeD – Se-deficient group receiving Aroclor 1254 as described above.; ASeS – Se-supplemented group receiving Aroclor 1254 as described above; Control – group receiving 0.15 mg/kg/day of Se for 5 weeks; SeD – Se-deficient group receiving 0.50 mg/kg/day of Se for 5 weeks; SeS – Se-supplemented group receiving 1 mg selenium/kg/day for 5 weeks
Table 3
Caspase-3 and caspase-8 activities across the study groups
| Caspase-3 (µmol p-NA/min/mg protein) | Caspase-8 (nmol p-NA/min/mg protein) | |
|---|---|---|
| Control | 23.57±0.18a | 9.21±0.01a |
| SeS | 17.51±0.68a | 9.25±0.01a |
| SeD | 25.29±0.11a | 11.65±0.01b |
| A | 31.74±1.98b | 9.17±0.23a |
| ASeS | 22.18±1.31a | 8.96±0.01a |
| ASeD | 33.48±1.48b | 12.04±0.20b |
a, b Bars that do not share same superscript letters are significantly different (p<0.05). A – Aroclor 1254 group receiving 0.15 mg/kg/day of Se for 5 weeks and 10 mg/kg/day of Aroclor 1254 in corn oil for the last 15 days; ASeD – Se-deficient group receiving Aroclor 1254 as described above.; ASeS – Se-supplemented group receiving Aroclor 1254 as described above; Control – group receiving 0.15 mg/kg/day of Se for 5 weeks; p-NA – paranitroaniline; SeD – Se-deficient group receiving 0.50 mg/kg/day of Se for 5 weeks; SeS – Se-supplemented group receiving 1 mg selenium/kg/day for 5 weeks
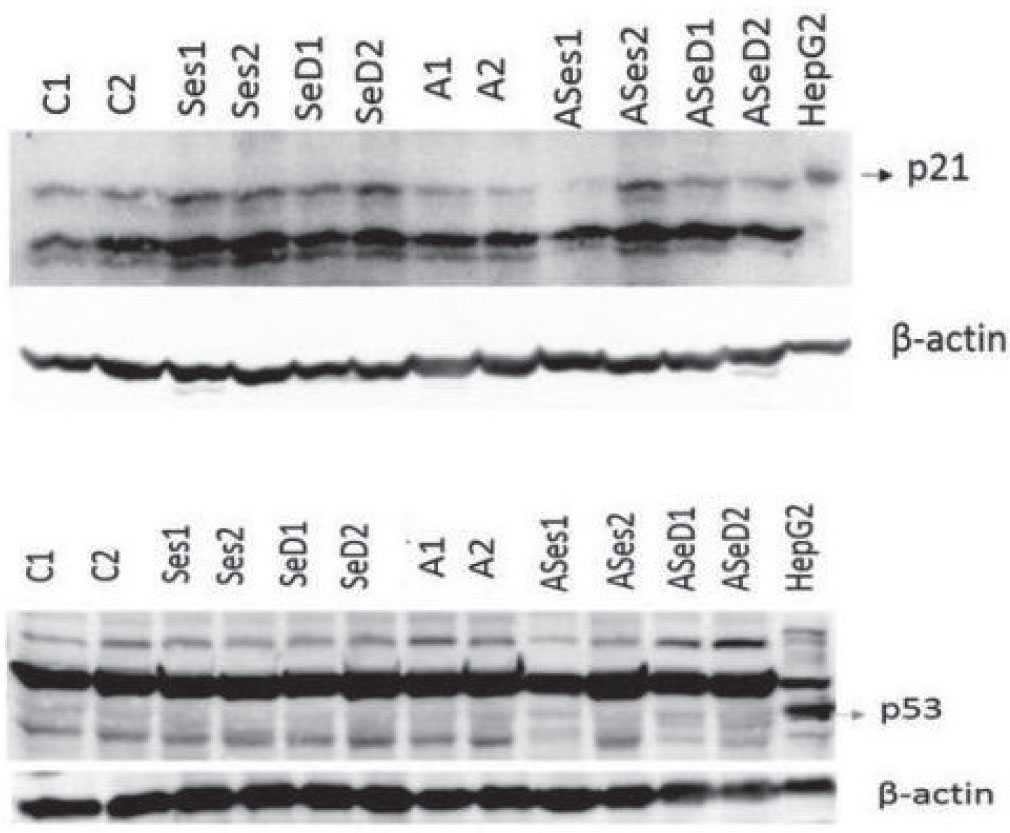
Figure 9
Western blot for two samples of p21 and p53 proteins for each study group. A – Aroclor 1254 group receiving 0.15 mg/kg/day of Se for 5 weeks and 10 mg/kg/day of Aroclor 1254 in corn oil for the last 15 days; ASeD – Se-deficient group receiving Aroclor 1254 as described above.; ASeS – Se-supplemented group receiving Aroclor 1254 as described above; Control – group receiving 0.15 mg/kg/day of Se for 5 weeks; HepG2 – positive control cells; SeD – Se-deficient group receiving 0.50 mg/kg/day of Se for 5 weeks; SeS – Se-supplemented group receiving 1 mg selenium/kg/day for 5 weeks