
Table 1
Physiochemical characterisation of the Bacillus paramycoides hydrolase enzyme
| Amino acids (N) | 932 |
| Molecular weight | 1869.85 |
| Theoretical pI | 5.18 |
| Negatively charged residues (N) | 127 |
| Positively charged resides (N) | 90 |
| Formula | C4492H7230N1258O1390S24 |
| Total No. of atoms | 14394 |
| Ext. coefficient | 26025 |
| Estimated half-life | 30 h (mammalian reticulocytes, in vitro) >20 h (yeast, in vivo) >10 h (Escherichia coli, in vivo) |
| Instability index | 38.07 |
| Aliphatic index | 100.71 |
| Grand average of hydropathicity | −0.095 |
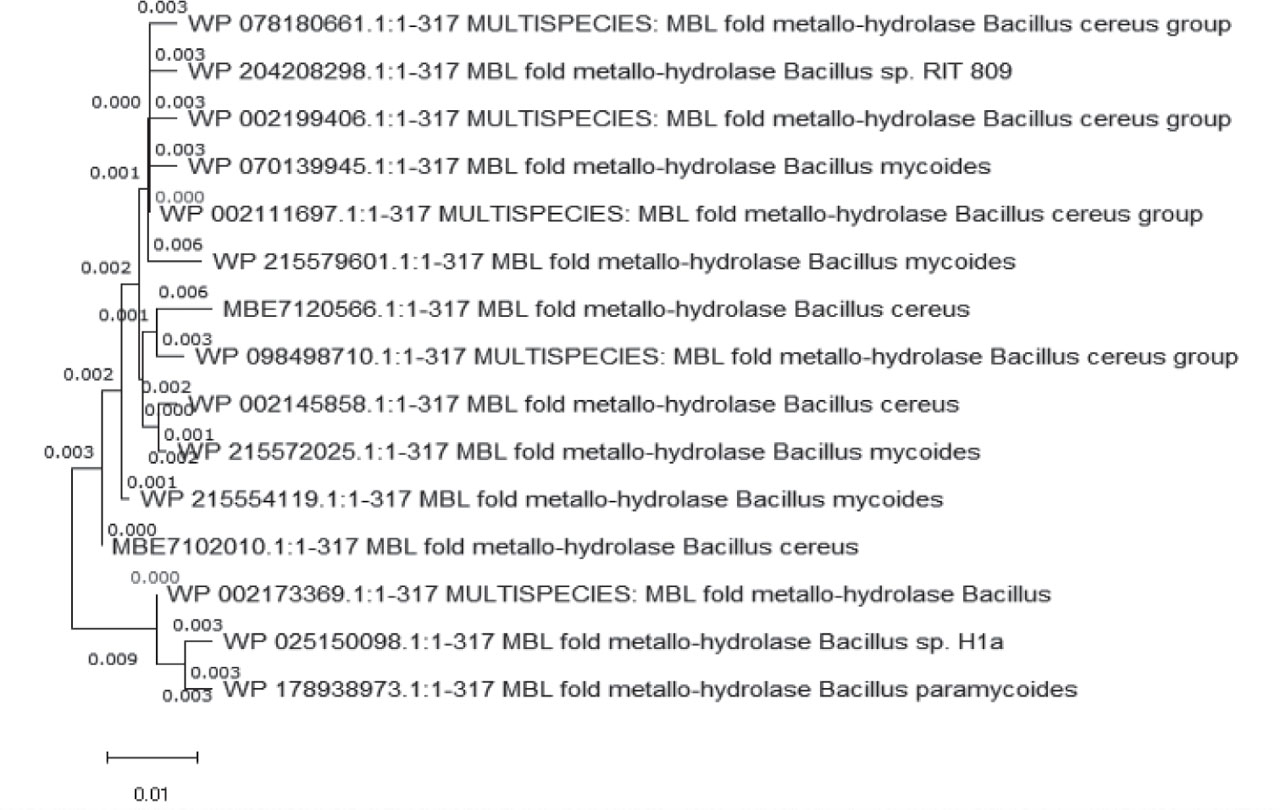
Figure 1
The phylogenetic tree for hydrolase
Table 2
Secondary structure predicted with SOPMA
| Alpha helix | Extended strands | Beta turns | Random coils |
|---|---|---|---|
| 41.64 % | 19.24 % | 7.57 % | 31.55 % |
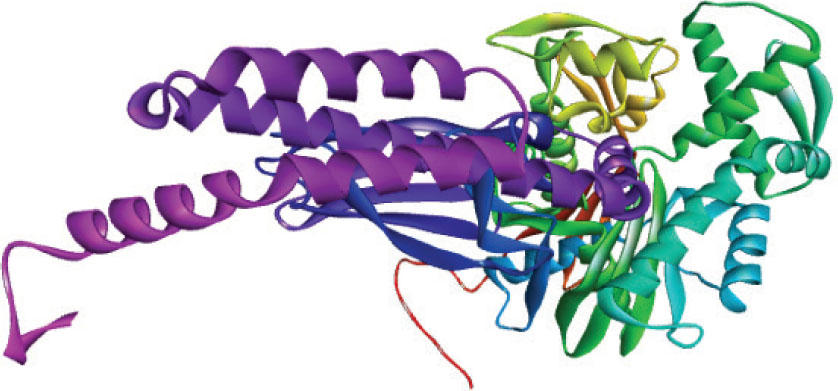
Figure 2
3D structure of hydrolase generated by the SWISS-MODEL tool. The purple region shows the Hsp70 chaperone of E. coli for the production of stable conjugate protein complex
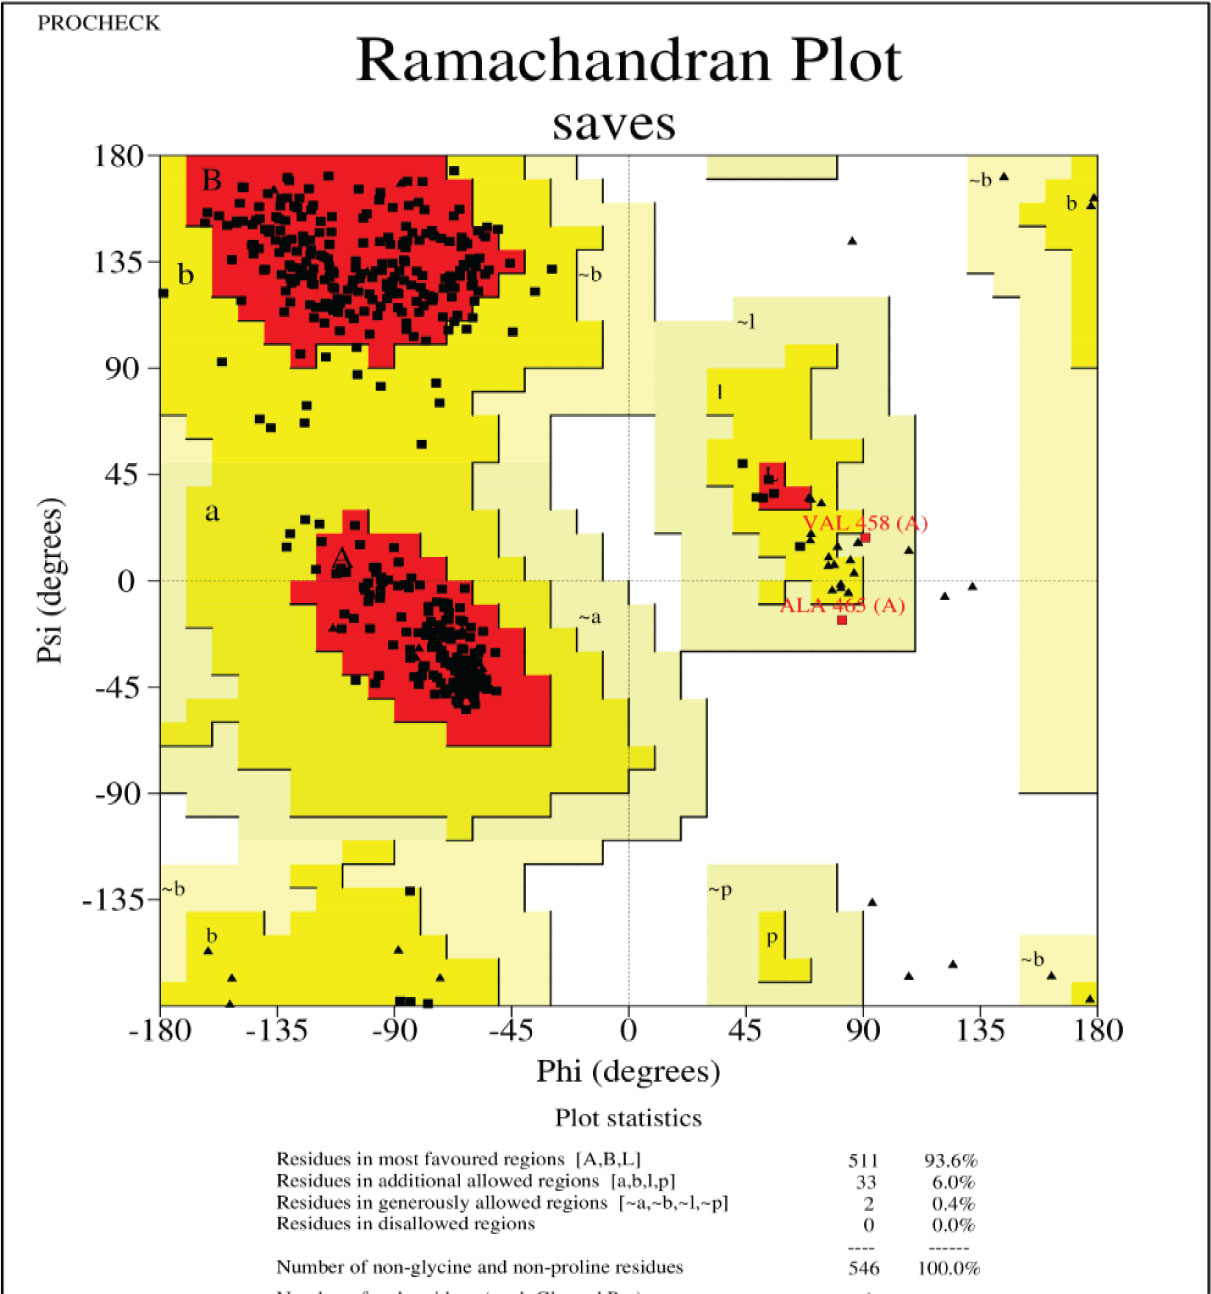
Figure 3
Ramachandran plot of hydrolase from Bacillus paramycoides
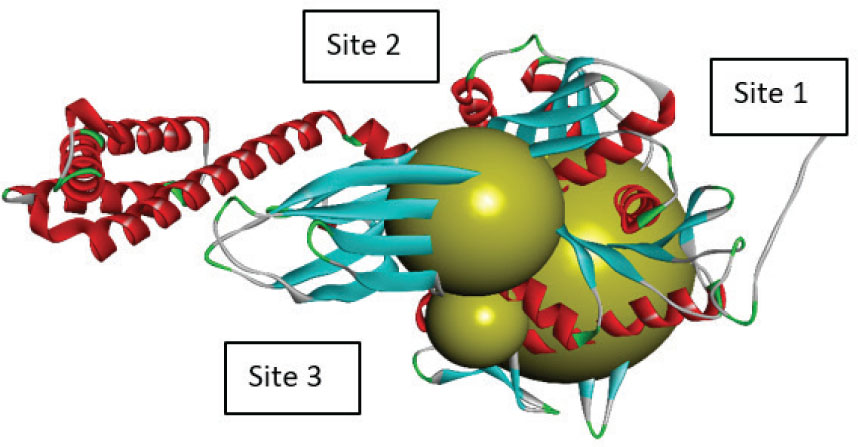
Figure 4
Active site prediction with Discovery Studio
Table 3
Active site prediction with Discovery Studio
| Sites | Dimensions XYZ | Point Count |
|---|---|---|
| Site 1 | 12.779000 / 8.882247 / −8.610573 | 5407 |
| Site 2 | −3.971000 / −3.617753 / 1.139427 | 1330 |
| Site 3 | −5.721000 / 12.132247 / −2.110573 | 708 |
Table 4
Selected propiconazole and its derivatives
| Ser. no. | Compound name | PubChem CID | Formula | Structure |
|---|---|---|---|---|
| 1 | (2R,4S)-2-(2,4-Dichlorophenyl)- 4-propyl-2-[(1H-1,2,4-triazol-1-yl) methyl]-1,3-dioxolane | 679162 | C15H17Cl2N3O2 | 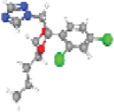 |
| 2 | 1-[[(2S,4S)-2-(2,4-dichlorophenyl)- 4-propyl-1,3-dioxolan-2-yl]methyl]- 1,2,4-triazole | 679164 | C15H17Cl2N3O2 | 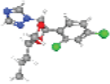 |
| 3 | 1-[[2-(2,4-Dichlorophenyl)-4- (2,2,3,3,3-pentadeuteriopropyl)-1,3- dioxolan-2-yl]methyl]-1,2,4-triazole | 129318213 | C15H17Cl2N3O2 | 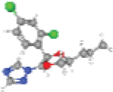 |
| 4 | Hispor | 156985 | C24H26Cl2N6O4 | 

|
| 5 | Propiconazole 4,4′-dihydroxybiphenyl | 86643422 | C27H27Cl2N3O4 |  |
| 6 | Propiconazole hydrochloride | 129773016 | C15H18Cl3N3O2 | 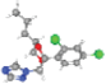 |
| 7 | Propiconazole TP1 | 155884399 | C13H11Cl2N3O4 | 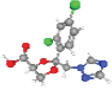 |
| 8 | Propiconazole TP2 | 703104 | C10H9Cl2N3O | 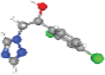 |
| 9 | Propiconazole-(phenyl-d3) | 124202653 | C15H17Cl2N3O2 |  |
| 10 | Propiconazole | 43234 | C15H17Cl2N3O2 |  |
| 11 | Propiconazole-d7 | 71751781 | C15H17Cl2N3O2 | 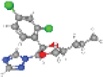 |
Table 5
Binding energies and types of intermolecular interactions of compounds with hydrolase
| Compounds | Molecular weight (g/mol) | Energy (kcal/mol) |
|---|---|---|
| 1-[[(2S,4S)-2-(2,4-dichlorophenyl)-4-propyl-1,3-dioxolan-2-yl] methyl]-1,2,4-triazole | 342.2 | −6.8 |
| Propiconazole TP1 | 344.15 | −6.6 |
| 1-[[2-(2,4-Dichlorophenyl)-4-(2,2,3,3,3-pentadeuteriopropyl)-1,3-dioxolan-2-yl]methyl]-1,2,4-triazole | 347.2 | −6.2 |
| Propiconazole | 342.2 | −6.2 |
| (2R,4S)-2-(2,4-Dichlorophenyl)-4-propyl-2-[(1H-1,2,4-triazol-1-yl)methyl]-1,3-dioxolane | 342.2 | −6.1 |
| Hispor | 533.4 | −6.1 |
| Propiconazole-d7 | 349.3 | −6.0 |
| Propiconazole 4,4′-dihydroxybiphenyl | 528.4 | −5.9 |
| Propiconazole hydrochloride | 378.7 | −5.9 |
| Propiconazole-(phenyl-d3) | 345.2 | −5.8 |
| Propiconazole TP2 | 258.1 | −5.7 |
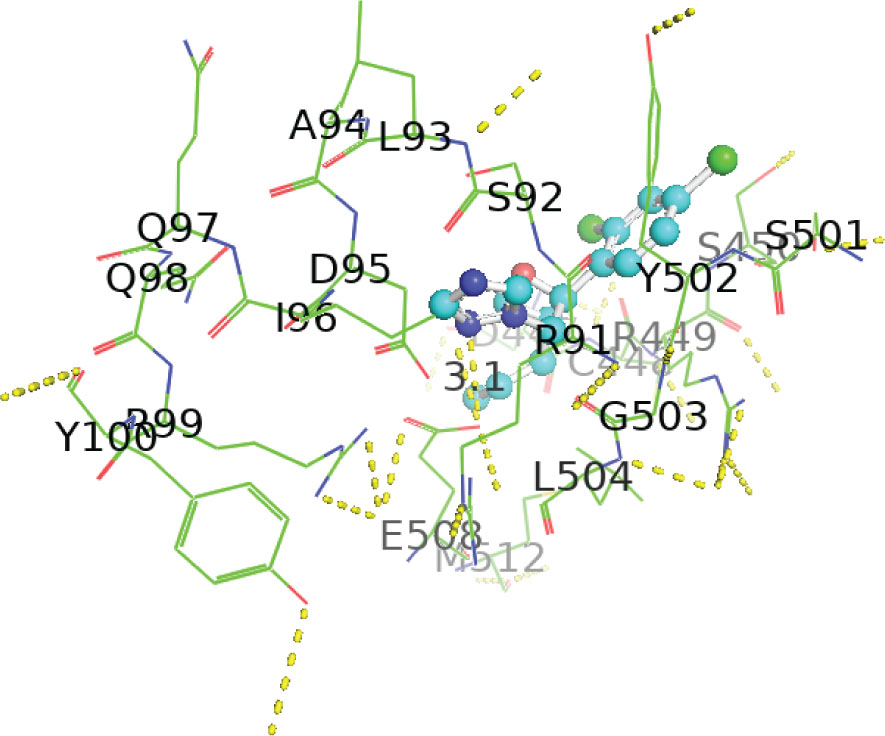
Figure 5
Interaction between hydrolase and (2R,4S)-2-(2,4-dichlorophenyl)-4-propyl-2-[(1H-1,2,4-triazol-1-yl)methyl]-1,3-dioxolane complex 1 visualised with PyMOL
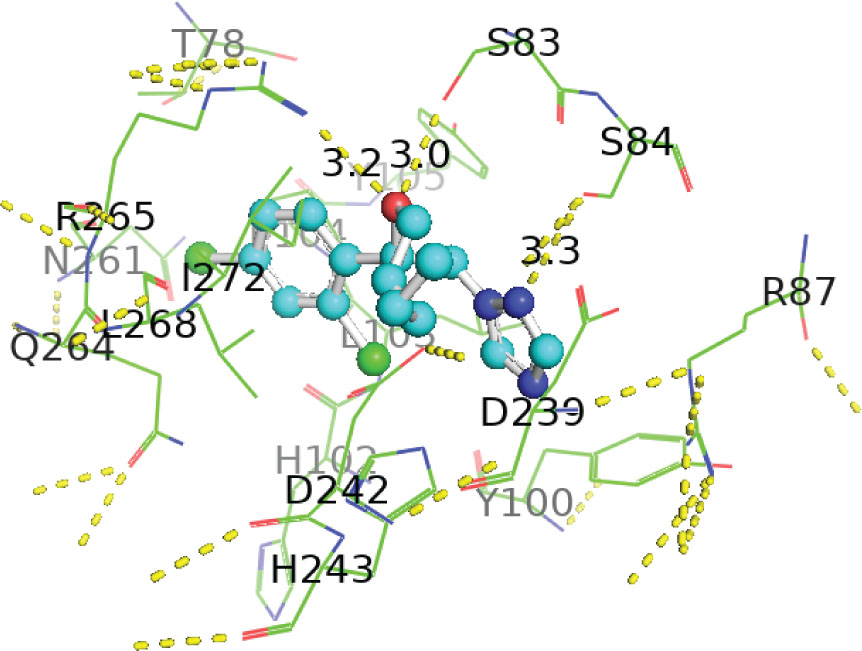
Figure 6
Interaction between hydrolase and 1-[[2-(2,4-dichlorophenyl)-4-(2,2,3,3,3-pentadeuteriopropyl)-1,3-dioxolan-2-yl]methyl]-1,2,4-triazole complex 2 visualised with PyMOL
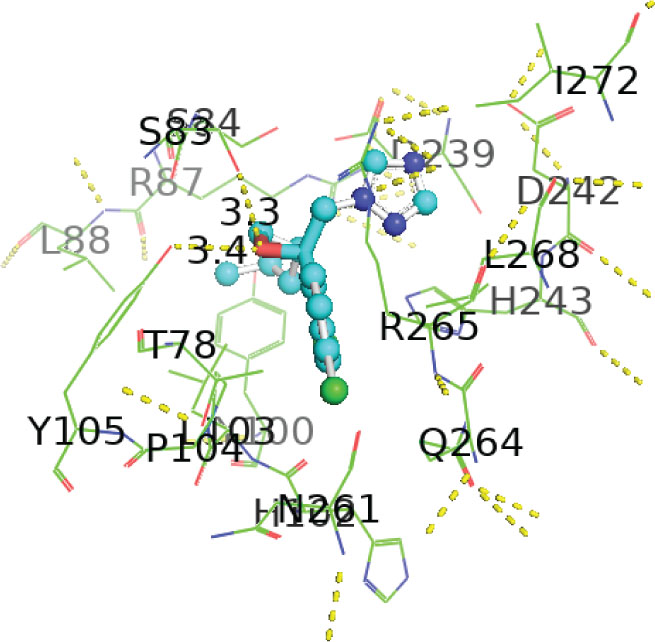
Figure 7
Interaction between hydrolase and 1-[[(2S,4S)-2-(2,4-dichlorophenyl)-4-propyl-1,3-dioxolan-2-yl]methyl]-1,2,4-triazole complex 3 visualised with PyMOL
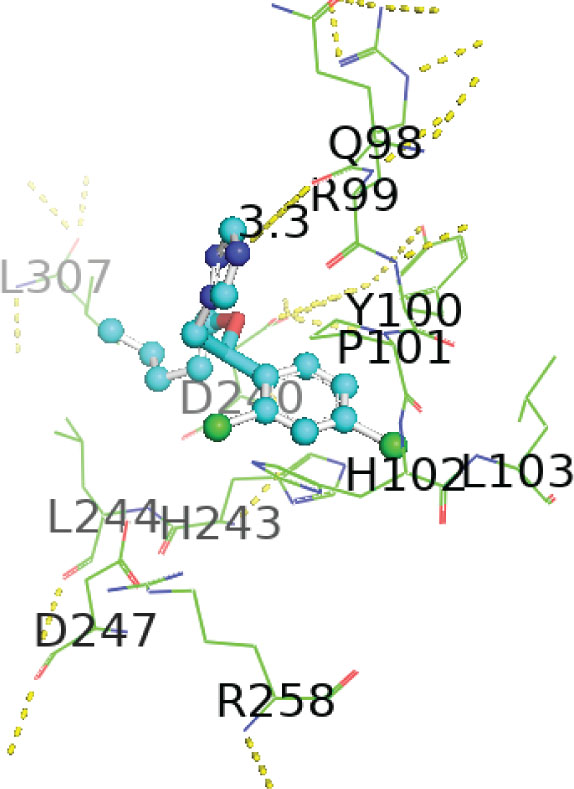
Figure 8
Interaction between hydrolase and propiconazole 4,4’-dihydroxybiphenyl complex 4 visualised with PyMOL
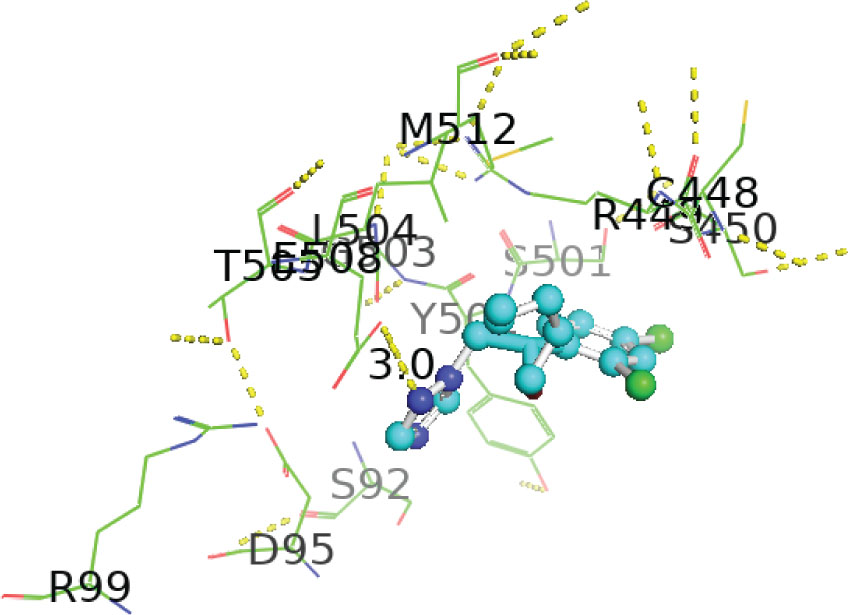
Figure 9
Interaction between hydrolase and propiconazole hydrochloride complex 5 visualised with PyMOL
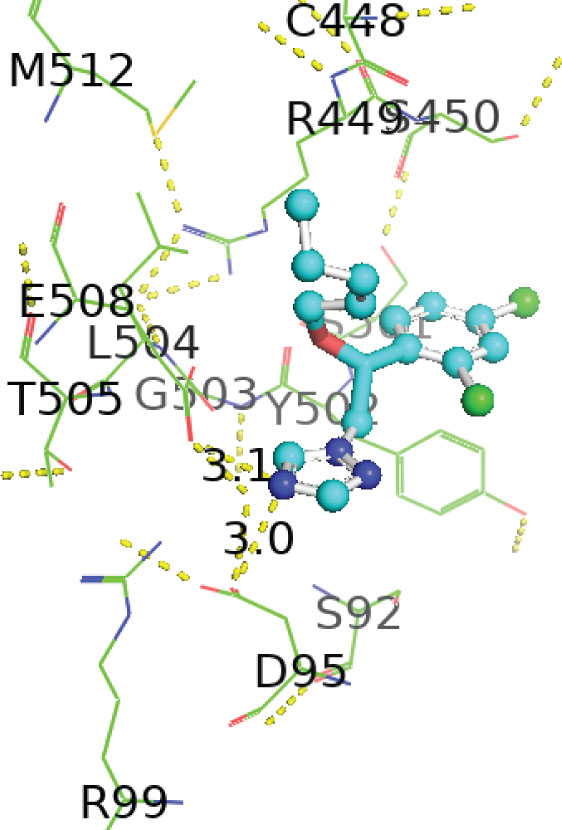
Figure 10
Interaction between hydrolase and propiconazole-d7 complex 6 visualised with PyMOL
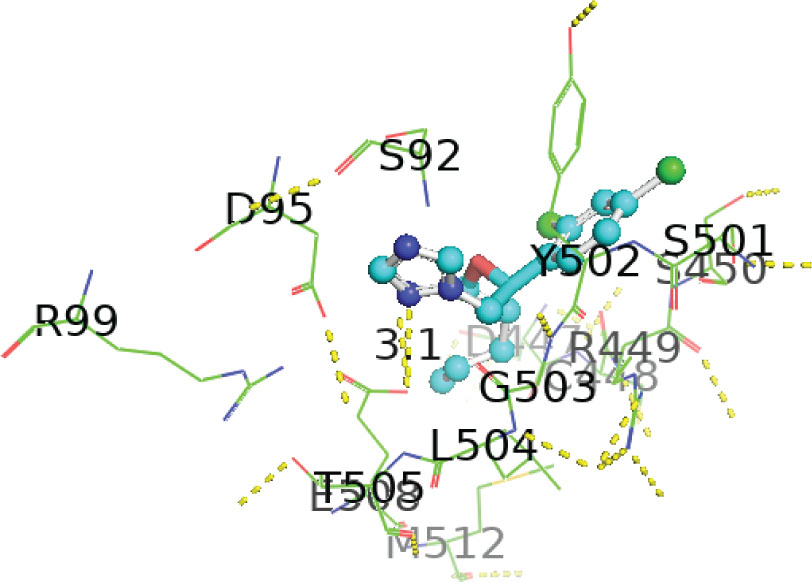
Figure 11
Interaction between hydrolase and propiconazole complex 7 visualised with PyMOL
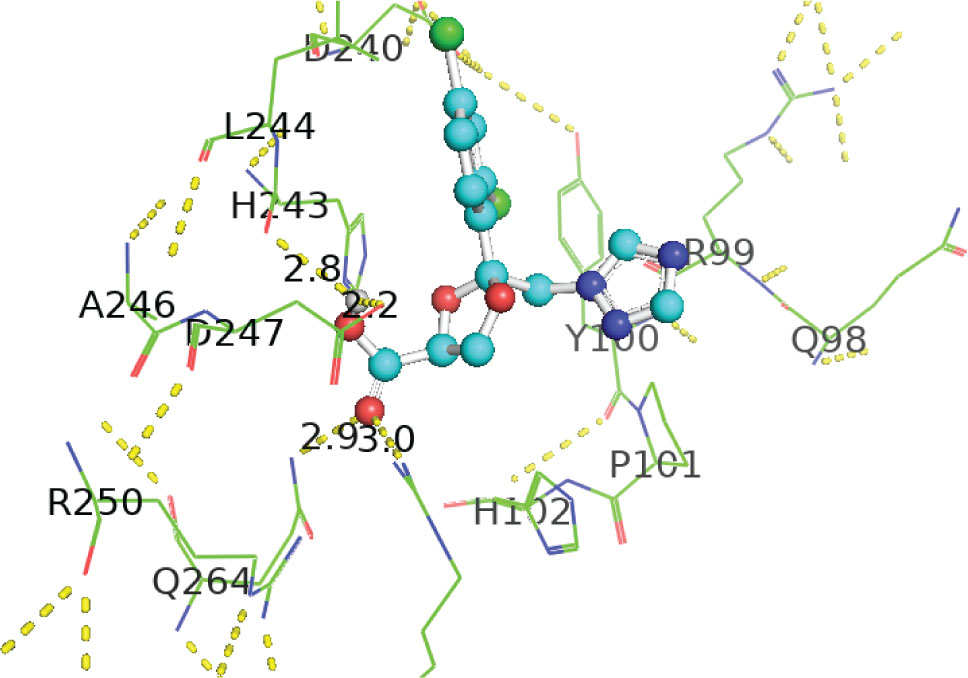
Figure 12
Interaction between hydrolase and propiconazole TP1 complex 8 visualised with PyMOL
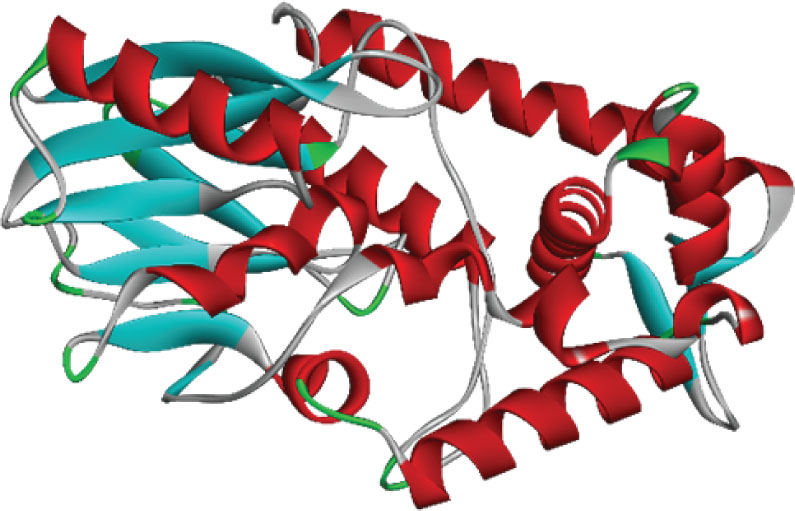
Figure 13
Mutated structure of hydrolase from Bacillus paramycoides
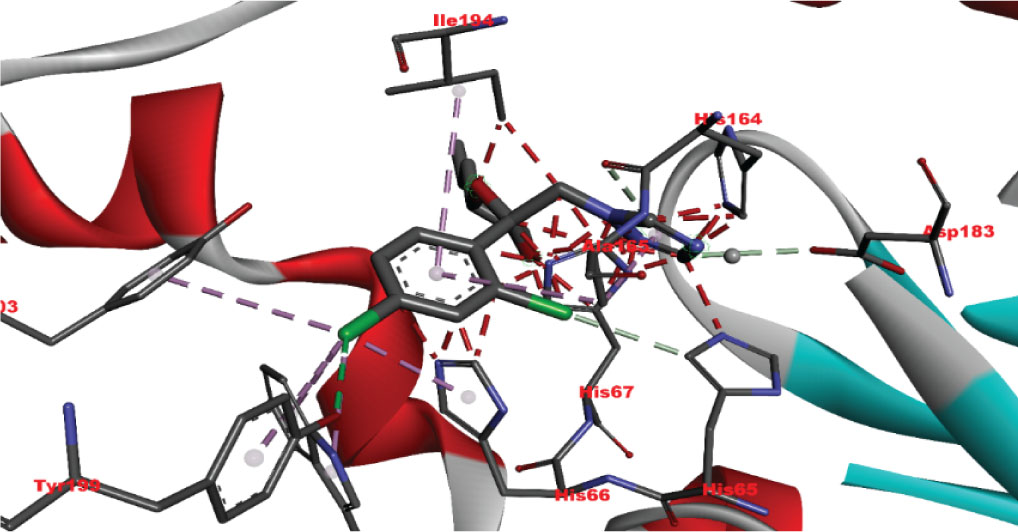
Figure 14
Interaction between hydrolase and propiconazole TP1. The ligand is positioned within the active site and stabilised by key catalytic residues, including His66, His67, and Trp92. Additional residues such as Phe13, Val15, Lys130, and Thr131 contribute through hydrophobic contacts and hydrogen bonding. Green lines represent hydrogen bonds, magenta lines hydrophobic and π–π interactions
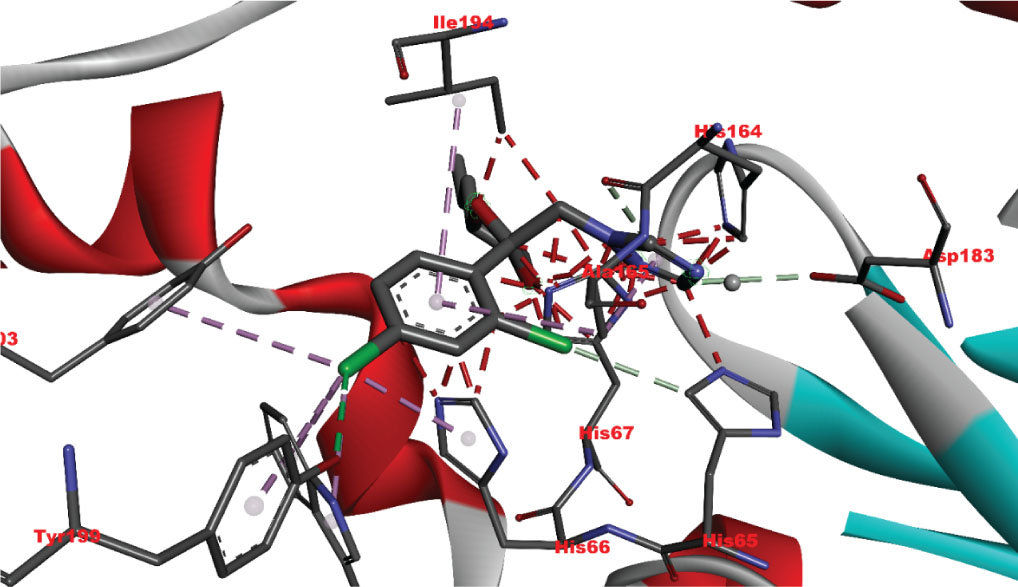
Figure 15
Interaction between mutated hydrolase and 1-[[2-(2,4-dichlorophenyl)-4-(2,2,3,3,3-pentadeuteriopropyl)-1,3-dioxolan-2-yl]methyl]-1,2,4-triazole
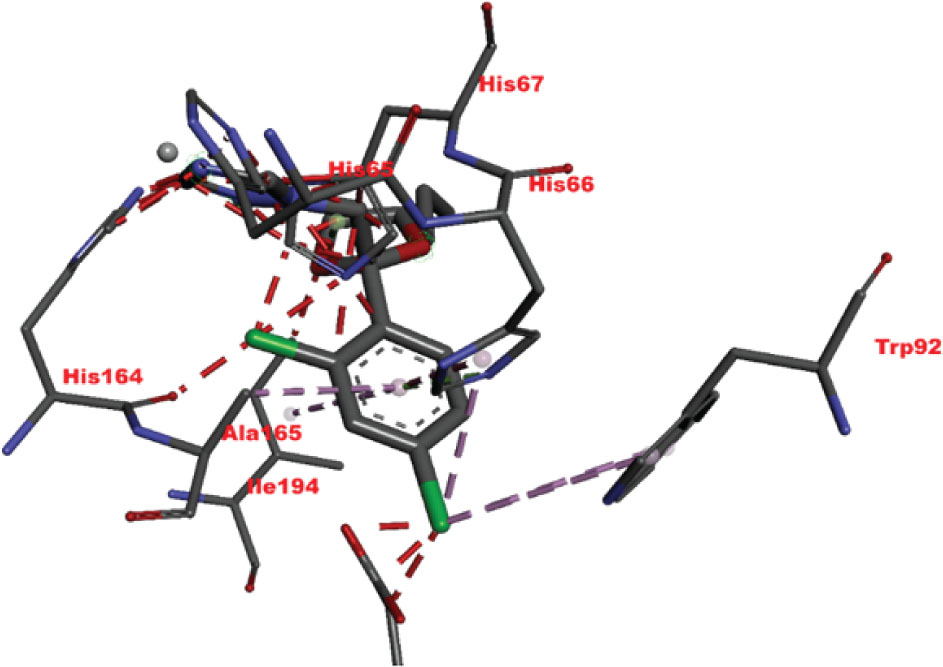
Figure 16
Interaction between mutated hydrolase and 1-[[(2S,4S)-2-(2,4-dichlorophenyl)-4-propyl-1,3-dioxolan-2-yl] methyl]-1,2,4-triazole
Table 6
Identified mutations and classification of mutants in silico
| Metallo-ß-lactamase fold metallo-hydrolase by species | Accession number | Amino acid substituted | Mutation position | Amino acid replaced with | I-mutant results | MU-PRO result | PHD-SNP results | SIFT results |
|---|---|---|---|---|---|---|---|---|
| Bacillus paramycoides | WP_178938973.1 | D | 151 | E | Increase | Increase | Neutral | Neutral |
| Bacillus cereus | WP_193645052.1 | N | 82 | K | Decrease | Decrease | Deleterious | Deleterious |
| Bacillus mycoides | WP_215554119.1 | V | 238 | M | Decrease | Decrease | Deleterious | Neutral |
| Bacillus thuringiensis | WP_264539129.1 | D | 123 | G | Decrease | Decrease | Neutral | Deleterious |
| Bacillus nitratireducens | WP_044737773.1 | L | 312 | W | Decrease | Increase | Neutral | Deleterious |
| Bacillus sp. CDB3 | WP_128853480.1 | H | 47 | Q | Decrease | Increase | Deleterious | Neutral |
| Bacillus sp. TH12 | WP_201056898.1 | A | 119 | V | Increase | Increase | Neutral | Neutral |
| Bacillus sp. NP247 | WP_219920057.1 | V | 50 | A | Decrease | Decrease | Deleterious | Deleterious |
| Bacillus sp. MYb209 | WP_105584583.1 | T | 33 | I | Decrease | Decrease | Neutral | Neutral |
| Bacillus toyonensis | WP_097999873.1 | K | 108 | R | Decrease | Decrease | Neutral | Neutral |
Table 7
Docking and interaction study of hydrolase with the best three propiconazole derivatives
| Pollutants | Docking energies (kcal/mol) | Amino acid residues | Distance between interacting amino acid residues (Å) | Type of bond interaction |
|---|---|---|---|---|
| Propiconazole TP1 | −7.4 | HIS66, TRP92, HIS67, VAL15, THR131, PHE13, LYS130 | 2.84, 2.93, 3.14, 4.26, 5.01, 4.92, 4.67, 4.99, 5.23, 3.02 | Alkyl, pi-alkyl, conventional, Pi-Pi T-shaped, hydrogen bonds, Van der Waals forces |
| 1-[[(2S,4S)-2-(2,4-dichlorophenyl)-4-propyl-1,3-dioxolan-2-yl] methyl]-1,2,4-triazole | −7.1 | HIS67, HIS66, TRP92, ILE192, ALA165, HIS164, HIS65 | 3.94, 4.85, 4.71, 4.31, 4.57, 3.68 | Pi-lone pair, Pi-alkyl, Pi-Pi T-shaped, Van der Waals forces |
| 1-[[2-(2,4-Dichlorophenyl)-4-(2,2,3,3,3-pentadeuteriopropyl)-1,3-dioxolan-2-yl]methyl]-1,2,4-triazole | −7.1 | ILE194, HIS164, ASP183, ALA165, TYR139 HIS67, HIS66, HIS65, | 4.42, 2.95, 2.75, 4.44, 5.50, 5.41, 3.76, 4.82, 2.70, 3.61, 2.08 | Alkyl, pi-alkyl, conventional, Pi-Pi T-shaped, carbon, Waals forces hydrogen bonds, Van der |
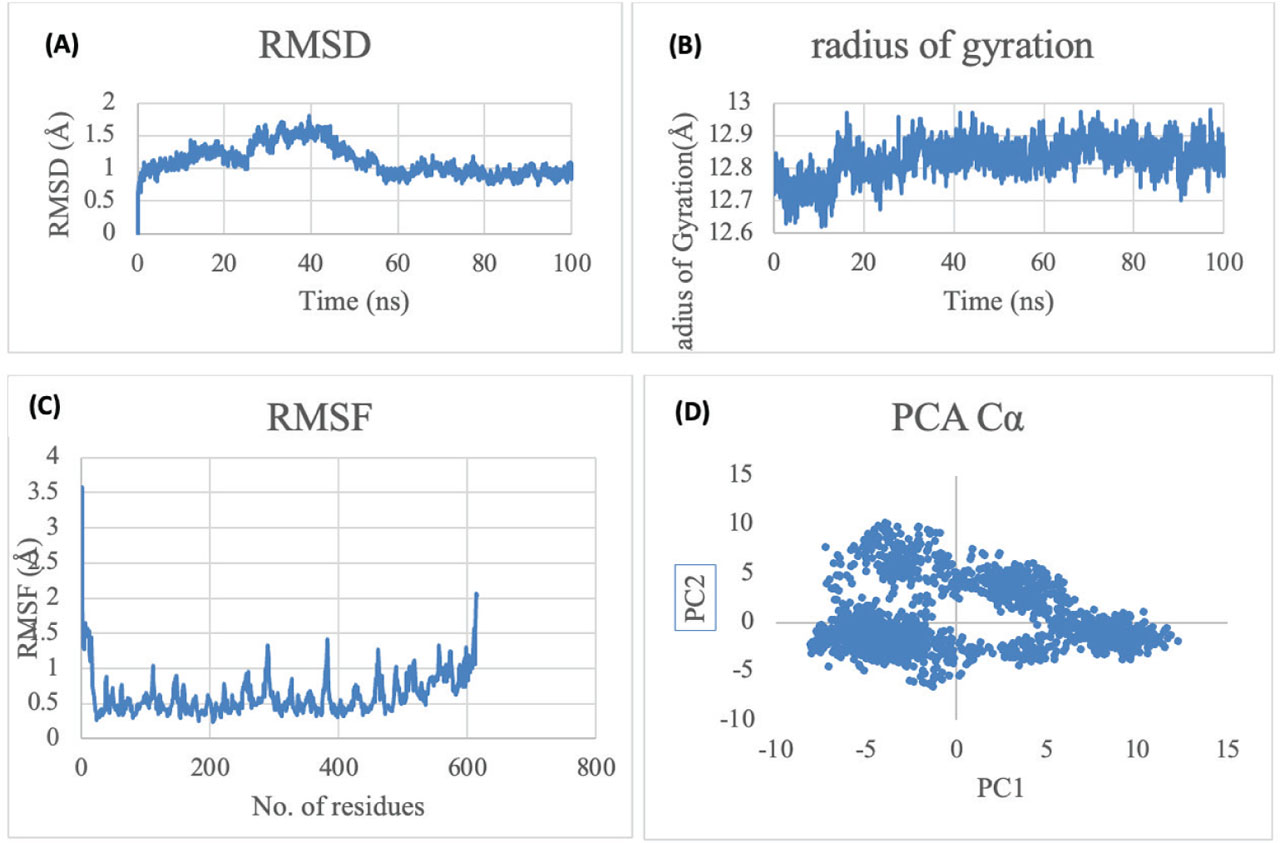
Figure 17
Protein–ligand complex analysis in molecular dynamics simulation. A) Root mean square deviation (RMSD) shows the overall structural stability of the complex by tracking backbone fluctuations over time. B) Radius of gyration (Rg) shows the compactness and structural integrity of the protein; consistent Rg values suggest a stable and well-folded conformation. C) Root mean square fluctuation (RMSF) highlights residue-specific flexibility, identifying regions with higher mobility such as loops, binding pockets, or terminal ends. D) Principal component analysis (PCA) illustrates dominant collective motions and major conformational transitions of the complex, helping to visualise large-scale structural dynamics that influence ligand binding and enzyme function
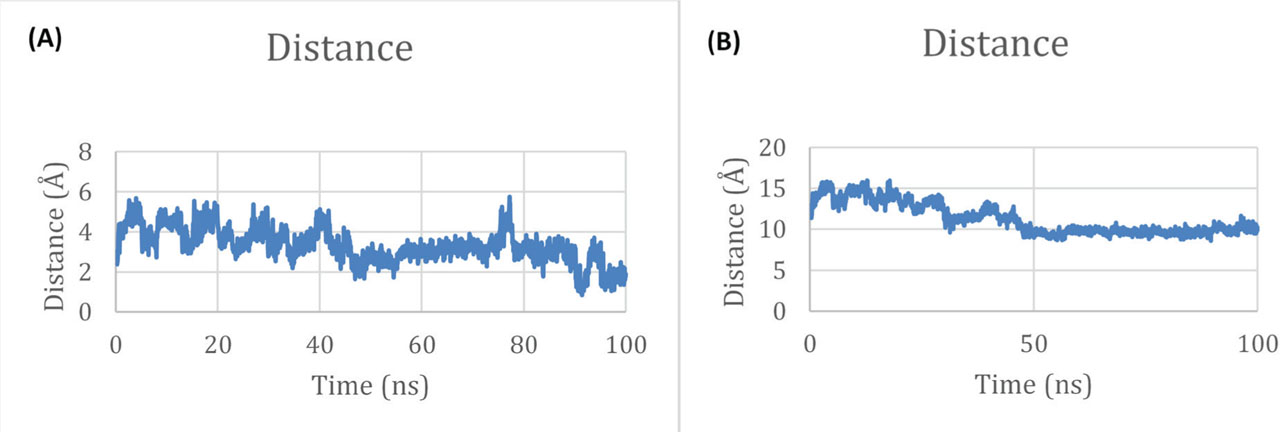
Figure 18
Distance analysis between the ligand and key protein residues in molecular dynamics simulation. A) Ligand-catalytic residue distances are consistently short (0.98–2.89 Å), which indicates stable interactions, essential for catalytic activity and effective binding. B) Significantly larger separation between the ligand and selected, non-catalytic residues (25.83–28.99 Å) confirms that these residues do not directly participate in ligand interaction and remain structurally distant throughout the simulation
Table 8
MM/GBSA complex–receptor–ligand energy decomposition
| Energy component | Average | SD | SEM |
|---|---|---|---|
| VDWAALS | −39.6668 | 5.9813 | 1.8915 |
| EEL | −0.6035 | 2.2259 | 0.7039 |
| EGB | 8.0517 | 2.9888 | 0.9451 |
| ESURF | −3.6938 | 0.5431 | 0.1718 |
| DELTA G gas | −40.2703 | 5.9055 | 1.8675 |
| DELTA G solv | 4.3579 | 3.1938 | 1.0100 |
| DELTA TOTAL | −35.9124 | 6.4629 | 2.0437 |
Table 9
MM/PBSA complex–receptor–ligand energy decomposition
| Energy component | Average | SD | SEM |
|---|---|---|---|
| VDWAALS | −39.6668 | 5.9813 | 1.8915 |
| EEL | −0.6035 | 2.2259 | 0.7039 |
| EPB | 12.9297 | 5.5557 | 1.7569 |
| ENPOLAR | −21.1805 | 3.2240 | 1.0195 |
| EDISPER | 41.7699 | 4.0950 | 1.2950 |
| DELTA G gas | −40.2703 | 5.9055 | 1.8675 |
| DELTA G solv | 33.5192 | 6.0584 | 1.9158 |
| DELTA TOTAL | −6.7511 | 7.0464 | 2.2283 |