
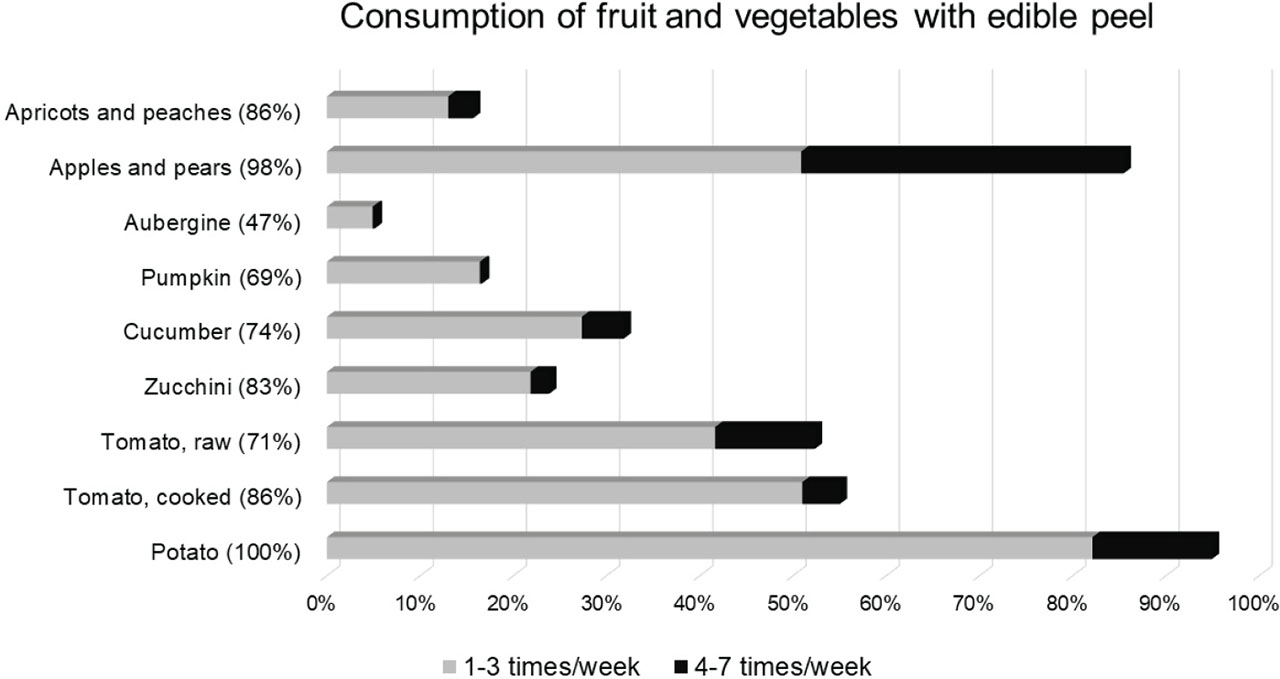
Figure 1
Consumption frequency of certain fruits and vegetables with edible peel in the 1st (2022–2023) wave of the PyrOPECh cohort study (N=459). For each food item, the percentage of consumers in the whole sample is shown
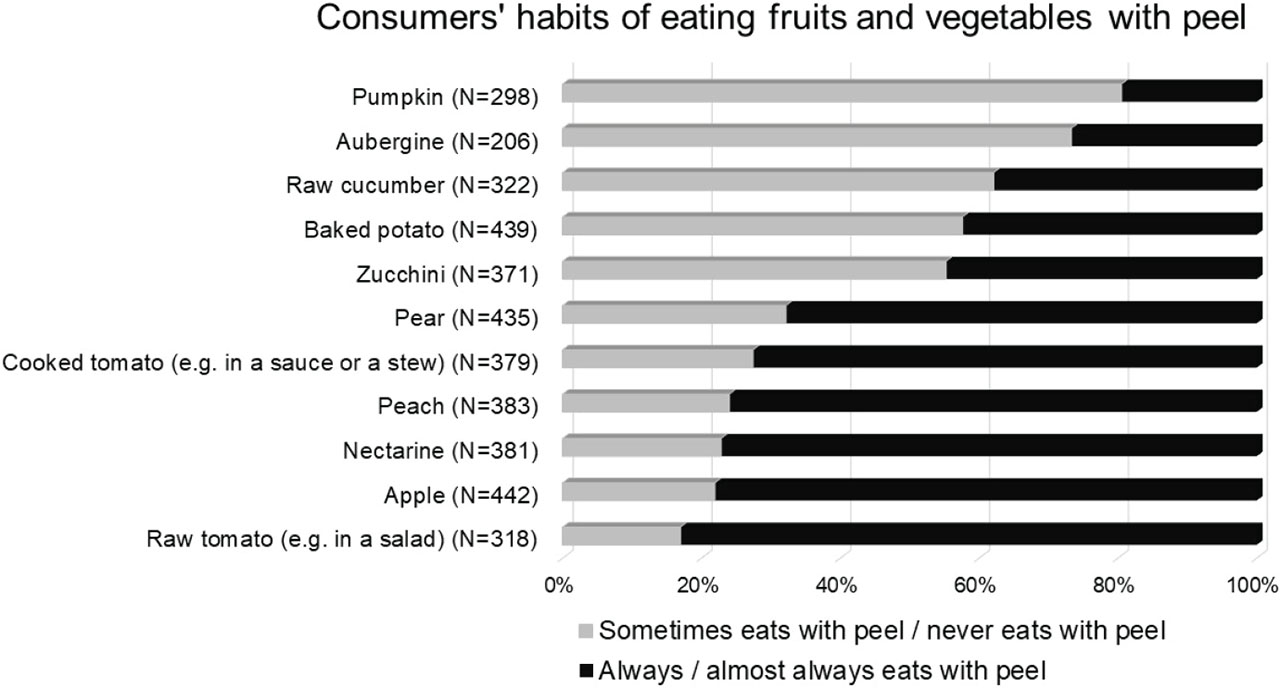
Figure 2
Consumers' habits of eating fruits and vegetables with peel in the 1st (2022–2023) wave of the PyrOPECh cohort study. The percentage is expressed only for those participants who stated that their son eats a respective food item (the number of those participants is shown in brackets). The participants who did not answer the question regarding peeling were excluded from the figure
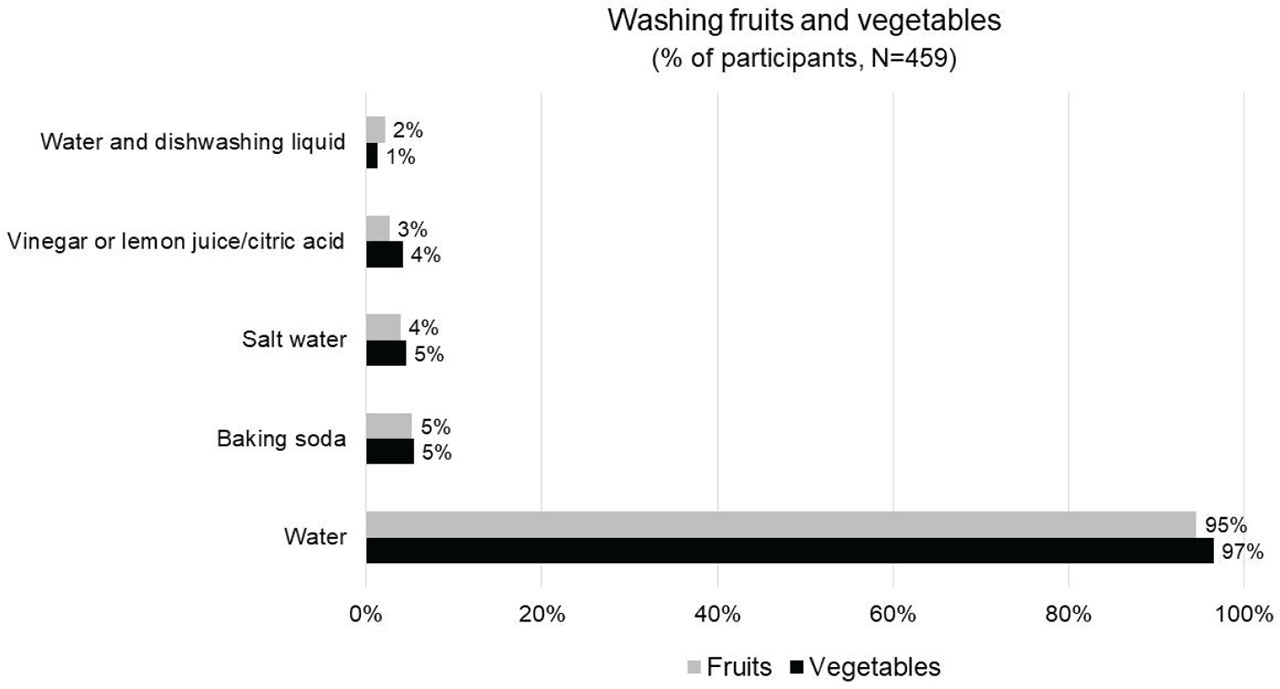
Figure 3
Household methods used for washing fruits and vegetables before consumption in the 1st (2022 – 2023 ) wave of the PyrOPECh cohort study. The percentages refer to the participants who stated that they always or almost always apply a specific cleaning method