
Table 1
Serum sodium, potassium, and calcium levels in mice by groups and sex (medians and ranges)
| Group | Sex | Sodium (mmol/L) | Potassium (mmol/L) | Calcium (mmol/L) |
|---|---|---|---|---|
| C | Both | 153 (145–161) | 4.8 (4.3–4.9) | 1.75 (1.65–1.90) |
| V | 152 (140–160) | 6.3 (4.6–8.5)* | 1.82 (1.80–1.92) | |
| N | 148 (147–165) | 5.5 (5.3–5.9) | 1.81 (1.70–1.90) | |
| V+N | 154 (141–161) | 5.1 (4.2–5.8) | 1.80 (1.60–1.90) | |
| C | Male | 155 (153–161) | 4.8 (4.3–4.9) | 1.84 (1.80–1.90) |
| Female | 153 (145–159) | 4.8 (4.4–4.8) | 1.75 (1.65–1.82) | |
| V | Male | 151 (140–158) | 7.2 (5.6–8.5)* | 1.82 (1.80–1.91) |
| Female | 152 (149–160) | 5.0 (4.6–7.0)# | 1.83 (1.80–1.92) | |
| N | Male | 158 (147–165) | 5.6 (5.3–5.9) | 1.81 (1.75–1.90) |
| Female | 145 (142–152) | 5.4 (5.3–5.6) | 1.82 (1.70–1.89) | |
| V+N | Male | 157 (152–161) | 5.1 (4.5–5.3) | 1.80 (1.62–1.90) |
| Female | 150 (141–159) | 5.2 (4.2–5.8) | 1.81 (1.60–1.90) |
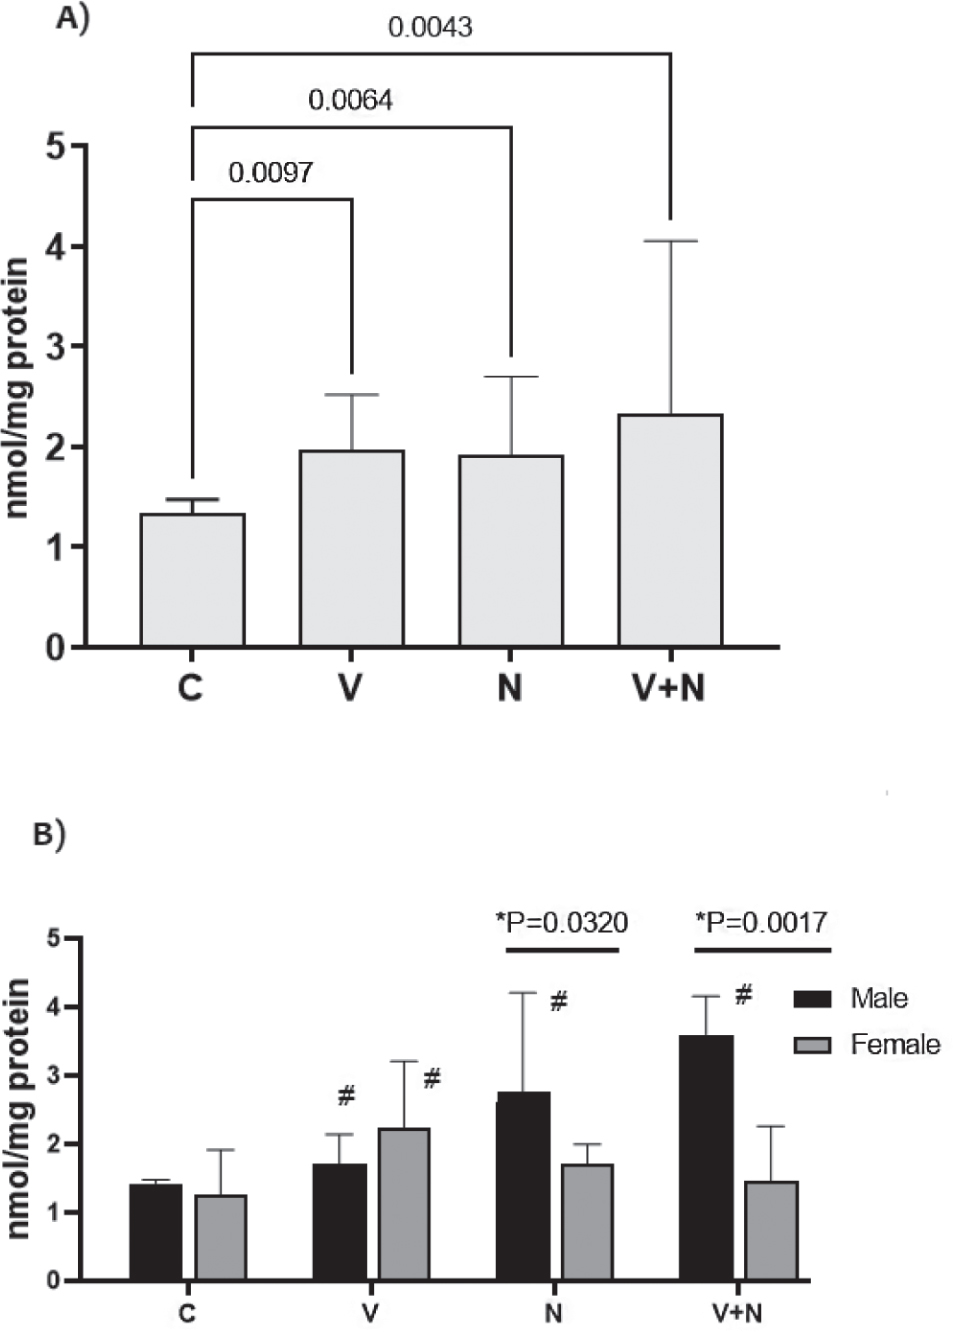
Figure 1
Kidney tissue MDA levels in mice by groups (A) and by sex and groups (B). C – control group; N – group receiving naringin (25 mg/kg); V – group receiving valproate (150 mg/kg), V+N – group receiving valproate (150 mg/kg) + naringin (25 mg/kg). Connecting lines – significant differences (p<0.05) between the groups. # significant differences (p<0.05) from control
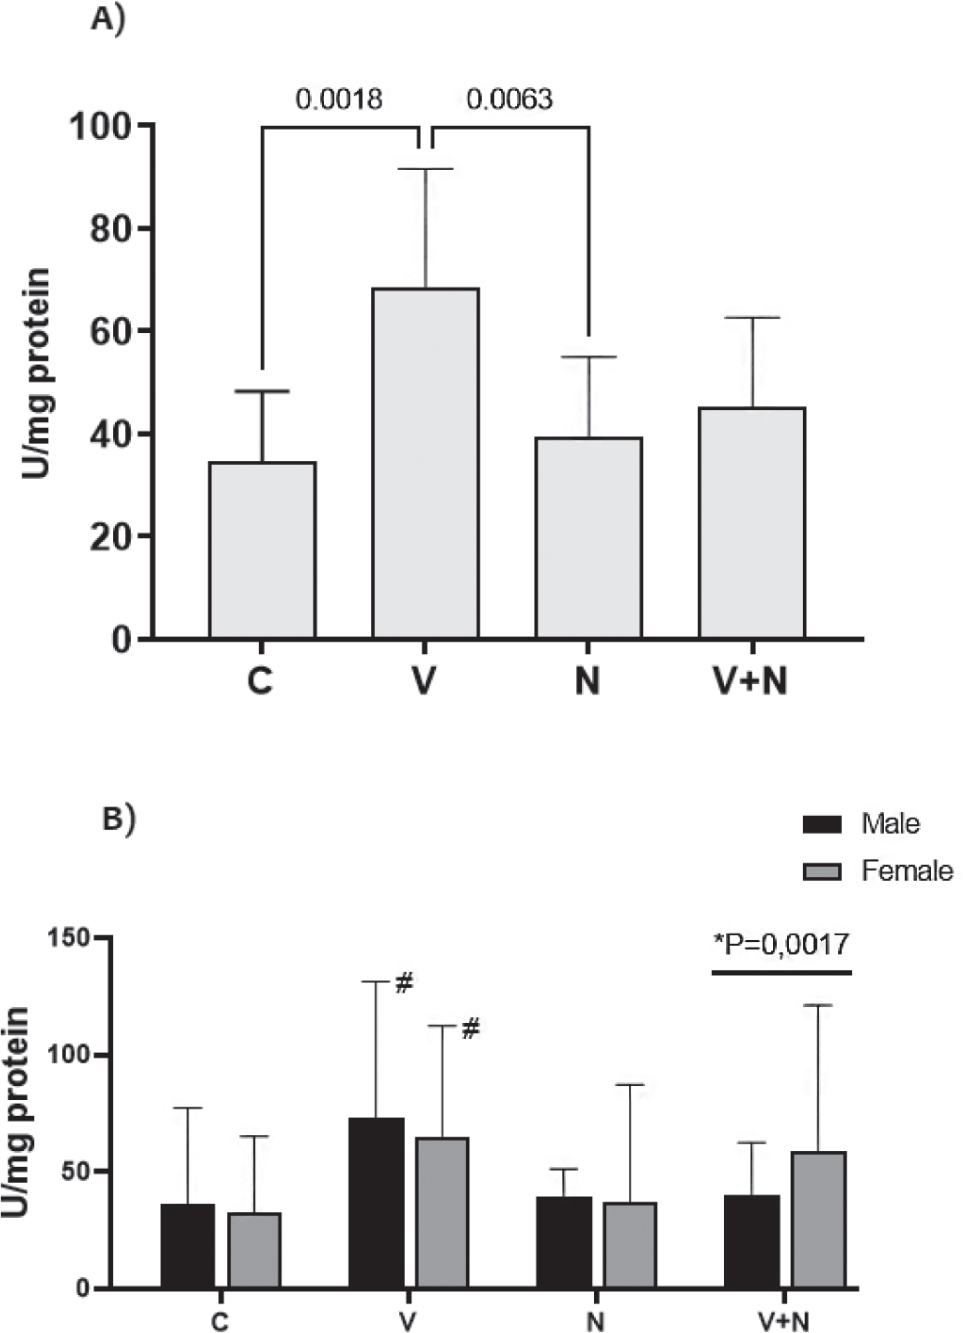
Figure 2
Kidney tissue catalase activity in mice by groups (A) and by sex and groups (B). C – control group; N – group receiving naringin (25 mg/kg); V – group receiving valproate (150 mg/kg), V+N – group receiving valproate (150 mg/kg) + naringin (25 mg/kg). Connecting lines – significant differences (p<0.05) between the groups. # significant differences (p<0.05) from control
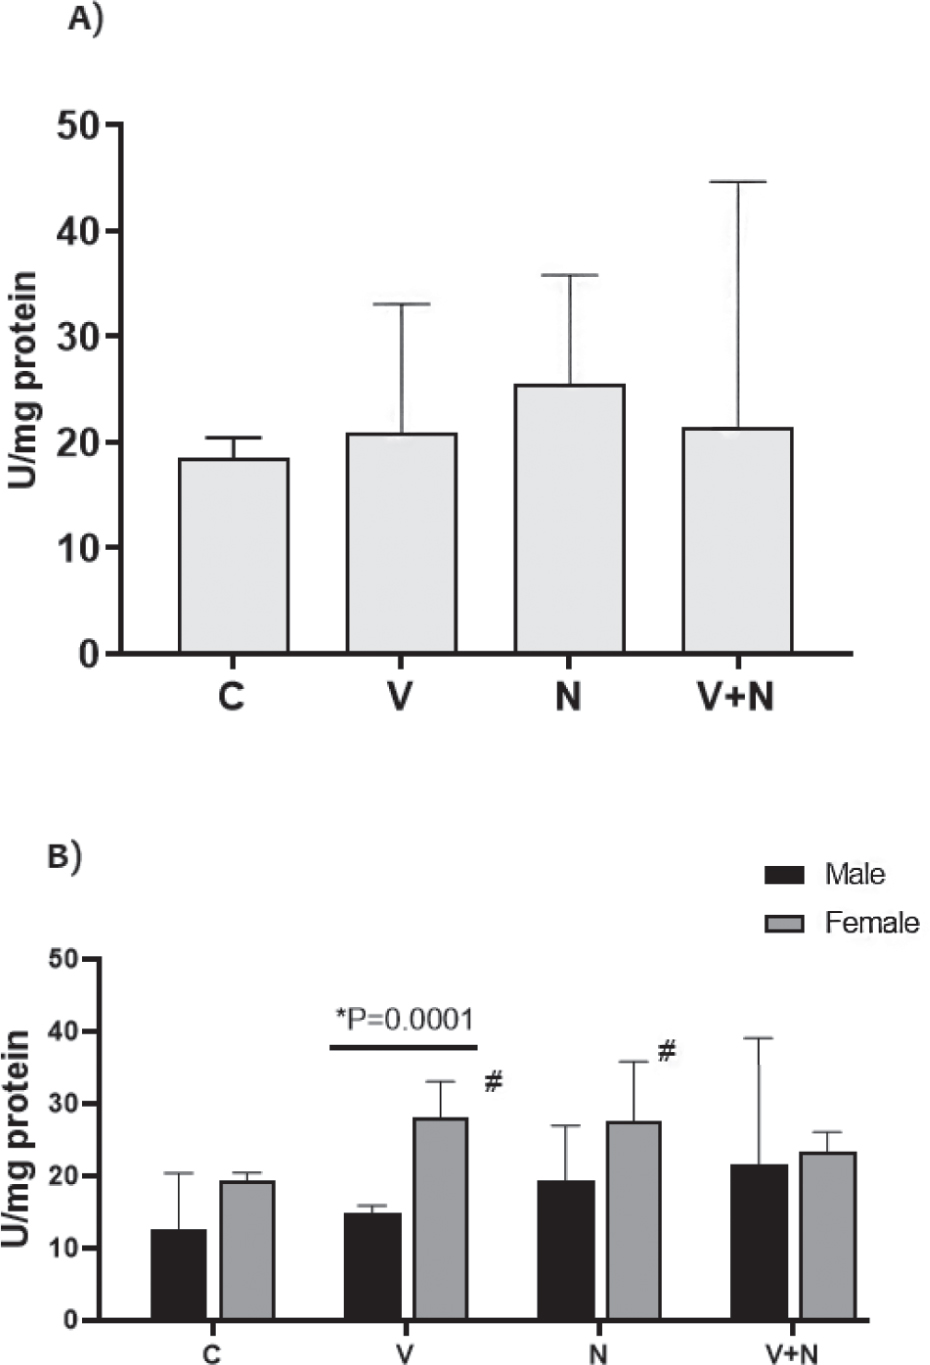
Figure 3
Kidney tissue superoxide dismutase activity levels in mice by groups (A) and by sex and groups (B). C – control group; N – group receiving naringin (25 mg/kg); V – group receiving valproate (150 mg/kg), V+N – group receiving valproate (150 mg/kg) + naringin (25 mg/kg). # significant differences (p<0.05) from control
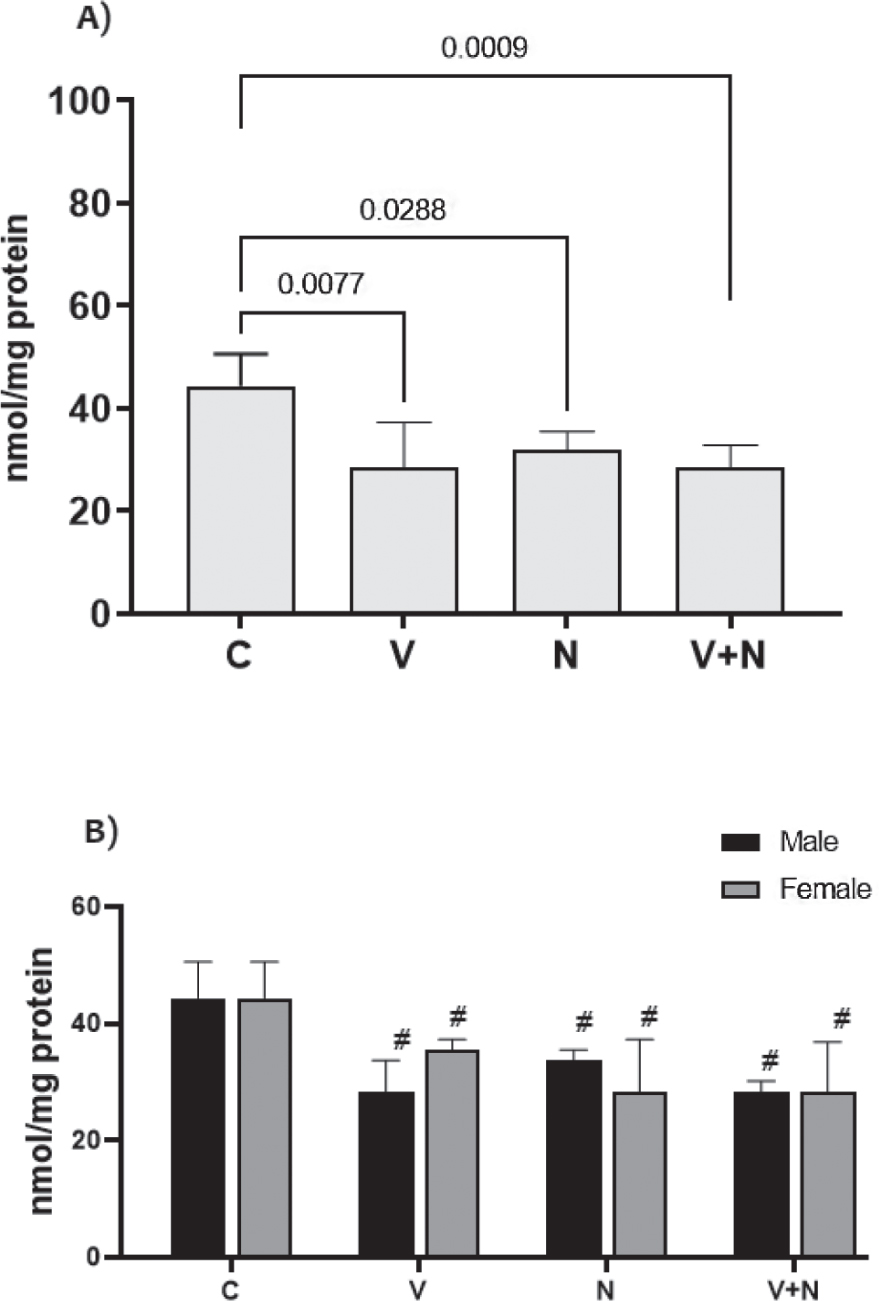
Figure 4
Kidney tissue glutathione levels in mice by groups (A) and by sex and groups (B). C – control group; N – group receiving naringin (25 mg/kg); V – group receiving valproate (150 mg/kg), V+N – group receiving valproate (150 mg/kg) + naringin (25 mg/kg). Connecting lines – significant differences (p<0.05) between the groups. # significant differences (p<0.05) from control