
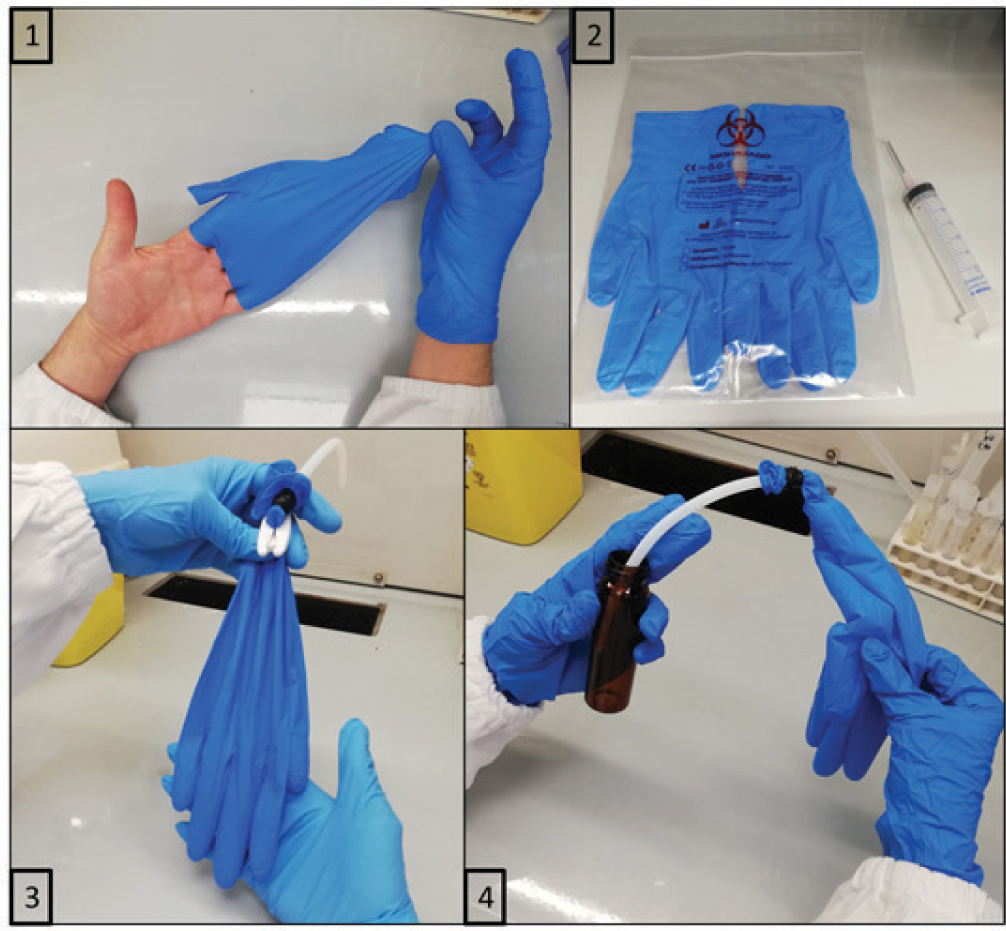
Figure 1
Nitrile glove sample collection (panels 1 & 2) and extraction procedure (panels 3 & 4)
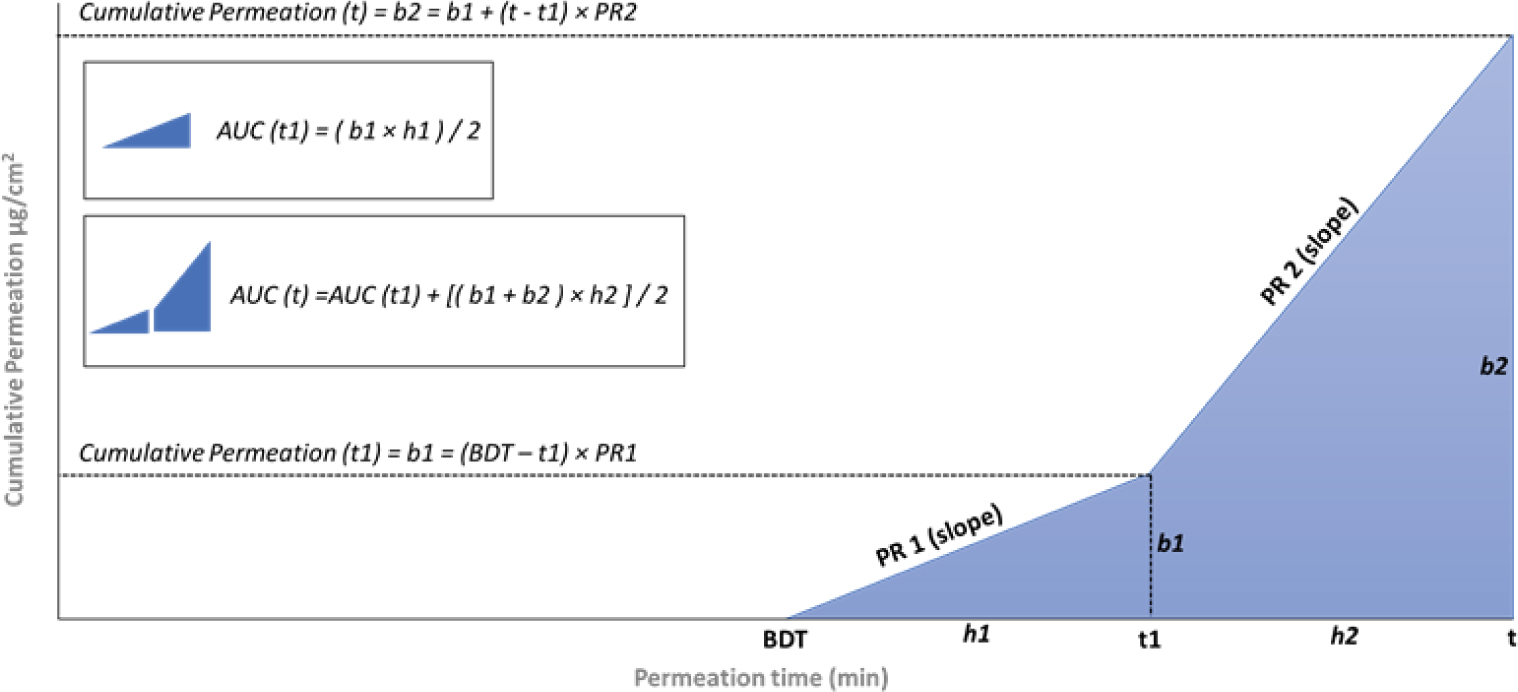
Figure 2
Calculation of the cumulative permeation and area under the curve at different time points. AUC – area under the curve; b1 – cumulative permeation (t1); b2 – cumulative permeation (t); BDT – breakthrough detection time; PR1 – permeation rate (t1); PR2 – permeation rate (t)
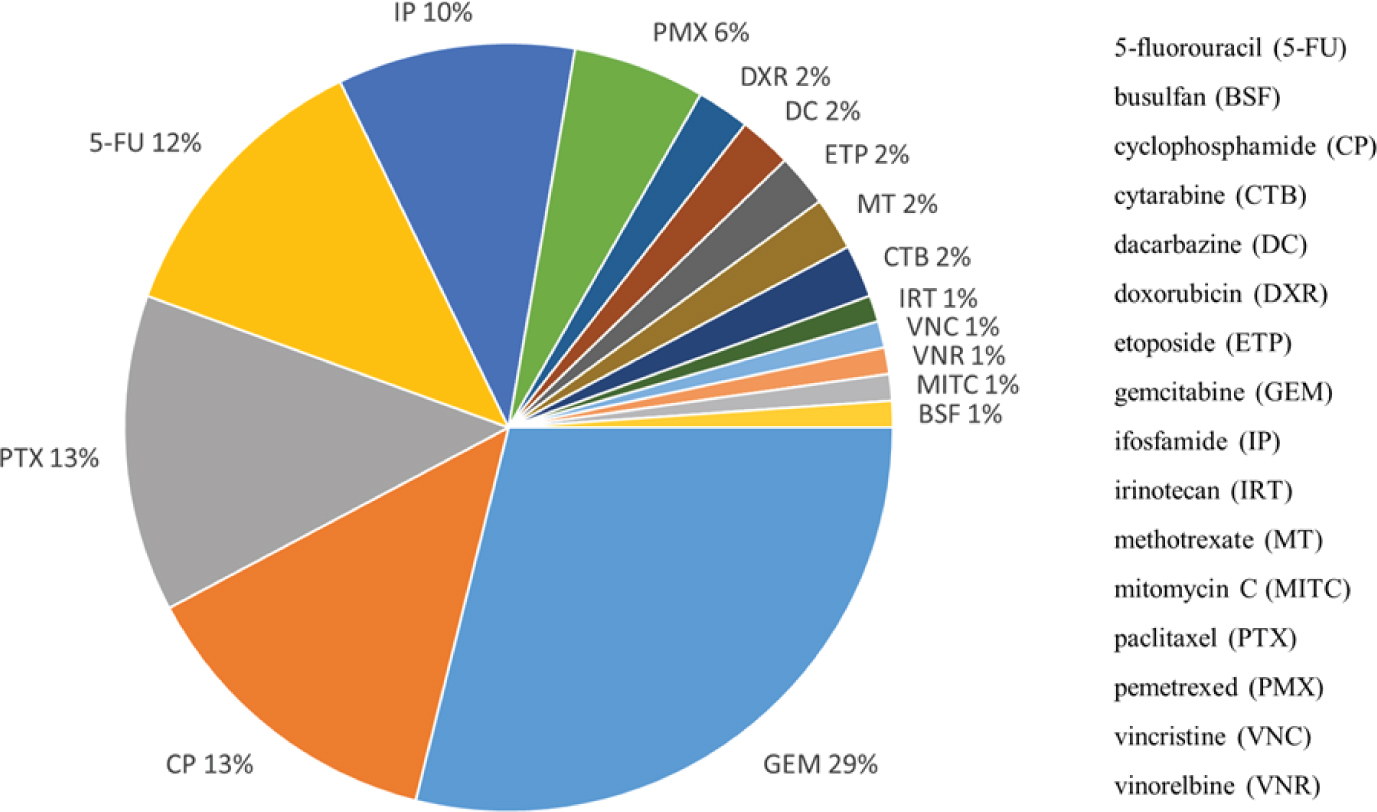
Figure 3
Prevalence of positive tests to antineoplastic drugs on collected nitrile gloves
Table 1
Glove contamination and calculated alert glove values (AGVs) in AD administration units expressed as pg/cm2
| Administration unit | |||||||
|---|---|---|---|---|---|---|---|
| Positive gloves (N) | Gloves with contamination >100 pg/cm2 (N) | Average contamination (pg/cm2) | Highest contamination (pg/cm2) | 90th percentile (pg/cm2) | AGV Adm (95th percentile) (pg/cm2) | LOQ (pg/cm2) | |
| 5-FU | 5 | 2 | 784 | 3244 | <LOQ | 3.3 | 0.15 |
| GEM | 3 | 1 | 496 | 1385 | <LOQ | <LOQ | 0.28 |
| IRT | 0 | 0 | 0 | 0 | <LOQ | <LOQ | 0.06 |
| CP | 0 | 0 | 0 | 0 | <LOQ | <LOQ | 0.03 |
| DXR | 1 | 0 | 7 | 8 | <LOQ | <LOQ | 0.12 |
| DC | 0 | 0 | 0 | 0 | <LOQ | <LOQ | 0.04 |
| EPI | 0 | 0 | 0 | 0 | <LOQ | <LOQ | 0.11 |
| ETP | 0 | 0 | 0 | 0 | <LOQ | <LOQ | 0.21 |
| MT | 1 | 0 | 5 | 5 | <LOQ | <LOQ | 0.02 |
| PTX | 0 | 0 | 0 | 0 | <LOQ | <LOQ | 0.19 |
| DTX | 0 | 0 | 0 | 0 | <LOQ | <LOQ | 2.59 |
| TMX | 0 | 0 | 0 | 0 | <LOQ | <LOQ | 0.08 |
| TPT | 0 | 0 | 0 | 0 | <LOQ | <LOQ | 0.03 |
| VNC | 0 | 0 | 0 | 0 | <LOQ | <LOQ | 0.16 |
| VNB | 0 | 0 | 0 | 0 | <LOQ | <LOQ | 0.44 |
| VNR | 1 | 0 | 16 | 16 | <LOQ | <LOQ | 0.06 |
| FTM | 0 | 0 | 0 | 0 | <LOQ | <LOQ | 0.04 |
| MITC | 1 | 0 | 2 | 2 | <LOQ | <LOQ | 0.02 |
| IDC | 0 | 0 | 0 | 0 | <LOQ | <LOQ | 0.62 |
| IP | 4 | 0 | 23 | 52 | <LOQ | <LOQ | 0.04 |
| CTB | 0 | 0 | 0 | 0 | <LOQ | <LOQ | 0.06 |
| MP | 0 | 0 | 0 | 0 | <LOQ | <LOQ | 0.18 |
| BSF | 0 | 0 | 0 | 0 | <LOQ | <LOQ | 0.09 |
| PMX | 0 | 0 | 0 | 0 | <LOQ | <LOQ | 0.09 |
| RTX | 0 | 0 | 0 | 0 | <LOQ | <LOQ | 0.08 |
| VND | 0 | 0 | 0 | 0 | <LOQ | <LOQ | 5.71 |
| 5-AZ | 0 | 0 | 0 | 0 | <LOQ | <LOQ | 0.70 |
| CisPt | 0 | 0 | 0 | 0 | <LOQ | <LOQ | 29.58 |
| CarboPt | 0 | 0 | 0 | 0 | <LOQ | <LOQ | 2.73 |
| OxaliPt | 0 | 0 | 0 | 0 | <LOQ | <LOQ | 0.35 |
1 LOQ – instrumental limits of quantification for each substance. 5-FU – 5-fluorouracil; BSF – busulfan; CP – cyclophosphamide; CarboPt – carboplatin; CisPt – cisplatin; OxaliPt – oxaliplatin; CTB – cytarabine; DC – dacarbazine; DNR – daunorubicin; DTX – docetaxel; DXR – doxorubicin; EPI – epirubicin; ETP – etoposide; GEM – gemcitabine; FTM – fotemustine; IDC – idarubicine; IP – iphosfamide; IRT – irinotecan; MP – melphalan; MT – methotrexate; MITC – mitomycin C; PTX – paclitaxel; PMX – pemetrexed; TMX – tamoxifen; RTX – raltitrexed; TPT – topotecan; VNB – vinblastine; VNC – vincristine; VND – vindesine; VNR – vinorelbine
Table 2
Glove contamination and calculated alert glove values (AGVs) in AD preparation units expressed as pg/cm2
| Preparation unit | |||||||
|---|---|---|---|---|---|---|---|
| Positive gloves (N) | Gloves with contamination >100 pg/cm2 (N) | Average contamination (pg/cm2) | Highest contamination (pg/cm2) | 90th percentile (pg/cm2) | AGVPrep (95th percentile) (pg/cm2) | LOQ (pg/cm2) | |
| 5-FU | 6 | 3 | 3667 | 20729 | <LOQ | 13.6 | 0.15 |
| GEM | 23 | 10 | 1292 | 12767 | 163.6 | 1985.2 | 0.28 |
| IRT | 1 | 0 | 36 | 36 | <LOQ | <LOQ | 0.06 |
| CP | 12 | 3 | 319 | 2934 | 13.8 | 40.6 | 0.03 |
| DXR | 1 | 0 | 39 | 39 | <LOQ | <LOQ | 0.12 |
| DC | 2 | 0 | 7 | 7 | <LOQ | <LOQ | 0.04 |
| EPI | 0 | 0 | 0 | 0 | <LOQ | <LOQ | 0.11 |
| ETP | 2 | 0 | 35 | 56 | <LOQ | <LOQ | 0.21 |
| MT | 1 | 0 | 50 | 50 | <LOQ | <LOQ | 0.02 |
| PTX | 12 | 5 | 170 | 487 | 34 | 97.8 | 0.19 |
| DTX | 0 | 0 | 0 | 0 | <LOQ | <LOQ | 2.59 |
| TMX | 0 | 0 | 0 | 0 | <LOQ | <LOQ | 0.08 |
| TPT | 0 | 0 | 0 | 0 | <LOQ | <LOQ | 0.03 |
| VNC | 1 | 0 | 46 | 46 | <LOQ | <LOQ | 0.16 |
| VNB | 0 | 0 | 0 | 0 | <LOQ | <LOQ | 0.44 |
| VNR | 0 | 0 | 0 | 0 | <LOQ | <LOQ | 0.06 |
| FTM | 0 | 0 | 0 | 0 | <LOQ | <LOQ | 0.04 |
| MITC | 0 | 0 | 0 | 0 | <LOQ | <LOQ | 0.02 |
| IDC | 0 | 0 | 0 | 0 | <LOQ | <LOQ | 0.62 |
| IP | 5 | 1 | 84 | 395 | <LOQ | 0.6 | 0.04 |
| CTB | 2 | 1 | 2602 | 5190 | <LOQ | <LOQ | 0.06 |
| MP | 0 | 0 | 0 | 0 | <LOQ | <LOQ | 0.18 |
| BSF | 1 | 0 | 18 | 18 | <LOQ | <LOQ | 0.09 |
| PMX | 5 | 4 | 421 | 1175 | <LOQ | 19.3 | 0.09 |
| RTX | 0 | 0 | 0 | 0 | <LOQ | <LOQ | 0.08 |
| VND | 0 | 0 | 0 | 0 | <LOQ | <LOQ | 5.71 |
| 5-AZ | 0 | 0 | 0 | 0 | <LOQ | <LOQ | 0.70 |
| CisPt | 0 | 0 | 0 | 0 | <LOQ | <LOQ | 29.58 |
| CarboPt | 6 | 1 | 0 | 414 | <LOQ | 11.2 | 2.73 |
| OxaliPt | 0 | 0 | 0 | 0 | <LOQ | <LOQ | 0.35 |
1 LOQ – instrumental limits of quantification for each substance. 5-FU – 5-fluorouracil; BSF – busulfan; CP – cyclophosphamide; CarboPt – carboplatin; CisPt – cisplatin; OxaliPt – oxaliplatin; CTB – cytarabine; DC – dacarbazine; DNR – daunorubicin; DTX – docetaxel; DXR – doxorubicin; EPI – epirubicin; ETP – etoposide; GEM – gemcitabine; FTM – fotemustine; IDC – idarubicine; IP – iphosfamide; IRT – irinotecan; MP – melphalan; MT – methotrexate; MITC – mitomycin C; PTX – paclitaxel; PMX – pemetrexed; TMX – tamoxifen; RTX – raltitrexed; TPT – topotecan; VNB – vinblastine; VNC – vincristine; VND – vindesine; VNR – vinorelbine
Table 3
Cumulative AD contamination and total alert glove values (AGV-T) for administration and preparation units
| Administration (pg/cm2) | Preparation (pg/cm2) | |
|---|---|---|
| Positive gloves (N) | 15 | 44 |
| Average cumulative contamination (pg/cm2) | 369 | 1503 |
| Highest cumulative contamination (pg/cm2) | 3279 | 33518 |
| Cumulative 70th percentile (pg/cm2) | <LOQ | 150 |
| AGV-T (95th percentile) (pg/cm2) | 123 | 3422 |
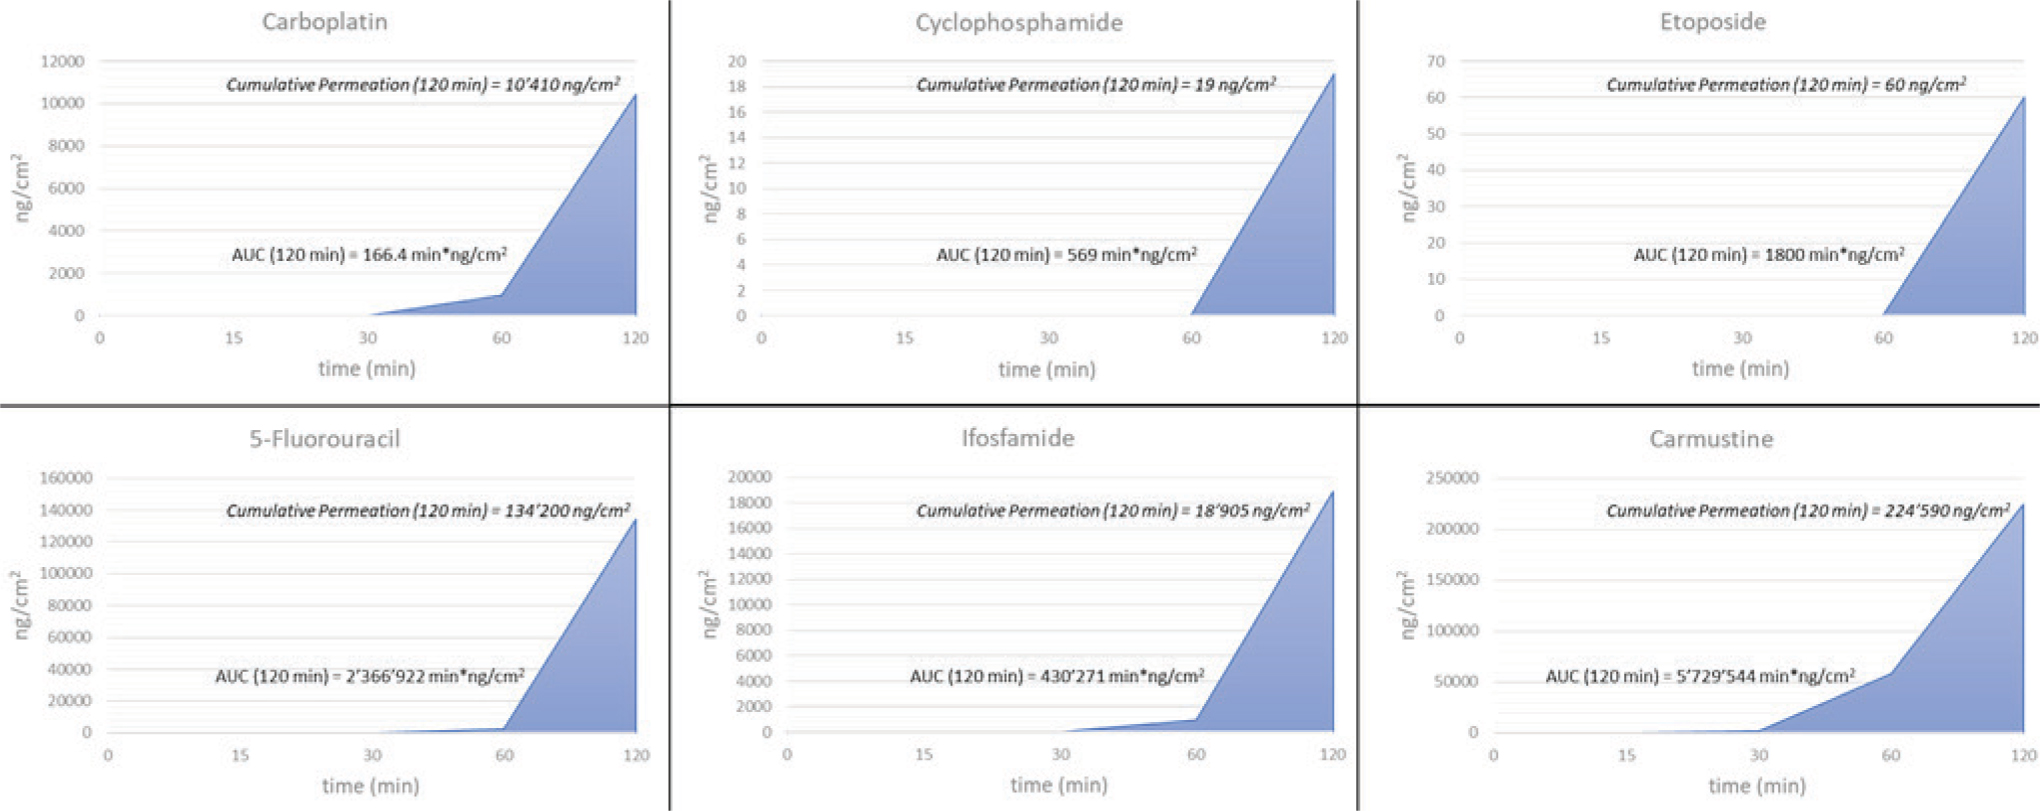
Figure 4
Calculated cumulative permeation and area under the curve (AUC) for carboplatin, cyclophosphamide, etoposide, 5-fluorouracil, iphosphamide, and carmustine after 120 min of exposure (assuming 0.05 mm glove thickness)
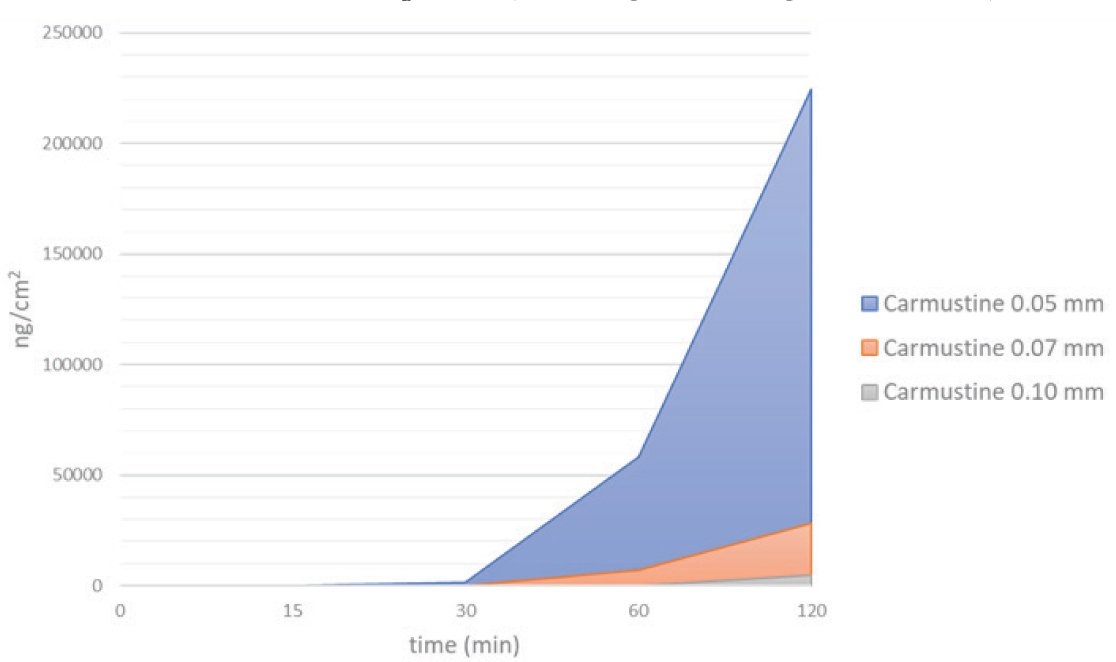
Figure 5
Comparison of carmustine permeation curves between nitrile gloves of different thickness