
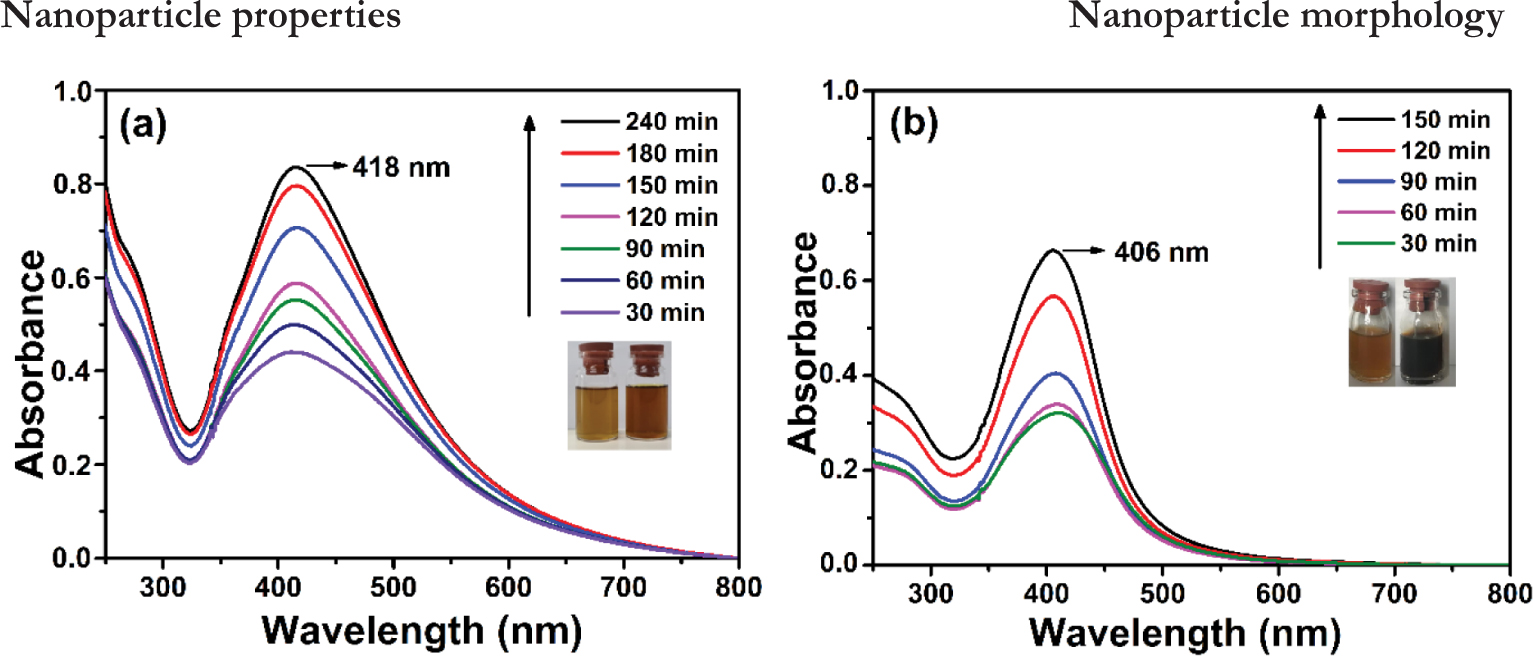
Figure 1
UV–Vis absorption spectra of a) G-AgNPs and b) H-AgNPs with different incubation times (0–240 min)
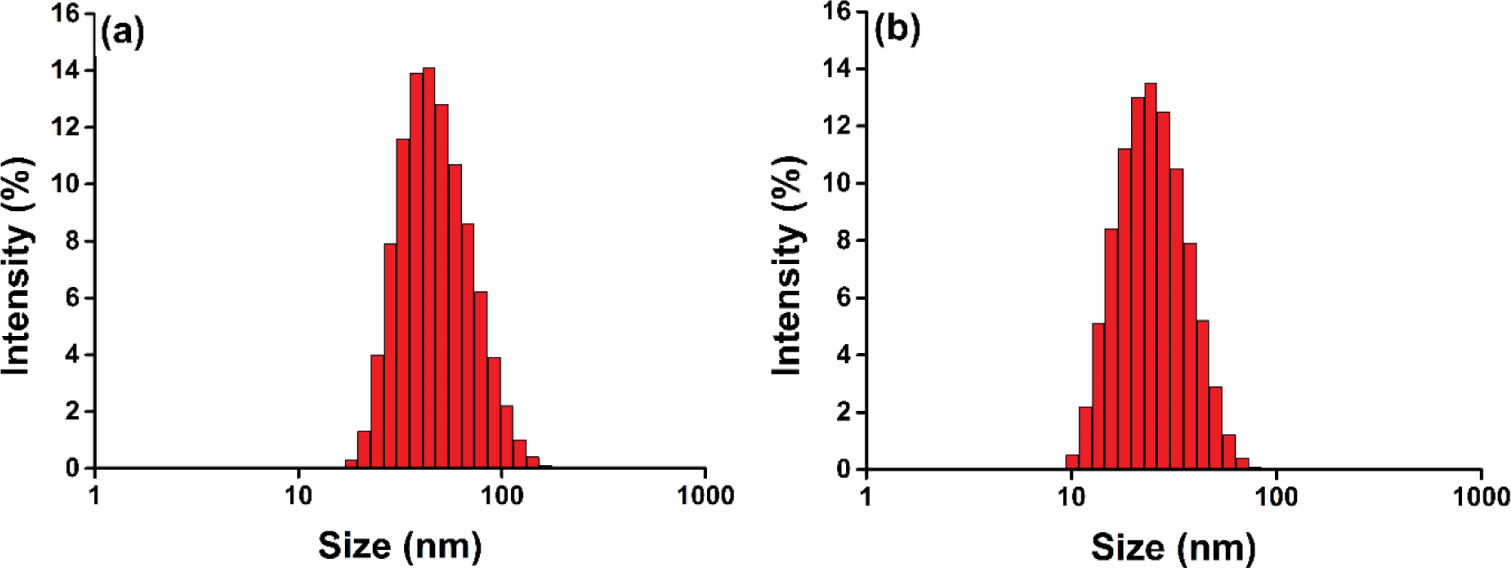
Figure 2
Particle size distribution of a) G-AgNPs and b) H-AgNPs
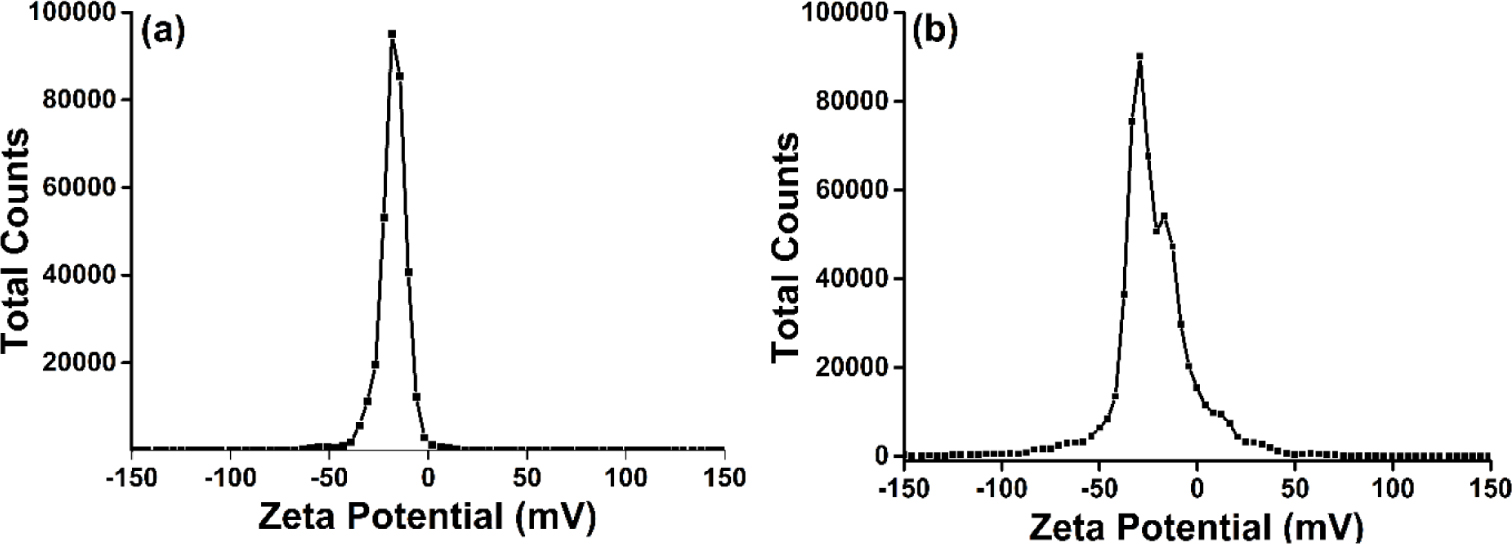
Figure 3
Zeta potential of a) G-AgNPs and b) H-AgNPs
Table 1
Physicochemical properties of H-AgNPs and G-AgNPs
| NPs | Particle Size (nm) | Zeta Potential (mV) | Polydispersity Index |
|---|---|---|---|
| H-AgNP | 23.9±1.0 | −21.3±2.7 | 0.285±0.034 |
| G-AgNP | 52.0±10.9 | −17.9±0.9 | 0.280±0.032 |
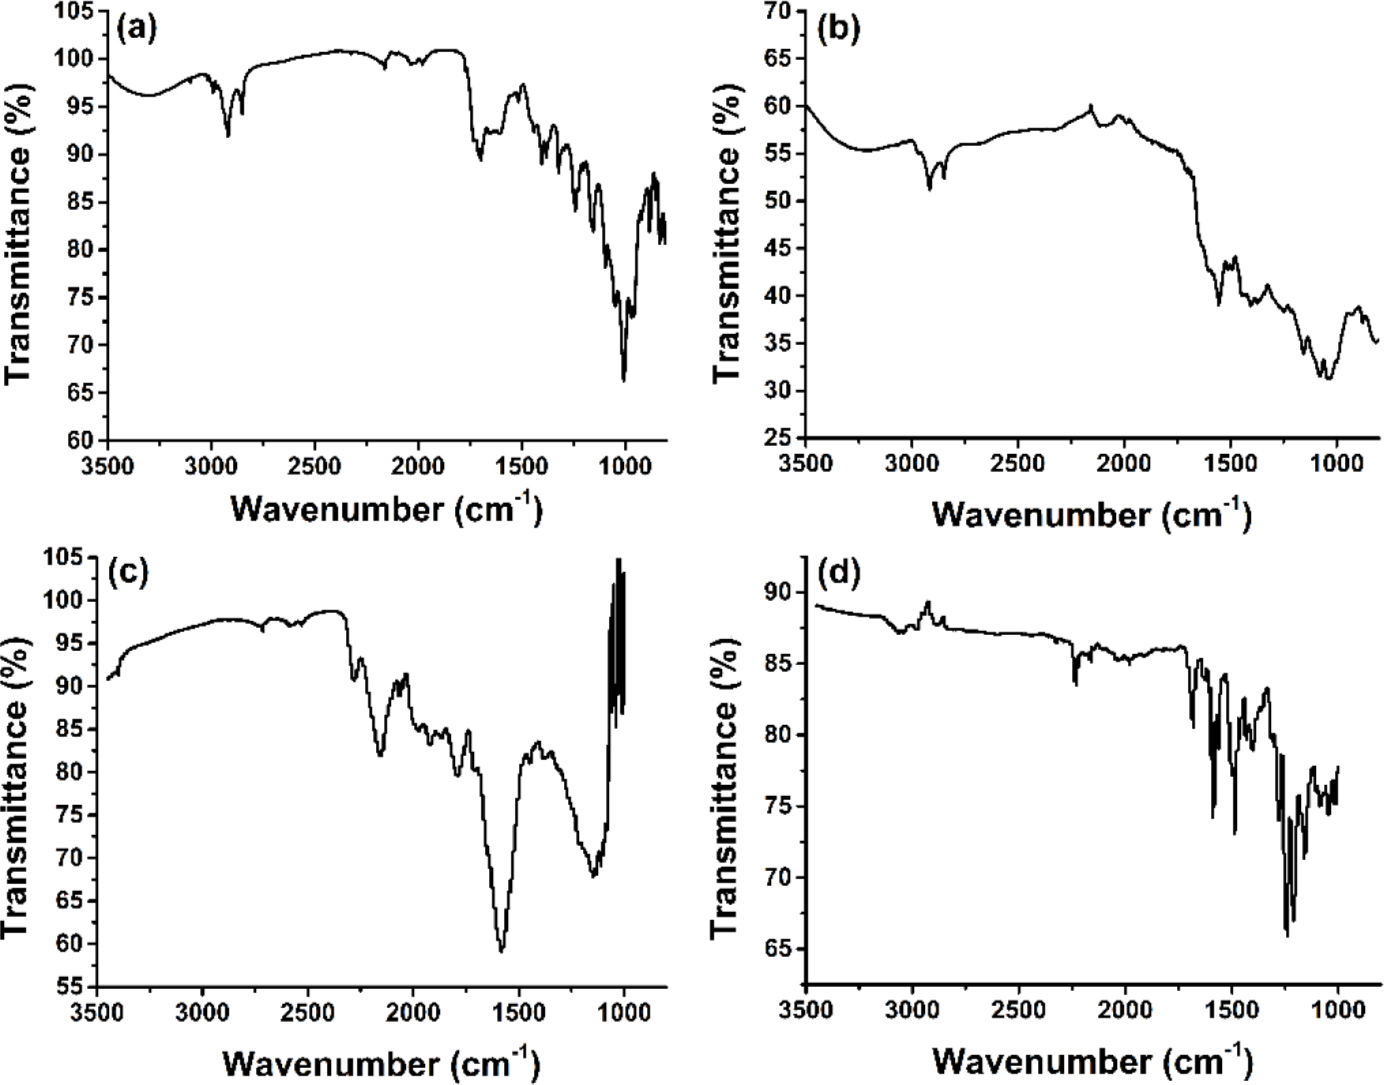
Figure 4
FT-IR spectrum of a) G. aparine, b) G-AgNPs, c) H. arenarium, and d) H-AgNPs
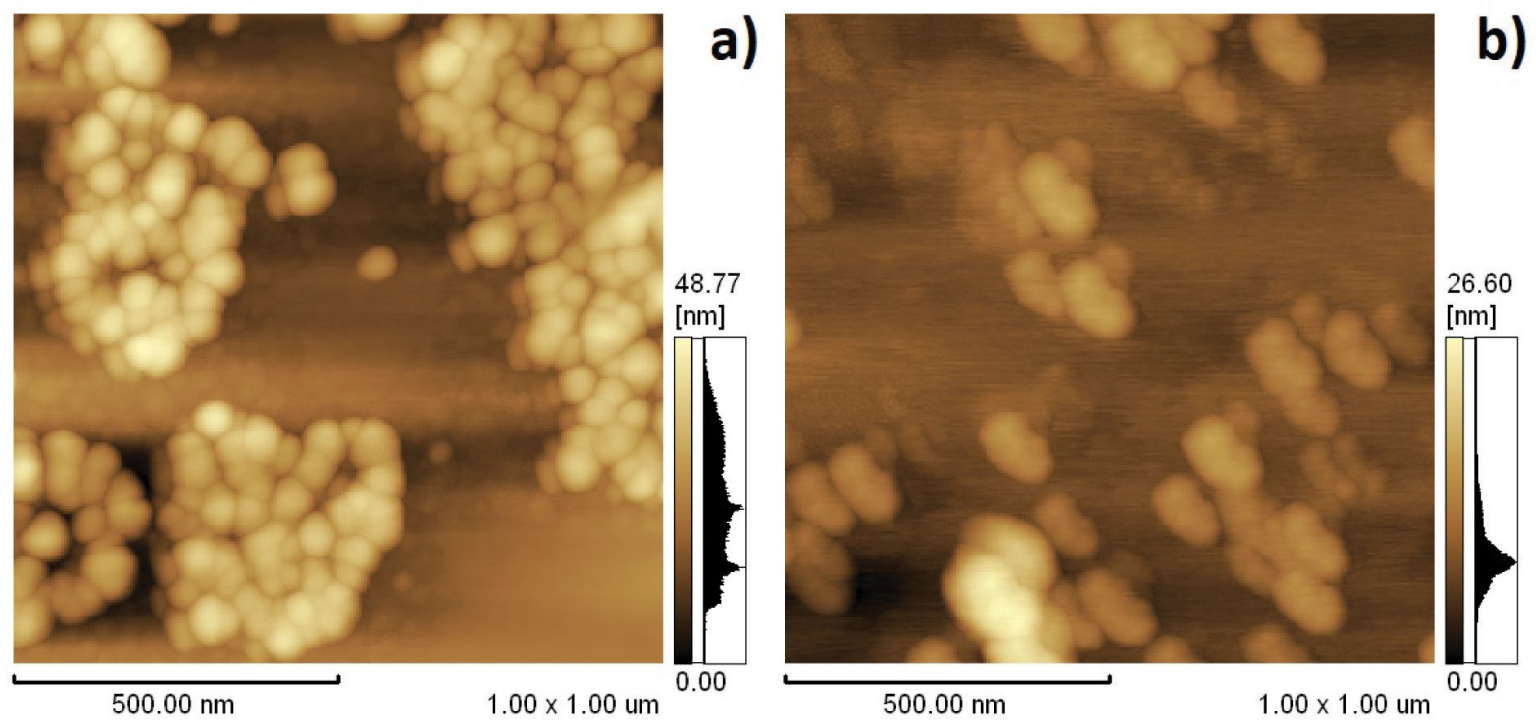
Figure 5
2-D Atomic force microscope images of a) G-AgNPs and b) H-AgNPs. Scan scale: 1×1 µm
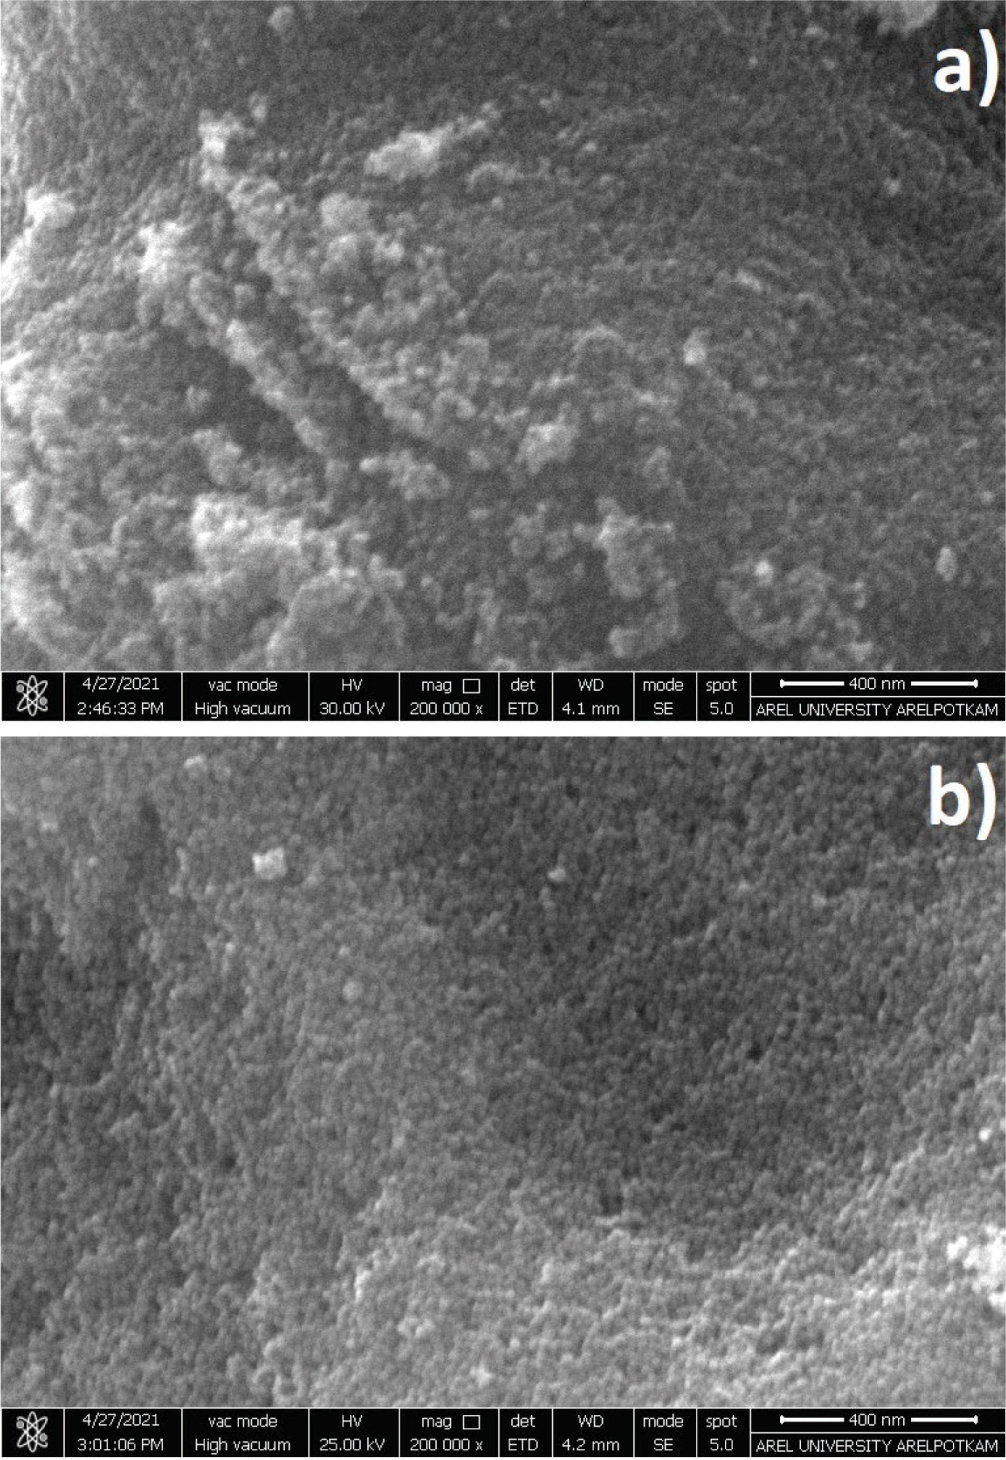
Figure 6
Scanning electron microscope images of a) G-AgNPs and b) H-AgNPs at 200,000× magnification
Table 2
MBC/MFC and MIC values of samples according to the broth microdilution method
| Test sample | AgNP concentrations used in nanoformulations (μg/mL) | MIC μ/mL) by microorganisms | MBC/MFC μ/mL) by microorganisms | ||||||
|---|---|---|---|---|---|---|---|---|---|
| E. coli | S. aureus | A. flavus | C. albicans | E. coli | S. aureus | A. flavus | C. albicans | ||
| G-AgNPs | 62.5 | − | − | 2000 | 125 | − | − | − | |
| H-AgNPs | − | 125 | 500 | − | − | − | − | − | |
| NF-1 | 1000 G-AgNP + 1000 H-AgNP | 31.25* | 125 | 500 | − | 125 | 250 | − | − |
| NF-2 | 500 G-AgNP + 1500 H-AgNP | 31.25* | 62.5 | 500 | − | 125 | 125 | − | − |
| NF-3 | 1500 G-AgNP + 500 H-AgNP | 31.25* | 62.5 | 500 | − | 125 | 125 | − | − |
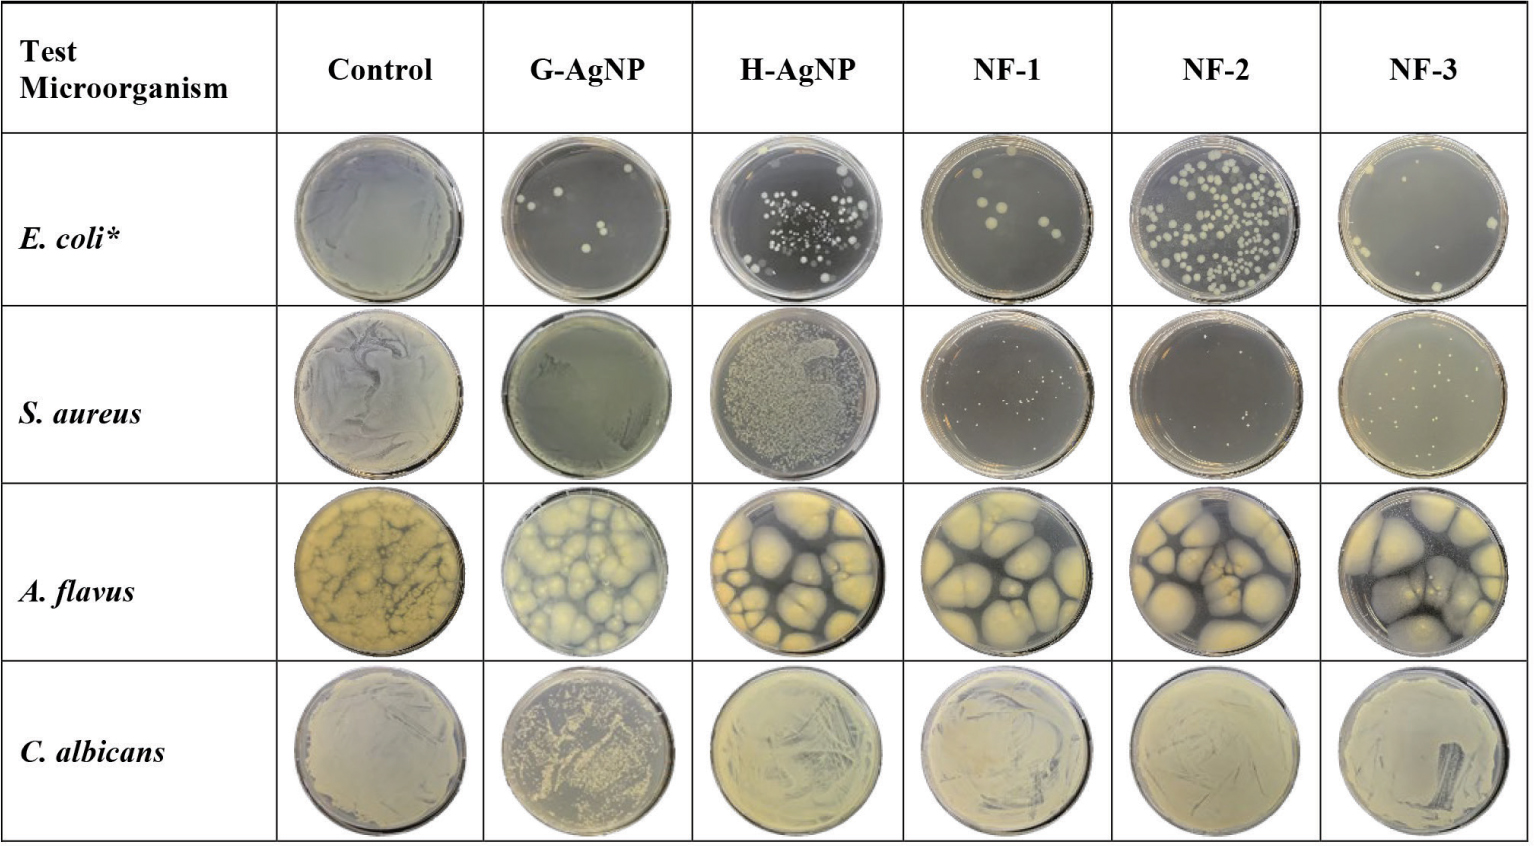
Table 3
Petri dish images obtained by standard plate counting related to respective MICs. The dilution coefficient for E. coli is 102. There is no dilution for other microorganism. MIC – minimum inhibitory concentration