
Figure 1
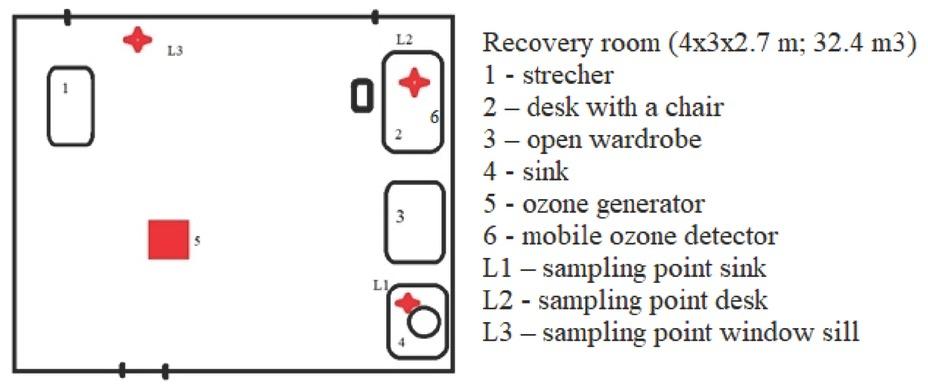
Figure 2
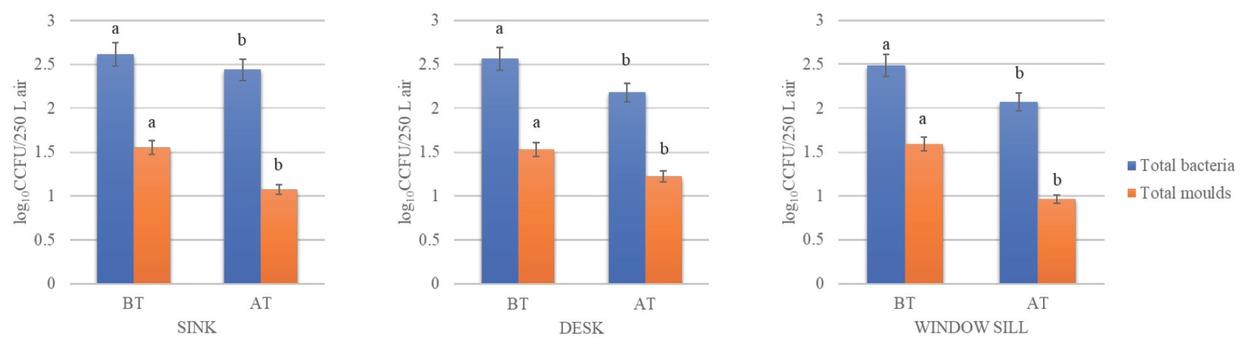
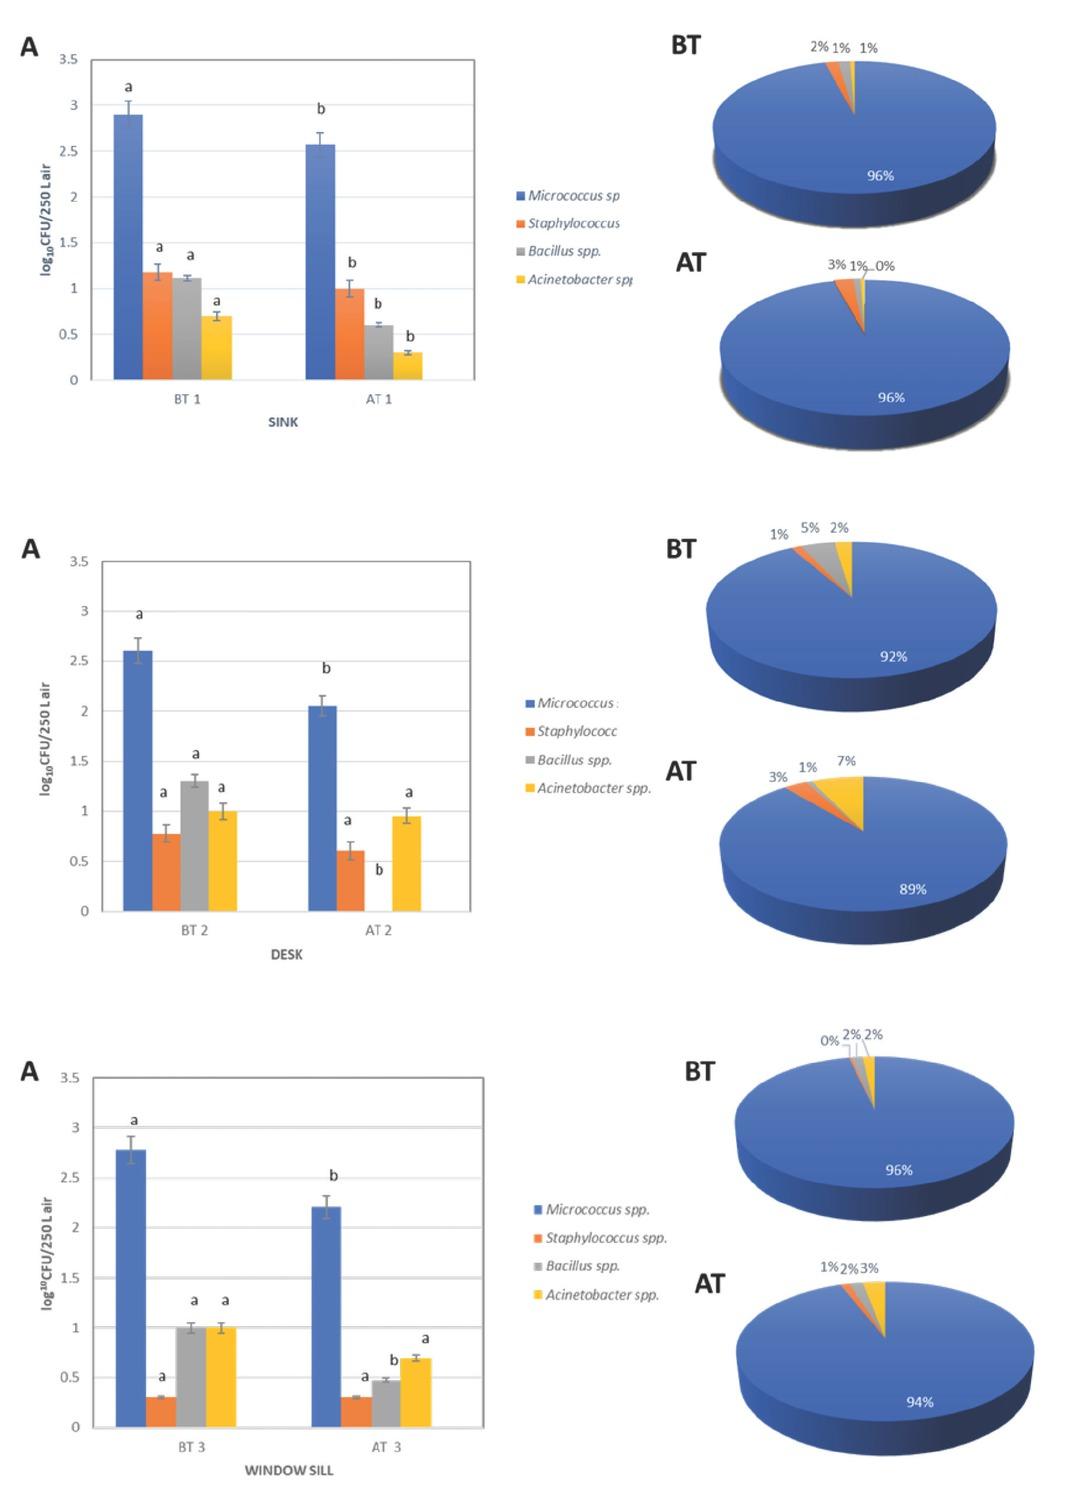
Figure 3
Inhibition rates of total bacteria counts at the three sampling points
| Sampling point | Before treatment ozone | After treatment ozone | Inhibition (%) | ||
|---|---|---|---|---|---|
| r | Pr | r | Pr | ||
| L1 – sink | 413 | 2986 | 276 | 467 | 33 |
| L2 – desk | 367 | 992 | 151 | 189 | 58 |
| L3 – window sill | 309 | 591 | 118 | 140 | 61 |
Inhibition rates by identified bacteria at the three sampling points_
| Bacteria by identified genera | Sink | Desk | Window sill | ||||||||||||
|---|---|---|---|---|---|---|---|---|---|---|---|---|---|---|---|
| Before ozone treatment | After ozone treatment | Inhibition (%) | Before ozone treatment | After ozone treatment | Inhibition (%) | Before ozone treatment | After ozone treatment | Inhibition (%) | |||||||
| r | Pr | r | Pr | r | Pr | r | Pr | r | Pr | r | Pr | ||||
| Micrococcus spp. | 380 | 1189 | 260 | 419 | 31 | 345 | 791 | 141 | 174 | 59 | 275 | 464 | 105 | 122 | 61 |
| Staphylococcus spp. | 15 | 15 | 10 | 10 | 33 | 2 | 2 | 2 | 2 | 0 | 4 | 4 | 4 | 4 | 0 |
| Bacillus spp. | 13 | 13 | 4 | 4 | 69 | 10 | 10 | 3 | 3 | 70 | 20 | 20 | 0 | 0 | 100 |
| Acinetobacter spp. | 5 | 5 | 2 | 2 | 60 | 10 | 10 | 5 | 5 | 50 | 10 | 10 | 9 | 9 | 10 |