
Figure 1
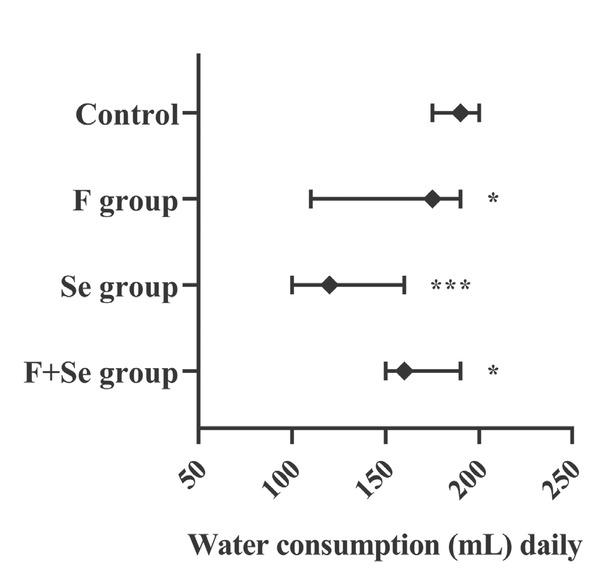
Figure 2
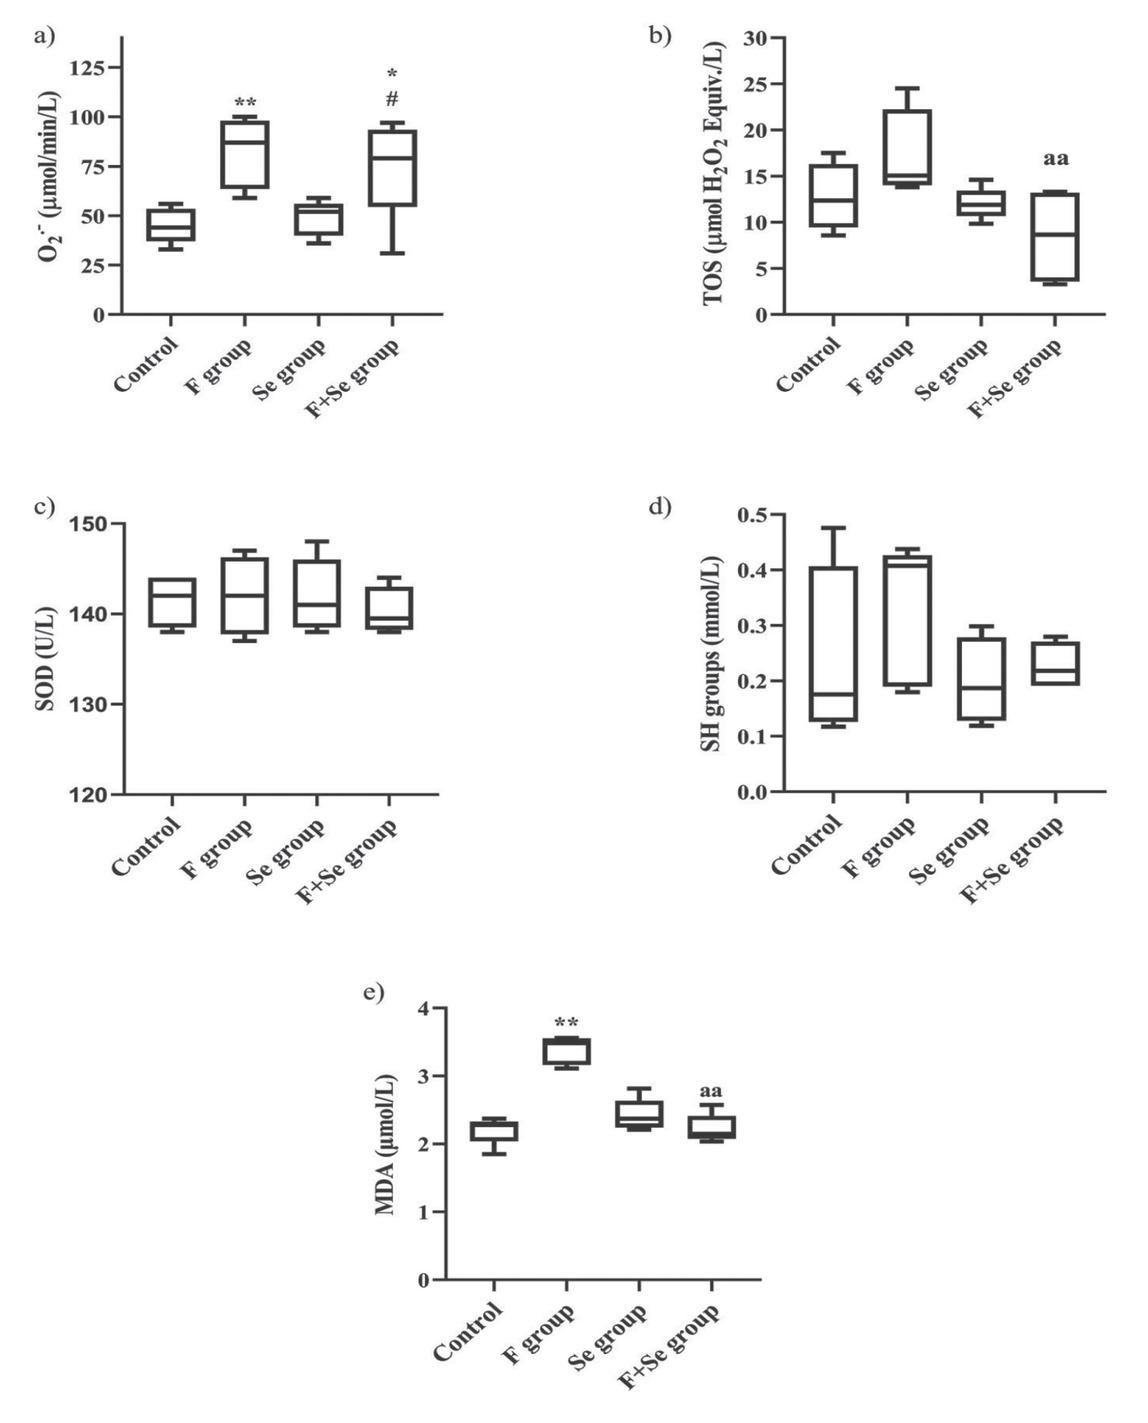
Figure 3
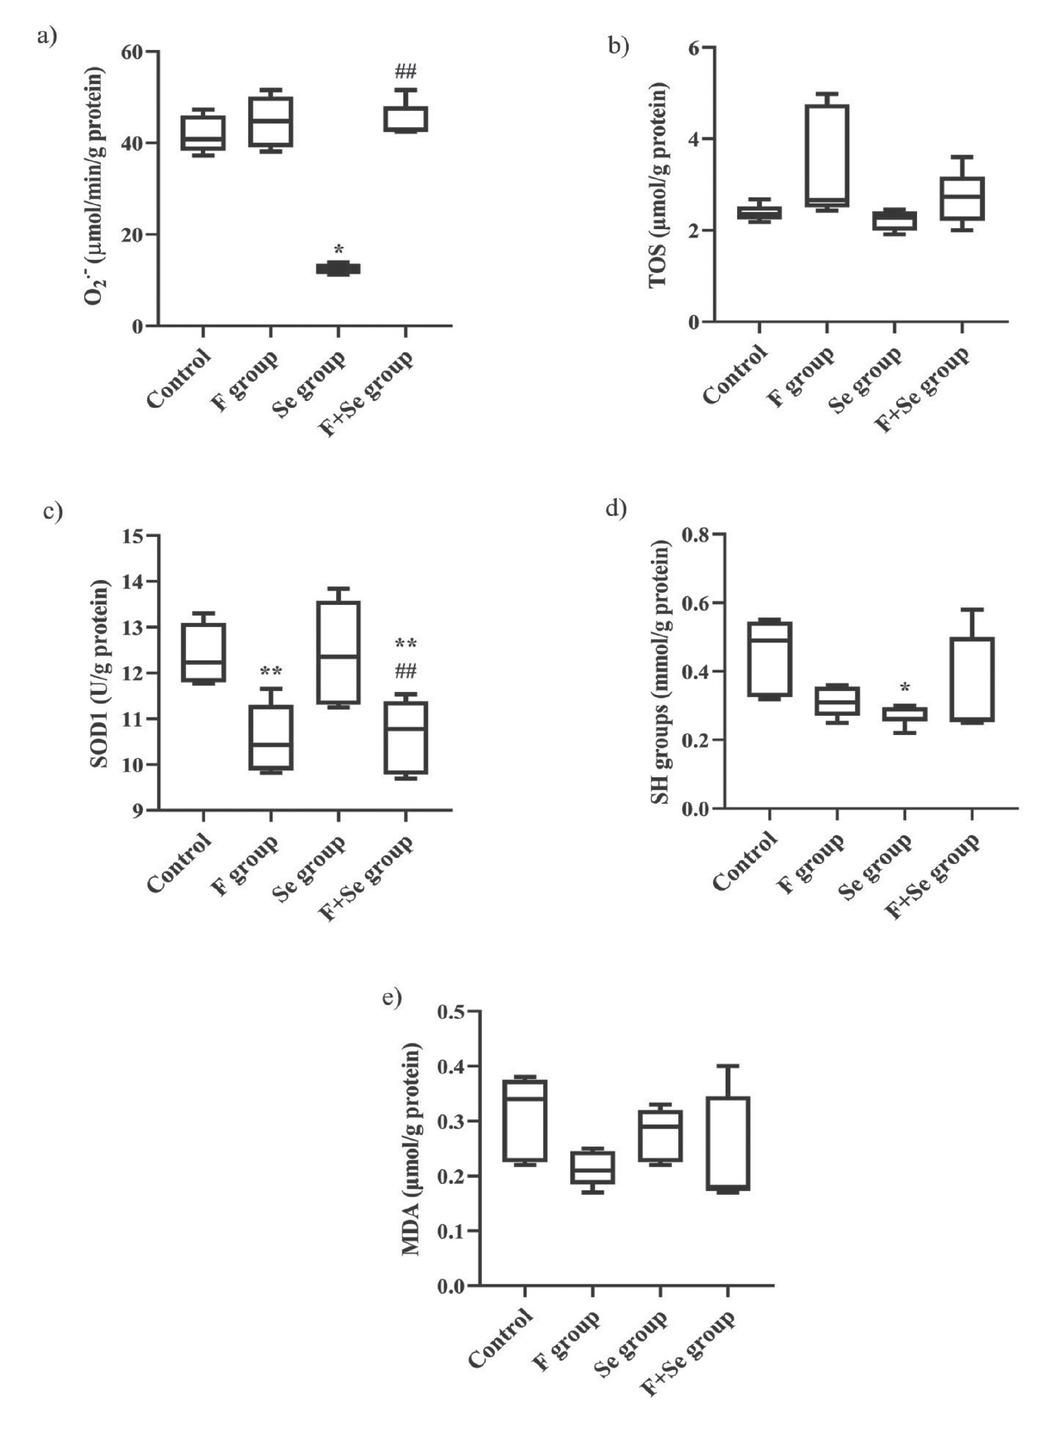
Figure 4
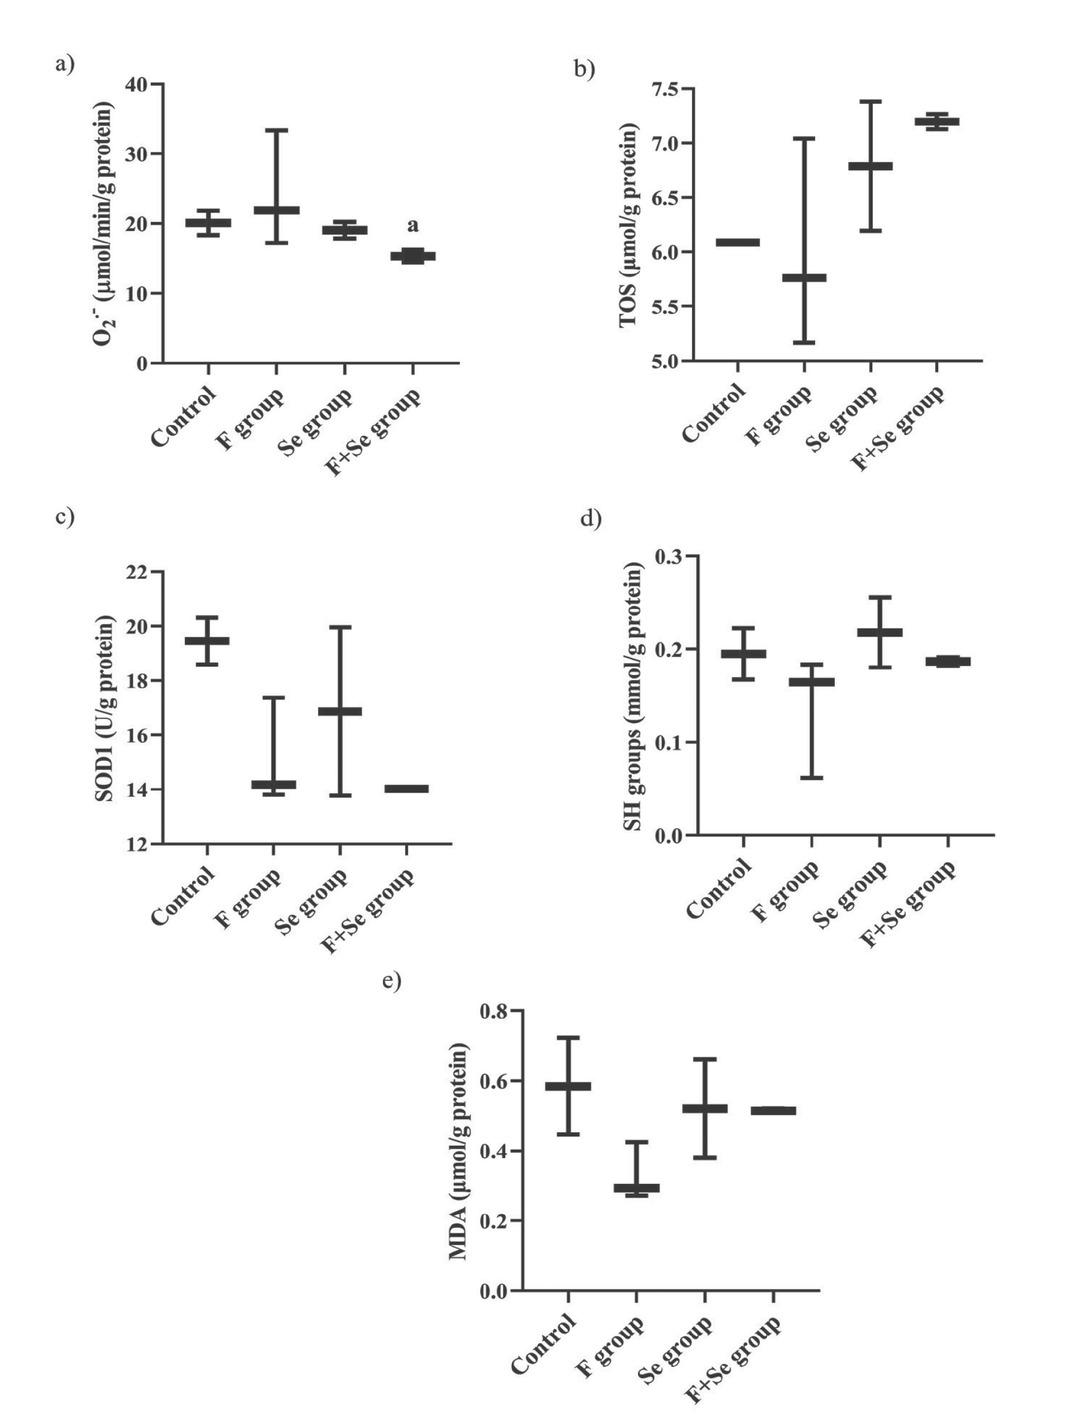
Figure 5
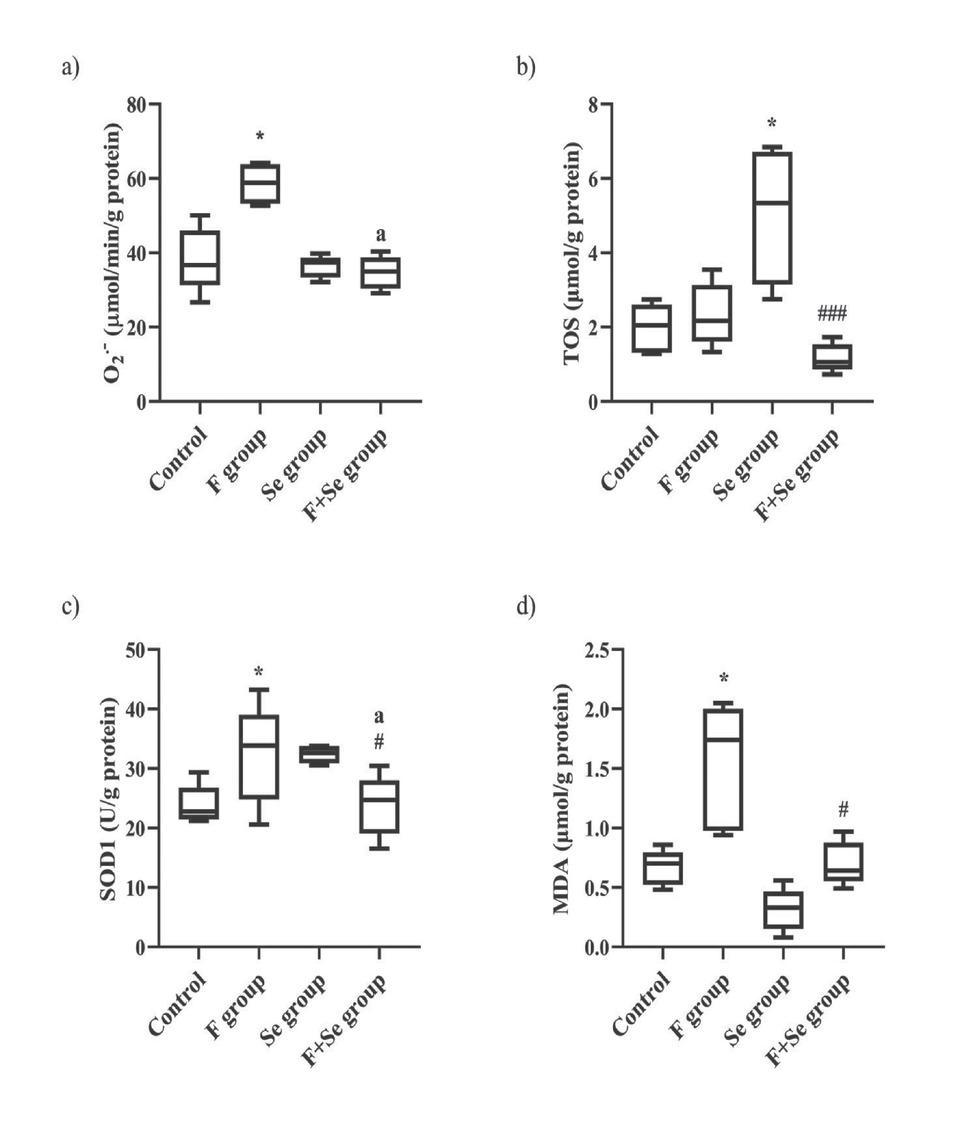
Figure 6
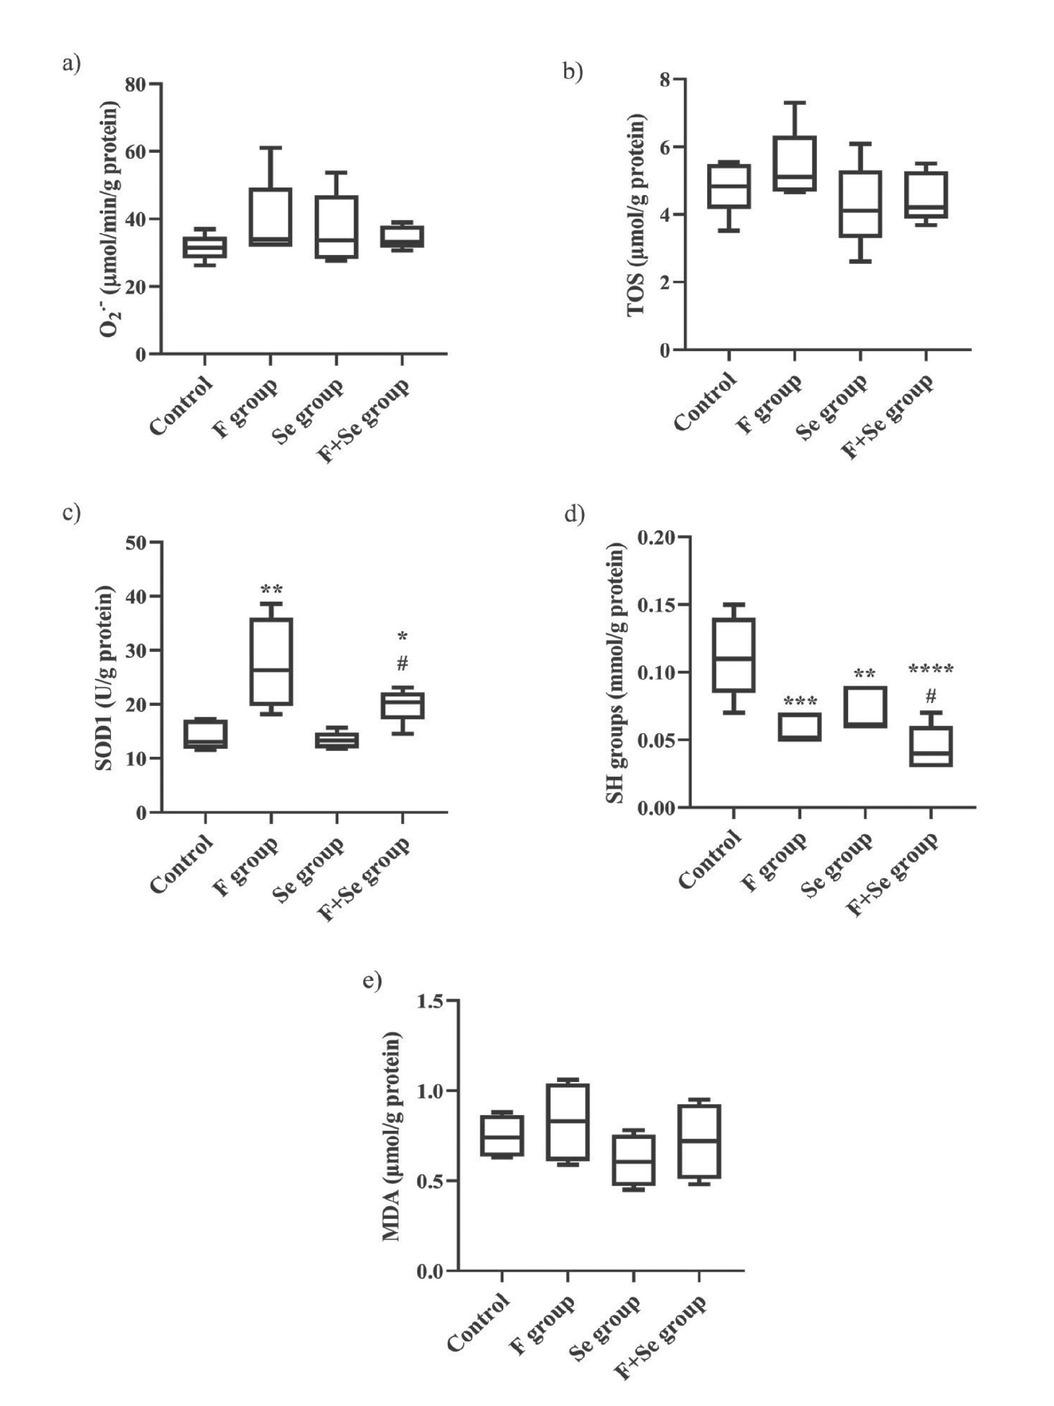
Figure 7
Mean body weight gain in Wistar rats exposed to fluoride and/or selenium through drinking water for 28 days
| Group | Parameter | Day 7 | Day 14 | Day 21 | Day 28 |
|---|---|---|---|---|---|
| Control | BWG | 0.27±0.03 | 0.68±0.05 | 1.00±0.08 | 0.95±0.11 |
| F group | BWG | 0.17±0.04*** | 0.59±0.04 | 0.92±0.08 | 0.90±0.08 |
| % to control | -37.11 % | -12.27 % | -8.61 % | -5.16 % | |
| Se group | BWG | 0.27±0.04 | 0.47±0.07*** | 0.83±0.08* | 1.1±0.12 |
| % to control | 0.35 % | -30.84 % | -17.39 % | 14.92 % | |
| F+Se group | BWG | 0.19±0.03** ## | 0.57±0.11* # | 0.82±0.14** | 0.88±0.16### |
| % to control | -26.35 % | -15.75 % | -18.18 % | -18.43 % |
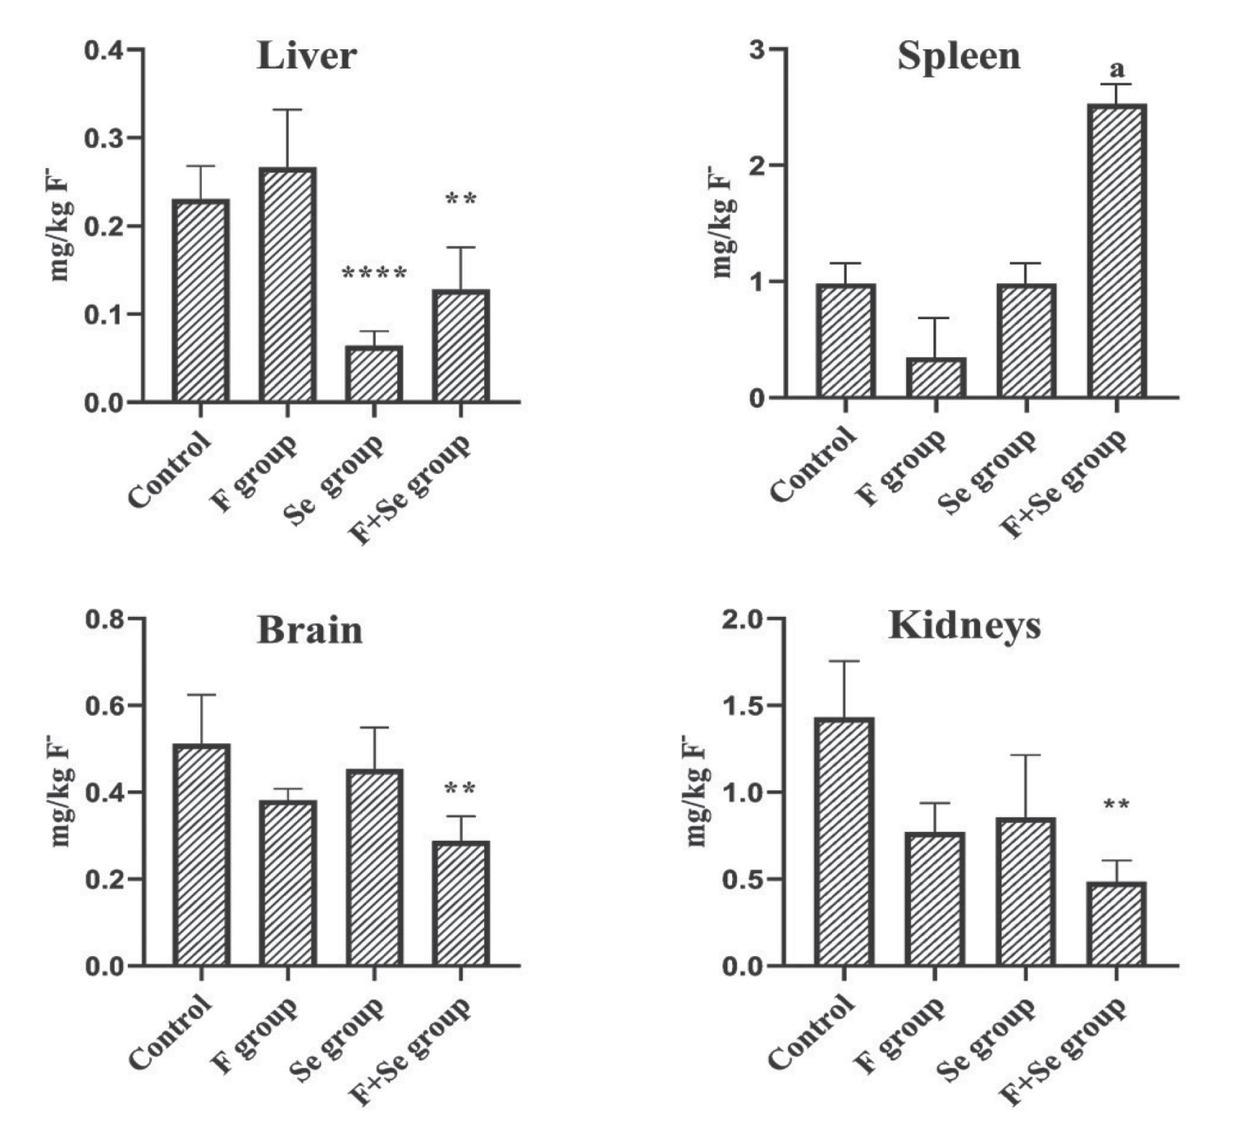
Fluoride (mg/kg) distribution across tissues in Wistar rats exposed to fluoride and/or selenium through drinking water for 28 days
| Group | Liver | Spleen | Brain | Kidneys |
|---|---|---|---|---|
| Control | 0.23±0.04bd | 0.98±0.02ad | 0.51±0.11c | 1.43±1.07abc |
| F | 0.27±0.06d | 0.35±0.04d | 0.38±0.03d | 0.77±0.15abc |
| Se | 0.06±0.02bcd | 0.99±0.02cd | 0.45±0.1abd | 0.85±0.32ac |
| F+Se | 0.13±0.05bcd | 2.53±0.03acd | 0.29±0.06abd | 0.48±0.11abc |
Copper, zinc, and iron levels in blood, liver, spleen, brain, and kidneys of Wistar rats exposed to fluoride and/or selenium through drinking water for 28 days
| Sample | Bioelements | Groups | |||
|---|---|---|---|---|---|
| Control | F | F+Se | Se | ||
| Blood | Cu (μmol/L) | 22.05±4.97 | 32.51±8.01* | 29.21±3.05### | 51.03±7.881*** |
| Zn (μmol/L) | 60.63 47.55–71.44 | 90.67* 56.84–122.4 | 84.02# 51.64–106.0 | 216.4*** 181.4–226.9 | |
| Fe (mmol/L) | 4.89±2.01 | 5.40±4.47 | 4.79±2.11### | 13.47±0.35*** | |
| Liver | Cu (μg/g) | 3.78±0.43 | 3.07±0.18*** | 3.22±0.18**## | 2.68±0.21*** |
| Zn (μg/g) | 29.86 28.79–31.93 | 31.75 30.97–54.93 | 32.25# 29.63–37.10 | 50.28** 45.43–69.18 | |
| Fe (μg/g) | 122.9±19.59 | 121.8±7.69 | 105.1±11.73*### | 71.52±10.29*** | |
| Spleen | Cu (μg/g) | 1.65±0.41 | 1.14±0.51 | 0.54±1.27 | 0.99±0.00 |
| Zn (μg/g) | 34.55±0.35 | 36.42±1.32 | 42.95±3.185 | 46.47±7.39* | |
| Fe (μg/g) | 239.5±90.27 | 250.6±49.15 | 287.6±26.45 | 224.6±96.80 | |
| Brain | Cu (μg/g) | 2.79±1.39 | 2.21±0.76 | 2.88±0.31 | 3.181±0.68 |
| Zn (μg/g) | 20.08 13.12–38.46 | 12.18 8.30–17.03 | 7.28* 4.62–10.10 | 1.99** 0.53–17.20 | |
| Fe (μg/g) | 48.10±15.35 | 29.90±7.78* | 35.34±9.85 | 44.00±11.27 | |
| Kidneys | Cu (μg/g) | 7.57 5.35–8.69 | 5.06 4.16–7.01 | 4.48# 3.96–5.54 | 7.46 5.37–10.70 |
| Zn (μg/g) | 113.4 74.50–143.9 | 43.87* 23.21–66.48 | 29.59** 22.90–39.13 | 31.32** 23.86–50.85 | |
| Fe (μg/g) | 81.78 71.67–101.6 | 36.48** 31.99–39.67 | 44.40 40.02–51.71 | 37.58** 28.45–47.89 | |