
Figure 1

Figure 2
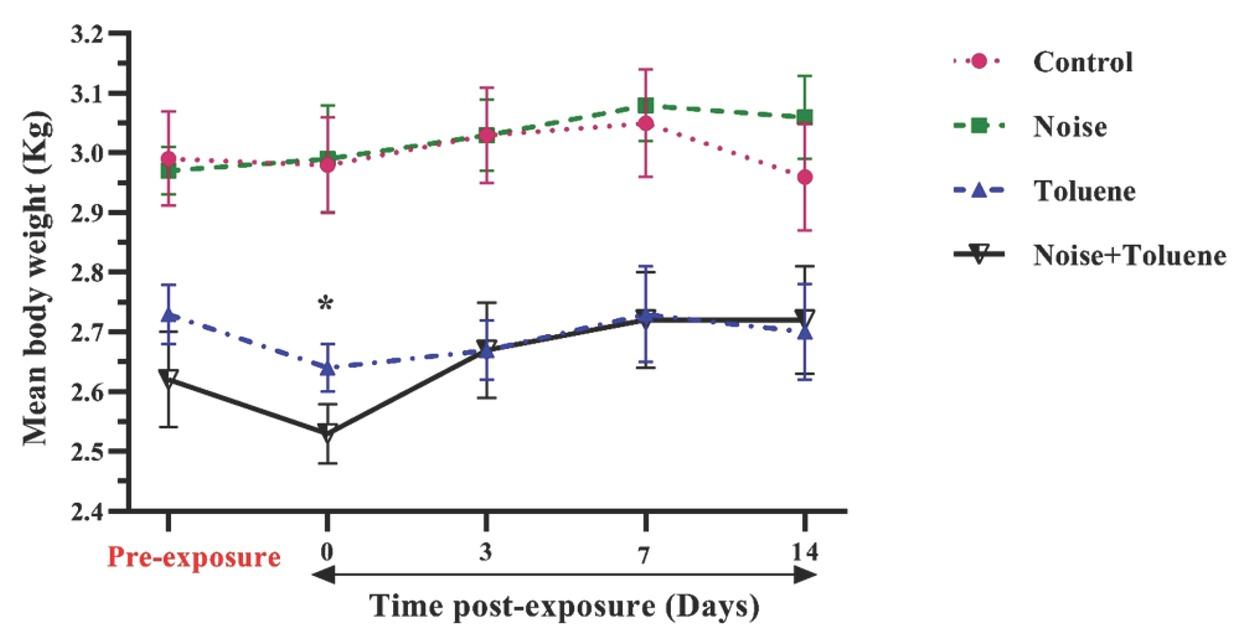
Figure 3
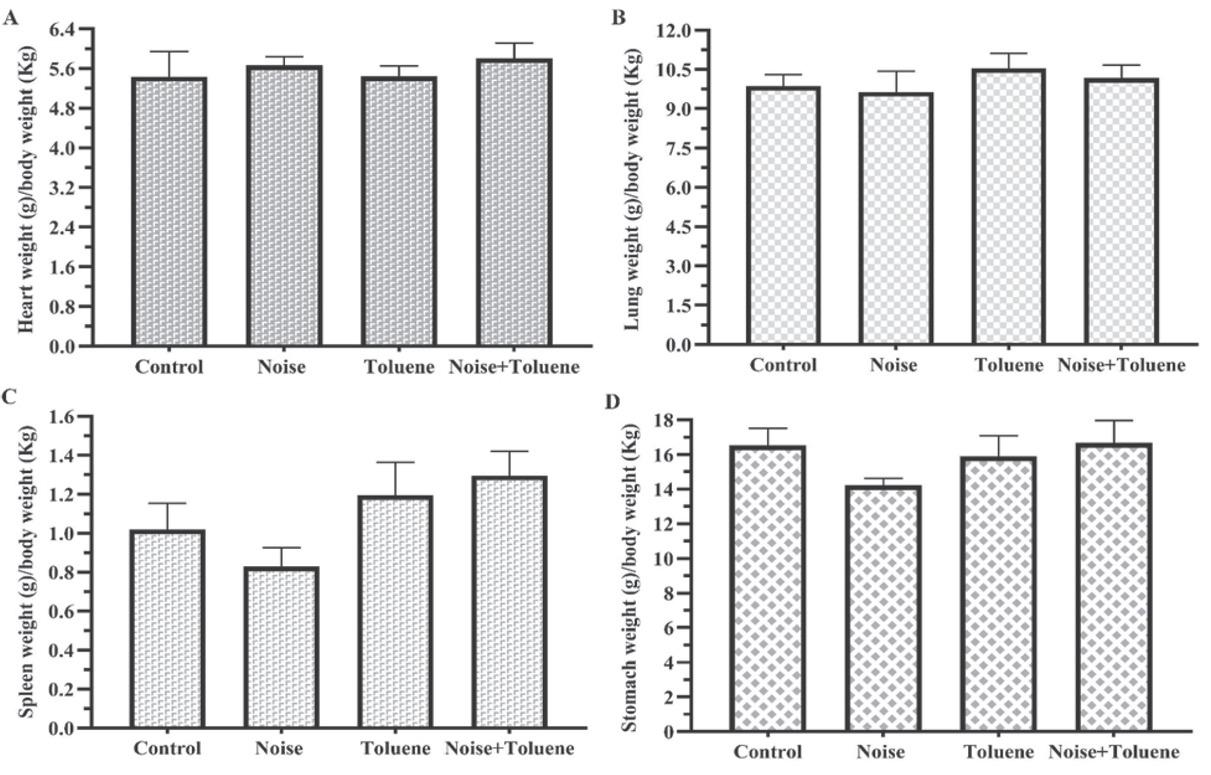
Figure 4
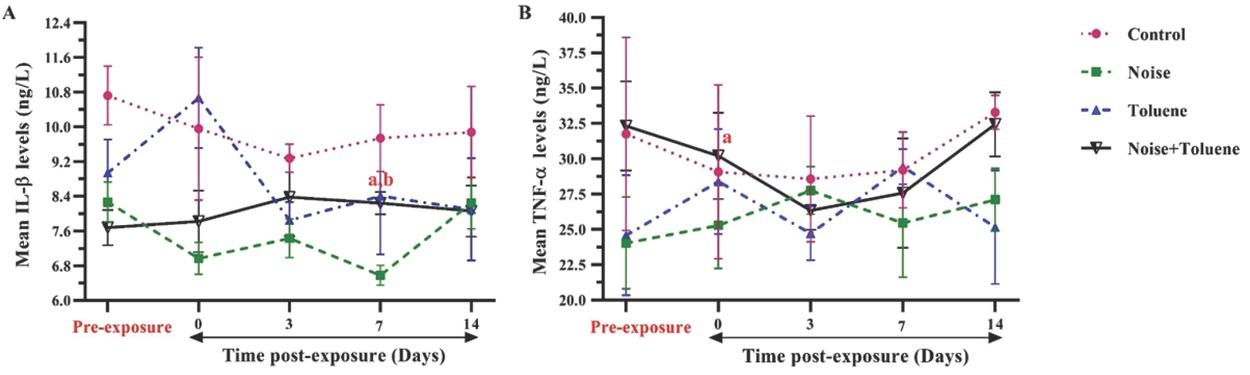
Figure 5
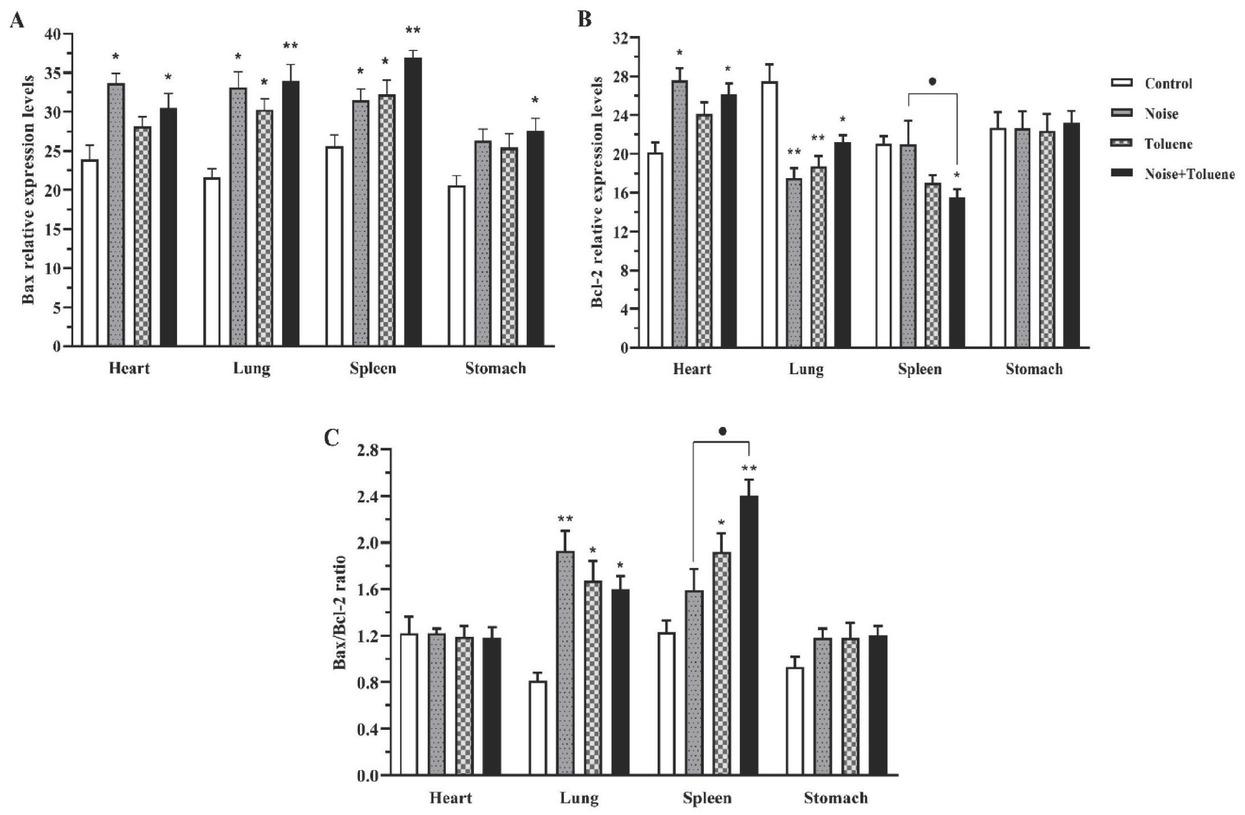
Figure 6
Figure 7
Figure 8
Figure 9
Coefficients of ANOVA analysis for different apoptosis indices in the heart, lung, spleen, and stomach on day 14 post exposure (values are modified based on pre-exposure and control values to remove the effects of confounding variables)
| Tissue | Parameter | Noise group | Toluene group | Combined group |
|---|---|---|---|---|
| Heart | Bax | 4.58±1.34 | -0.88±1.34 | 1.44±1.34 |
| Bcl-2 | 3.08±1.01 | -0.39±1.01 | 1.62±1.01 | |
| Bax/Bcl-2 | 0.0217±0.0882 | -0.0138±0.0882 | -0.0233±0.0882 | |
| Lung | Bax | 3.39±1.46 | 0.54±1.46 | 4.19±1.46 |
| Bcl-2 | -3.71±1.06 | -2.55±1.06 | -0.00±1.06 | |
| Bax/Bcl-2 | 0.430±0.125 | 0.165±0.125 | 0.102±0.125 | |
| Spleen | Bax | -0.08±1.24 | 0.70±1.24 | 5.35±1.24 |
| Bcl-2 | 2.33±1.21 | -1.61±1.21 | -3.10±1.21 | |
| Bax/Bcl-2 | -0.192±0.131 | 0.131±0.131 | 0.617±0.131 | |
| Stomach | Bax | 1.34±1.34 | 0.45±1.34 | 2.60±1.34 |
| Bcl-2 | -0.08±1.39 | -0.35±1.39 | 0.46±1.39 | |
| Bax/Bcl-2 | 0.0598±0.0884 | 0.0578±0.0884 | 0.0738±0.0884 |
Primers used for quantitative RT-PCR analyses
| Gene | Primer sequence (5'-3') | length (bp) |
|---|---|---|
| Bax | Forward: AGGTCTTTTTCCGAGTGGCAGC | 234 |
| Revers: GCGTCCCAAAGTAGGAGAGGAG | ||
| Bcl-2 | Forward: GACGACTTCTCCCGCCGCTAC | 245 |
| Revers: CGGTTCAGGTACTCAGTCATCCAC | ||
| GAPDH | Forward: GCCAAAAGGGTCATCATCTCTGC | 183 |
| Revers: GGTCACGAGTCCTTCCACGATAC | ||
Coefficients of ANOVA analysis for relative tissue weights (tissue/body weight) in different groups taken on day 14 post exposure [(values are modified based on pre-exposure and control values to remove the effects of confounding variables_ Combined effects (synergism, antagonism) were calculated as described in a study by Piggott et al_ (30)_]
| Tissue | Noise group | Toluene group | Combined group | Interaction type |
|---|---|---|---|---|
| Heart | 0.075±0.279 | -0.146±0.279 | 0.222±0.279 | +Synergism |
| Lung | -0.416±0.506 | 0.488±0.506 | 0.120±0.506 | -Antagonism |
| Spleen | -0.264±0.116 | 0.121±0.116 | 0.203±0.116 | +Synergism |
| Stomach | -1.611±0.891 | 0.056±0.891 | 0.850±0.891 | +Synergism |
GEE analysis for body weights and the immunological parameters in respect to control over the 14 days after the end of exposure to noise and/ or toluene in New Zealand rabbits [(values are modified based on pre-exposure and control values to remove the effects of confounding variables_ Combined effects (synergism, antagonism) were calculated as described in a study by Piggott et al_ (30)]
| Time point post exposure | Parameter | Noise group | Toluene group | Combined group | Interaction type |
|---|---|---|---|---|---|
| Day 0 | TNF-α | 3.927±2.636 | 6.477±3.862 | 0.560±2.439 | +Antagonism |
| IL-β | -0.535±1.412 | 2.490b±0.689 | 0.900±1.462 | +Antagonism | |
| Body weight | 0.028±0.091 | -0.075±0.090 | -0.081a±0.036 | -Synergism | |
| Day 3 | TNF-α | 6.895±9.150 | 3.320±4.591 | -2.800±6.901 | -Synergism |
| IL-β | 0.600±1.215 | 0.350±0.930 | 2.140±1.242 | +Synergism | |
| Body weight | 0.018±0.076 | -0.097a±0.038 | 0.011±0.020 | -Antagonism | |
| Day 7 | TNF-α | 3.981±10.624 | 7.406±5.010 | -2.180±5.128 | -Synergism |
| IL-β | -0.703±0.687 | 0.447±2.221 | 1.540±0.917 | +Synergism | |
| Body weight | 0.038±0.059 | -0.06±0.036 | 0.031±0.020 | -Antagonism | |
| Day 14 | TNF-α | 1.525±7.446 | -0.975±7.747 | -1.420±2.416 | -Synergism |
| IL-β | 0.821±0.809 | -0.004±0.811 | 1.220±0.973 | +Synergism | |
| Body weight | 0.116±0.096 | -0.003±0.043 | 0.121b±0.027 | +Synergism |