
Figure 1
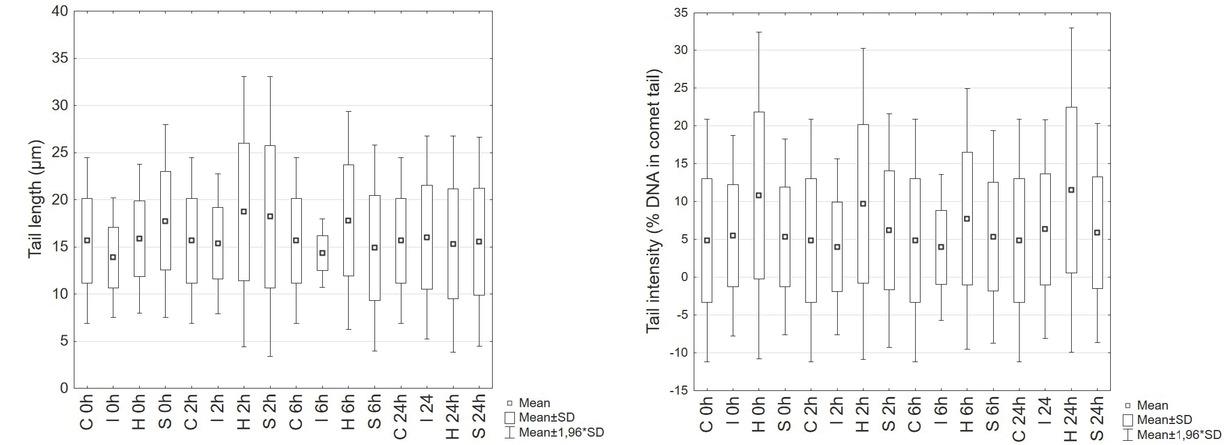
Figure 2
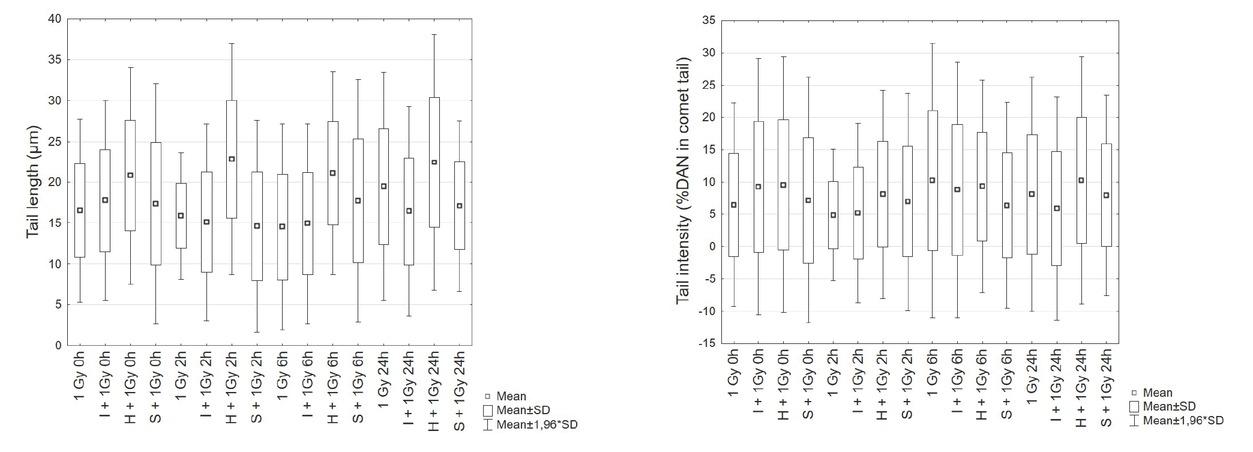
Figure 3
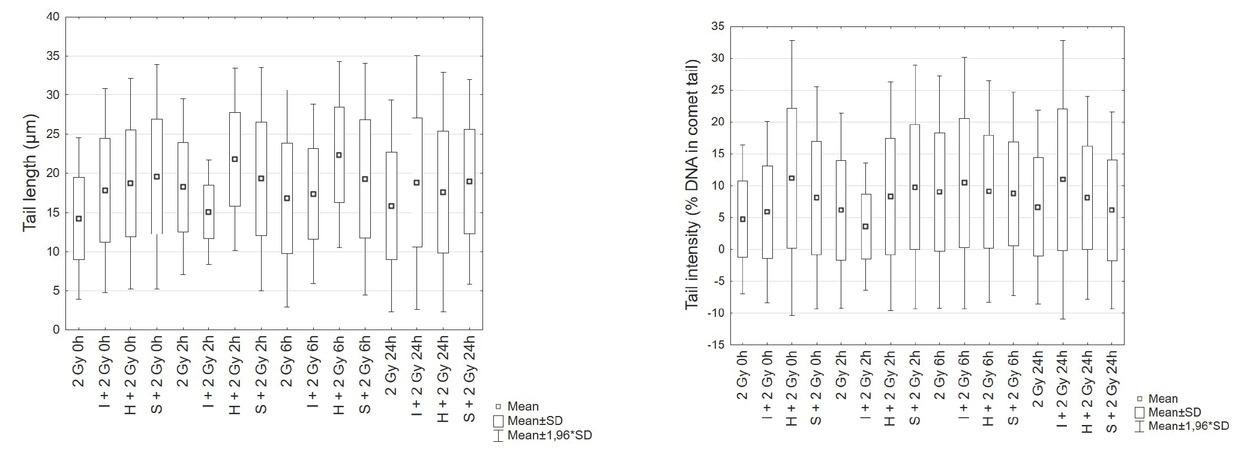
Statistical differences (Mann–Whitney U test; p<0_05), in tail length (TL, μm) and tail intensity (TI, % of DNA in comet tail) in kidney cells of Swiss albino mice treated with halothane, sevoflurane, or isoflurane alone or in combination with 1 or 2 Gy gamma-irradiation (60Co) compared to corresponding controls at the same time point
| Non-irradiated | |||||||
|---|---|---|---|---|---|---|---|
| Exposure | Halothane | Sevoflurane | Isoflurane | ||||
| Time points | TL | TI | TL | TI | TL | TI | |
| 0 h | NS | <0.001 | <0.001 | <0.001 | <0.001 | 0.004 | |
| 2 h | <0.001 | <0.001 | 0.025 | <0.001 | NS | NS | |
| 6 h | <0.001 | <0.001 | <0.001 | 0.01 | 0.021 | NS | |
| 24 h | <0.001 | <0.001 | NS | <0.001 | NS | <0.001 | |
| Irradiated 1 Gy | |||||||
| Exposure | Halothane + 1 Gy | Sevoflurane + 1 Gy | Isoflurane + 1 Gy | ||||
| Time points | TL | TI | TL | TI | TL | TI | |
| 0 h | <0.001 | <0.001 | NS | NS | NS | 0.014 | |
| 2 h | <0.001 | <0.001 | <0.001 | NS | <0.001 | NS | |
| 6 h | <0.001 | NS | <0.001 | 0.006 | NS | NS | |
| 24 h | <0.001 | 0.004 | 0.001 | NS | <0.001 | 0.003 | |
| Irradiated 2 Gy | |||||||
| Exposure | Halothane + 2 Gy | Sevoflurane + 2 Gy | Isoflurane + 2 Gy | ||||
| Time points | TL | TI | TL | TI | TL | TI | |
| 0 h | <0.001 | <0.001 | <0.001 | <0.001 | <0.001 | NS | |
| 2 h | <0.001 | 0.002 | NS | <0.001 | <0.001 | 0.002 | |
| 6 h | <0.001 | NS | <0.001 | NS | 0.02 | NS | |
| 24 h | <0.001 | <0.001 | <0.001 | NS | <0.001 | <0.001 | |
Distribution of 240 male Swiss albino mice by study groups
| Control | Halothane (2.4 % v/v) | Sevoflurane (2.4 % v/v) | Isoflurane (1.7 % v/v) | |
|---|---|---|---|---|
| Non-irradiated | ||||
| Time points | 0 h | 0 h | 0 h | 0 h |
| 2 h | 2 h | 2 h | 2 h | |
| 6 h | 6 h | 6 h | 6 h | |
| 24 h | 24 h | 24 h | 24 h | |
| Irradiated with 1 Gy | ||||
| Time points | 2 h | 2 h | 2 h | 2 h |
| 0 h | 0 h | 0 h | 0 h | |
| 6 h | 6 h | 6 h | 6 h | |
| 24 h | 24 h | 24 h | 24 h | |
| Irradiated with 2 Gy | ||||
| Time points | 0 h | 0 h | 0 h | 0 h |
| 2 h | 2 h | 2 h | 2 h | |
| 6 h | 6 h | 6 h | 6 h | |
| 24 h | 24 h | 24 h | 24 h | |
Cellular DNA repair index (percentage of repair) of tail length and tail intensity in non-irradiated mice and mice exposed to halothane (H), sevoflurane (S), or isoflurane (I) and/or 1 Gy or 2 Gy 2, 6, and 24 h from irradiation
| Tail length | Tail intensity | |||||
|---|---|---|---|---|---|---|
| 2 h | 6 h | 24 h | 2 h | 6 h | 24 h | |
| Non-irradiated | ||||||
| Halothane | -17.86 | -12.11 | 3.56 | 10.32 | 28.42 | -6.44 |
| Sevoflurane | -2.56 | 16.14 | 12.39 | -15.71 | -0.65 | -10.11 |
| Isoflurane | -10.71 | -3.42 | -15.28 | 26.77 | 28.12 | -15.62 |
| Irradiated with 1 Gy | ||||||
| 1 Gy | 3.76 | 12.01 | -18.10 | 24.20 | -58.95 | -25.08 |
| Halothane + 1Gy | -9.78 | -1.46 | -7.86 | 15.28 | 2.54 | -7.38 |
| Sevoflurane + 1Gy | 16.06 | -2.07 | 1.76 | 3.35 | 11.02 | -10.80 |
| Iisoflurane + 1Gy | 14.92 | 15.91 | 7.34 | 43.96 | 4.92 | 36.08 |
| Irradiated with 2 Gy | ||||||
| 2 Gy | -28.19 | -17.81 | -11.22 | -29.75 | -90.54 | -40.43 |
| Halothane + 2Gy | -16.54 | -19.53 | 5.97 | 25.87 | 18.70 | 27.56 |
| Sevoflurane + 2Gy | 1.44 | 1.59 | 3.09 | -20.68 | -7.65 | 24.16 |
| Isoflurane + 2Gy | 15.54 | 2.52 | -5.55 | 39.13 | -77.69 | -87.18 |