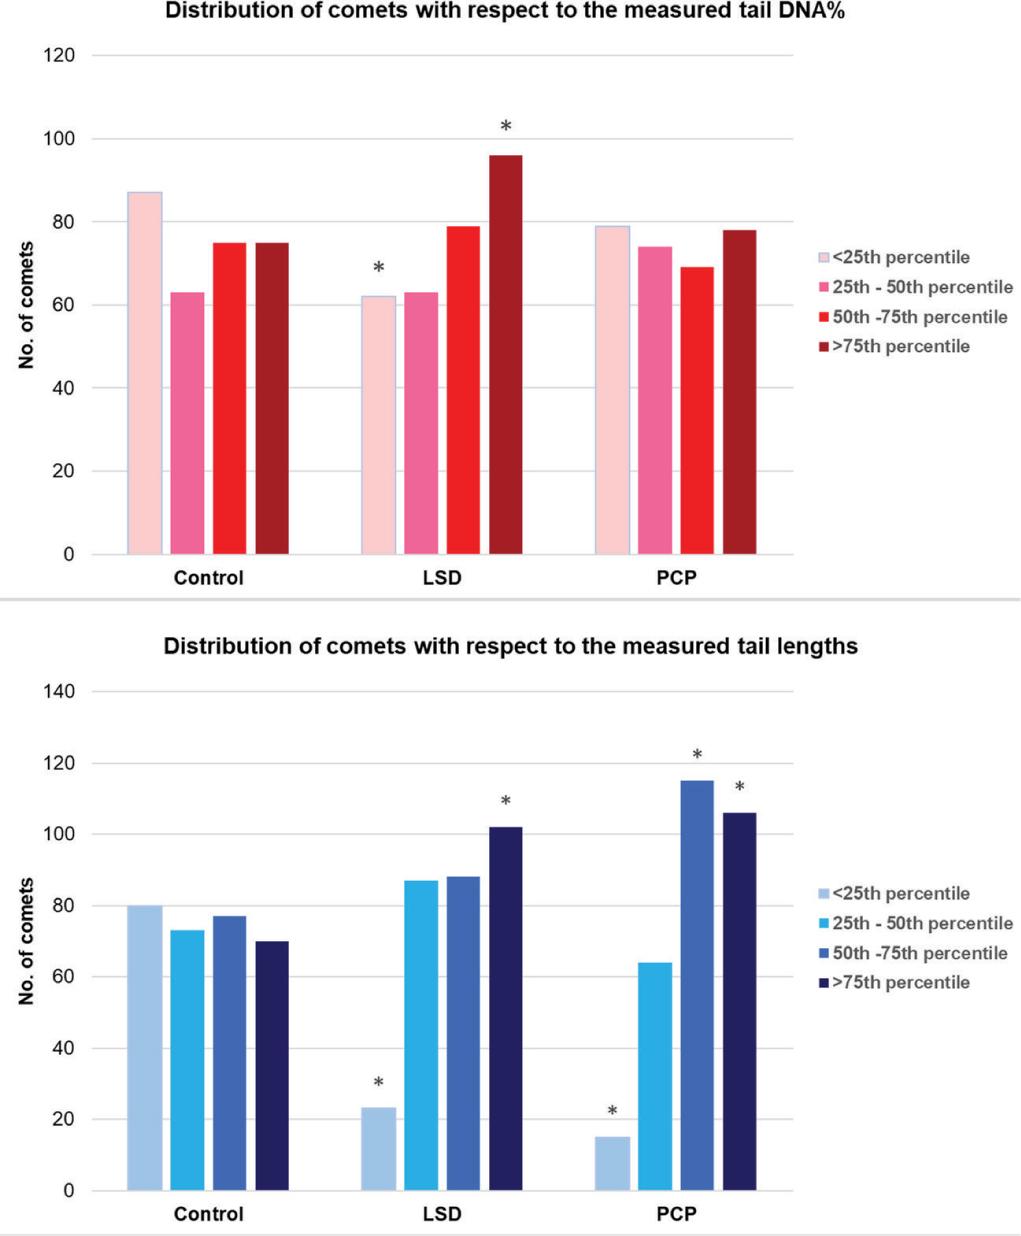
Have a personal or library account? Click to login
Cytotoxic, genotoxic, and oxidative stress-related effects of lysergic acid diethylamide (LSD) and phencyclidine (PCP) in the human neuroblastoma SH-SY5Y cell line Cover

Cytotoxic, genotoxic, and oxidative stress-related effects of lysergic acid diethylamide (LSD) and phencyclidine (PCP) in the human neuroblastoma SH-SY5Y cell line

Open Access
|Dec 2021

Figures & Tables

Figure 1

Frequency distribution of DNA damage in SH-SY5Y cells after treatment with LSD (6.25 μmol/L) and PCP (3.13 μmol/L) compared to control (untreated cells). *p<0.05 vs control (Pearson’s χ2 test)

Figure 2

Concentration of malondialdehyde (MDA) measured in SH-SY5Y cells after treatment with LSD (6.25 μmol/L) and PCP (3.13 μmol/L) compared to control. *p<0.05 vs control (Mann-Whitney U test)

Figure 3

ROS production in SH-SY5Y cells measured with the DCFH-DA assay after treatment with LSD (6.25 μmol/L) and PCP (3.13 μmol/L) compared to control. *p<0.05 vs control (Mann-Whitney U test); DCFH-DA – 2’,7’-dichlorodihydrofluorescein diacetate

Figure 4

Glutathione (GSH) level measured in SH-SY5Y cells after treatment with LSD (6.25 μmol/L) and PCP (3.13 μmol/L) compared to control. *p<0.05 vs control (Mann-Whitney U test)

Figure 5

Glutathione peroxidase (GPx) activity measured in SH-SY5Y cells after treatment with LSD (6.25 μmol/L) and PCP (3.13 μmol/L) compared to control. *p<0.05 vs control (Mann-Whitney U test)

Figure 6

Superoxide dismutase (SOD) activity measured in SH-SY5Y cells after treatment with LSD (6.25 μmol/L) and PCP (3.13 μmol/L) compared to control. *p<0.05 vs control (Mann-Whitney U test)

Figure 7

Catalase (CAT) activity measured in SH-SY5Y cells after treatment with LSD (6.25 μmol/L) and PCP (3.13 μmol/L) compared to control. *p<0.05 vs control (Mann-Whitney U test)

Primary DNA damage measured in SH-SY5Y cells using the alkaline comet assay after treatment with 6_25 μmol/L (2_02 mg/L) LSD, 3_13 μmol/L (0_76 mg/L) PCP, and in respective negative and positive controls

SampleNegative control (untreated cells)LSDPCPPositive control (H2O2)
DescriptorTail DNA%Tail length (μm)Tail DNA%Tail length (μm)Tail DNA%Tail length (μm)Tail DNA%Tail length (μm)
Mean1.5713.553.14*15.46*2.3015.65*8.33*15.84*
SE0.140.260.330.320.250.270.660.39
SD2.434.535.685.514.274.6011.516.84
Median0.2212.500.6213.750.2114.582.8713.75
Minimum06.2507.5007.9205.00
Maximum11.9728.3345.7754.1729.2837.0863.8145.83

Experimental schedule

Experimental groupLSD (mg/L)PCP (mg/L)
0.39 μmol/L0.130.09
0.78 μmol/L0.250.19
1.56 μmol/L0.500.38
3.13 μmol/L1.010.76
6.25 μmol/L2.021.52
12.50 μmol/L4.043.04
25 μmol/L8.096.08
50 μmol/L16.1712.17
100 μmol/L32.3424.34
Controluntreated cells

Viability of SH-SY5Y cells exposed to LSD and PCP in concentrations of 0_39–100 μmol/L for 24 h determined with the MTS assay

Experimental groupViable cells (mean % ±SD)
LSDPCP
Control99.67±3.7499.20±4.42
0.39 μmol/L97.77±7.9492.65±6.25
0.78 μmol/L93.68±8.35*90.05±7.07
1.56 μmol/L90.26±7.52*86.54±11.08*
3.13 μmol/L90.67±5.95*84.17±9.03*
6.25 μmol/L88.06±7.44*78.10±5.49*
12.5 μmol/L94.18±8.1876.28±10.10*
25 μmol/L100.17±7.2975.57±9.15*
50 μmol/L101.82±6.7771.02±13.29*
100 μmol/L98.09±7.6372.80±8.85*
DOI: https://doi.org/10.2478/aiht-2021-72-3604 | Journal eISSN: 1848-6312 | Journal ISSN: 0004-1254
Language: English, Croatian, Slovenian
Page range: 333 - 342
Submitted on: Oct 1, 2021
Accepted on: Nov 1, 2021
Published on: Dec 30, 2021
Published by: Institute for Medical Research and Occupational Health
In partnership with: Paradigm Publishing Services
Publication frequency: 4 issues per year

© 2021 Andreja Jurič, Antonio Zandona, Blanka Tariba Lovaković, Dubravka Rašić, Alica Pizent, Goran Kozina, Maja Katalinić, Ana Lucić Vrdoljak, Irena Brčić Karačonji, published by Institute for Medical Research and Occupational Health
This work is licensed under the Creative Commons Attribution-NonCommercial-NoDerivatives 3.0 License.