
Table 1
The experimental design for the genotoxicity assessment of Al2O3, Fe2O3, and Cu nanoparticles using male BALB/c mice
| Nanoparticles | Genotoxicity assay | No of animals | Groups | Dose (mg/kg) |
|---|---|---|---|---|
| Al2A3 | Chromosomal aberration | 15=3 per group | NC | 0 |
| 1 | 75 | |||
| 2 | 150 | |||
| 3 | 300 | |||
| MMC (PC) | 2 | |||
| Micronucleus assay | 15=3 per group | NC | 0 | |
| 1 | 75 | |||
| 2 | 150 | |||
| 3 | 300 | |||
| MMC (PC) | 2 | |||
| Comet assay | 15=3 per group | NC | 0 | |
| 1 | 75 | |||
| 2 | 150 | |||
| 3 | 300 | |||
| MMS (PC) | 100 | |||
| Fe2O3 | Chromosomal aberration | 15=3 per group | NC | 0 |
| 1 | 75 | |||
| 2 | 150 | |||
| 3 | 300 | |||
| MMC (PC) | 2 | |||
| Micronucleus assay | 15=3 per group | NC | 0 | |
| 1 | 75 | |||
| 2 | 150 | |||
| 3 | 300 | |||
| MMC (PC) | 2 | |||
| Comet assay | 15=3 per group | NC | 0 | |
| 1 | 75 | |||
| 2 | 150 | |||
| 3 | 300 | |||
| MMS (PC) | 100 | |||
| Cu | Chromosomal aberration | 15=3 per group | NC | 0 |
| 1 | 5 | |||
| 2 | 10 | |||
| 3 | 15 | |||
| MMC (PC) | 2 | |||
| Micronucleus assay | 15=3 per group | NC | 0 | |
| 1 | 5 | |||
| 2 | 10 | |||
| 3 | 15 | |||
| MMC (PC) | 2 | |||
| Comet assay | 15=3 per group | NC | 0 | |
| 1 | 5 | |||
| 2 | 10 | |||
| 3 | 15 | |||
| MMS (PC) | 100 |
Table 2
Chromosomal aberrations in bone marrow cells of male BALB/c mice treated with Fe2O3, Al2O3 and Cu nanoparticles
| Group | Dose (mg/kg) | No. of analysed metaphases | Chromosomal aberrations | TA/500 cells | CA/cell Mean ± SD | |||
|---|---|---|---|---|---|---|---|---|
| CtB | ChB | CtG | ChG | |||||
| Fe2O3 nanoparticles | ||||||||
| NC | 0 | 500 | 18 | 13 | 14 | 15 | 60 | 0.120±0.026 |
| PC | 2 | 500 | 106 | 35 | 104 | 60 | 305 | 0.610±0.081* |
| 1 | 75 | 500 | 21 | 10 | 35 | 15 | 89 | 0.178±0.057 |
| 2 | 150 | 500 | 20 | 12 | 38 | 10 | 86 | 0.172±0.023 |
| 3 | 300 | 500 | 27 | 09 | 40 | 16 | 92 | 0.184±0.029 |
| Al2O3 nanoparticles | ||||||||
| NC | 0 | 500 | 14 | 16 | 11 | 17 | 58 | 0.116±0.019 |
| PC | 2 | 500 | 102 | 41 | 115 | 53 | 311 | 0.622±0.147* |
| 1 | 75 | 500 | 20 | 13 | 38 | 12 | 83 | 0.166±0.081 |
| 2 | 150 | 500 | 15 | 10 | 43 | 10 | 79 | 0.158±0.046 |
| 3 | 300 | 500 | 19 | 14 | 40 | 11 | 89 | 0.168±0.039 |
| Cu nanoparticles | ||||||||
| NC | 0 | 500 | 15 | 12 | 18 | 16 | 61 | 0.12 ±0.037 |
| PC | 2 | 500 | 98 | 35 | 110 | 61 | 304 | 0.608±0.081* |
| 1 | 5 | 500 | 20 | 13 | 22 | 15 | 70 | 0.140±0.054 |
| 2 | 10 | 500 | 19 | 14 | 20 | 16 | 69 | 0.138±0.048 |
| 3 | 15 | 500 | 50 | 26 | 68 | 41 | 185 | 0.370±0.076* |
Table 3
Mitotic index in bone marrow cells of male BALB/c mice treated with Fe2O3, Al2O3, and Cu nanoparticles
| Group | Dose (mg/kg) | No. of analysed metaphases | No. of mitotic cells | Mitotic index (%) |
|---|---|---|---|---|
| Fe2O3 nanoparticles | ||||
| NC | 0 | 5000 | 409 | 8.180±0.540 |
| PC | 2 | 5000 | 61 | 1.220±0.259* |
| 1 | 75 | 5000 | 399 | 7.980±0.370 |
| 2 | 150 | 5000 | 395 | 7.900±0.709 |
| 3 | 300 | 5000 | 401 | 8.080±1.180 |
| Al2O3 nanoparticles | ||||
| NC | 0 | 5000 | 417 | 8.340±0.351 |
| PC | 2 | 5000 | 58 | 1.160±0.288* |
| 1 | 75 | 5000 | 403 | 8.060±0.517 |
| 2 | 150 | 5000 | 409 | 8.180±0.687 |
| 3 | 300 | 5000 | 399 | 7.980±0.991 |
| Cu nanoparticles | ||||
| NC | 0 | 5000 | 411 | 8.220±0.277 |
| PC | 2 | 5000 | 54 | 1.080±0.238* |
| 1 | 5 | 5000 | 406 | 8.120±0.868 |
| 2 | 10 | 5000 | 399 | 7.980±0.673 |
| 3 | 15 | 5000 | 309 | 6.180±0.802* |
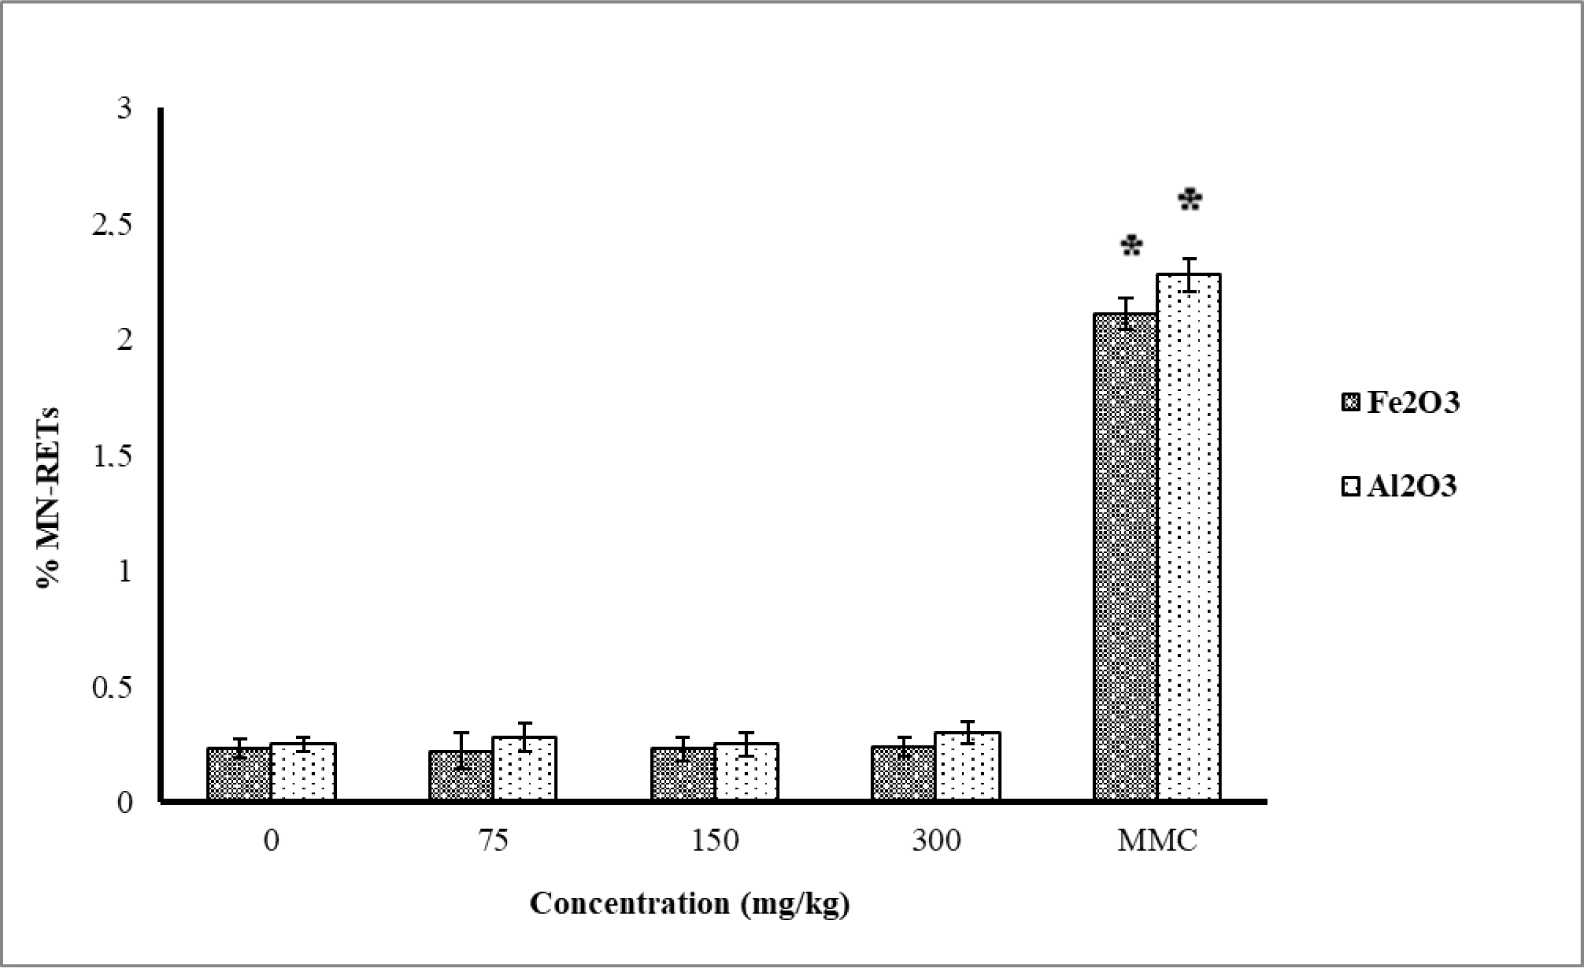
Figure 1
Reticulocyte micronucleus frequency (%MN-RETs) in mice treated with Fe2O3 or Al2O3 nanoparticles and a single dose of mitomycin C (MMC). * significant difference (P<0.05) from negative control (0)
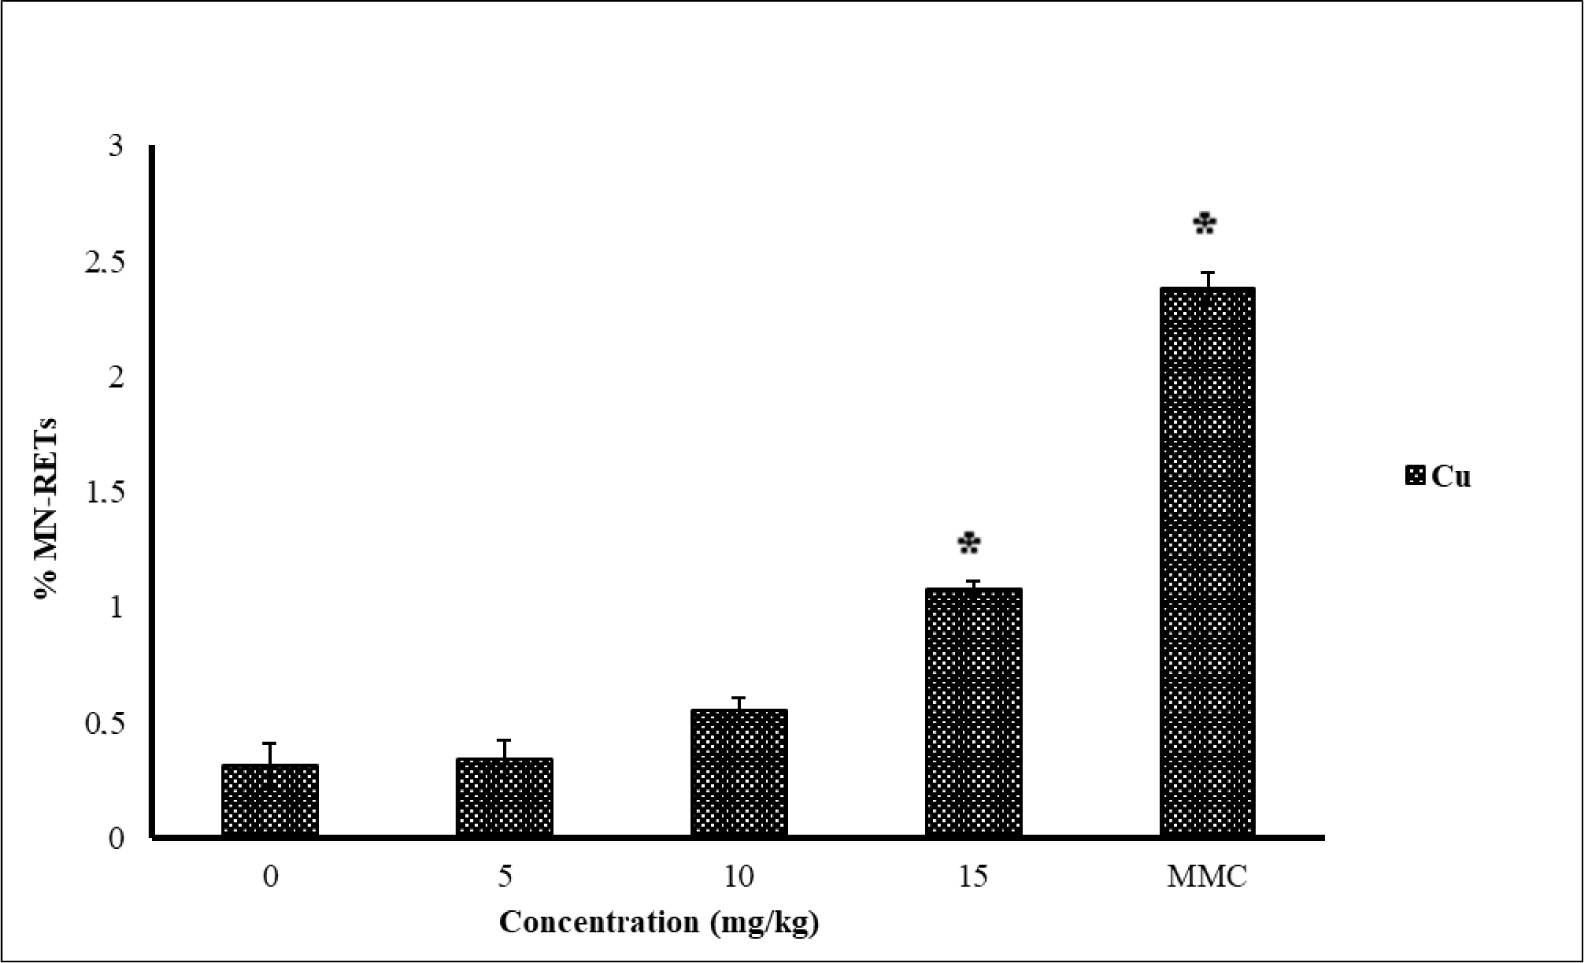
Figure 2
Reticulocyte micronucleus frequency (%MN-RETs) in mice treated with Cu nanoparticles and a single dose of mitomycin C (MMC). * significant difference (P<0.05) from negative control (0)
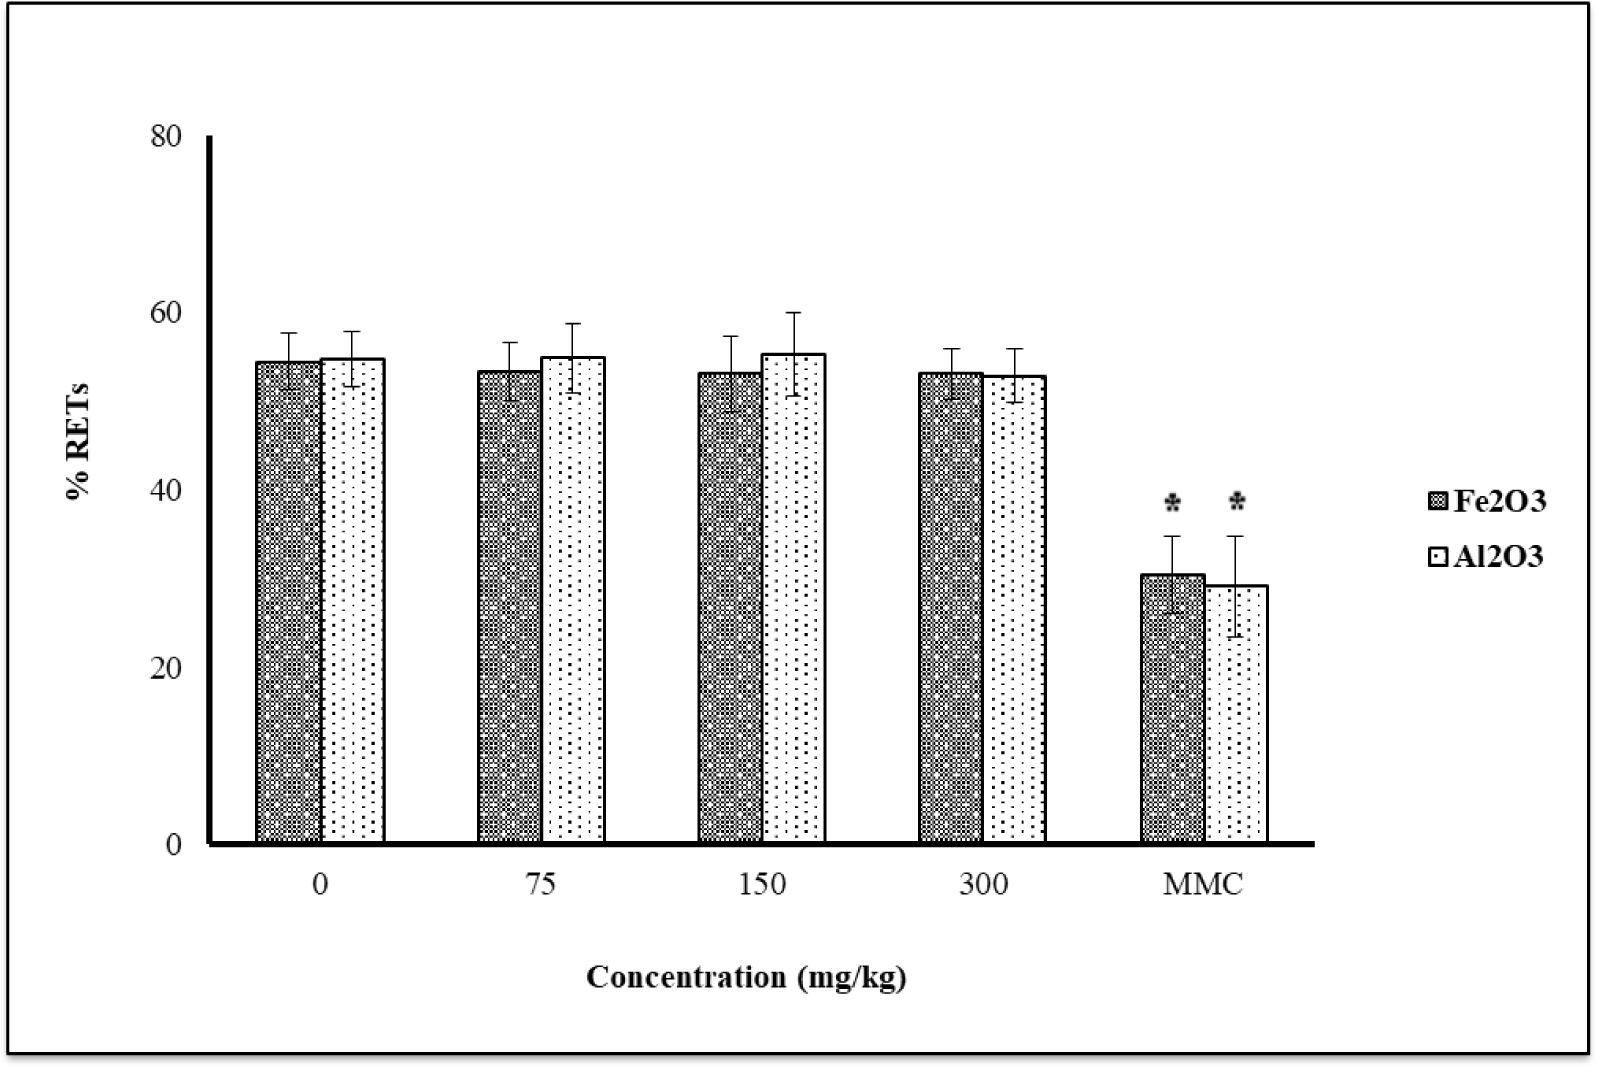
Figure 3
Reticulocyte frequency (%RETs) in mice treated with Fe2O3 or Al2O3 nanoparticles and a single dose of mitomycin C (MMC). *significant difference (P<0.05) from negative control (0)
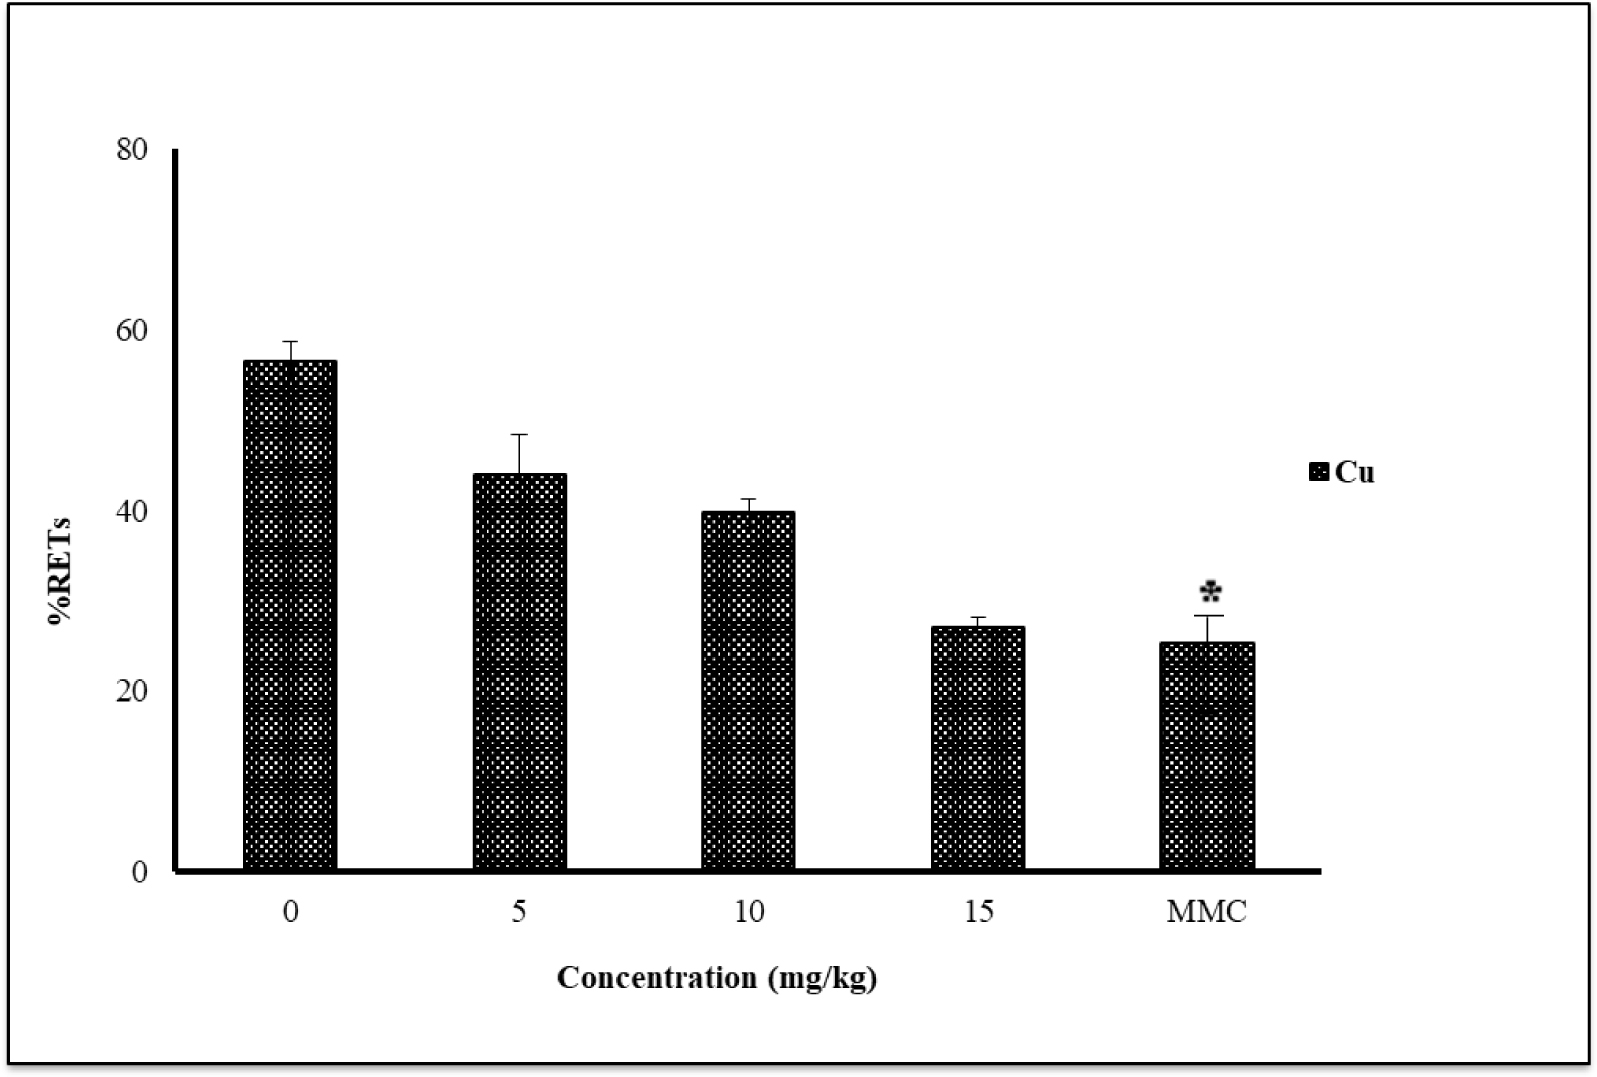
Figure 4
Reticulocyte frequency (%RET) in mice treated with Cu nanoparticles and a single dose of mitomycin C (MMC). *significant difference (P<0.05) from negative control (0)
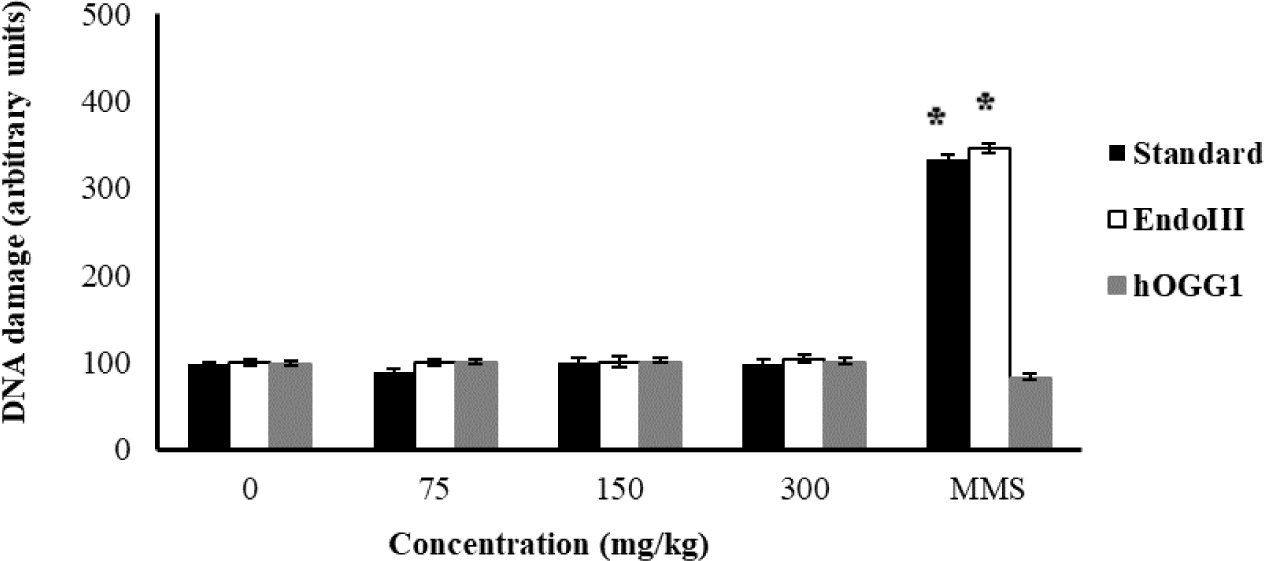
Figure 5
DNA damage induced by Al2O3 nanoparticles in mice bone marrow measured by the standard and enzyme-modified comet assays. * significant difference (P<0.05) from negative control. EndoIII – endonuclease III-modified comet assay; hOGG1 – human 8-hydroxyguanine DNA-glycosylase-modified comet assay; MMS – methyl methanesulphonate. Note: the reason for low hOGG1 findings with MMS is that it cannot detect alkylating damage caused by it (43)
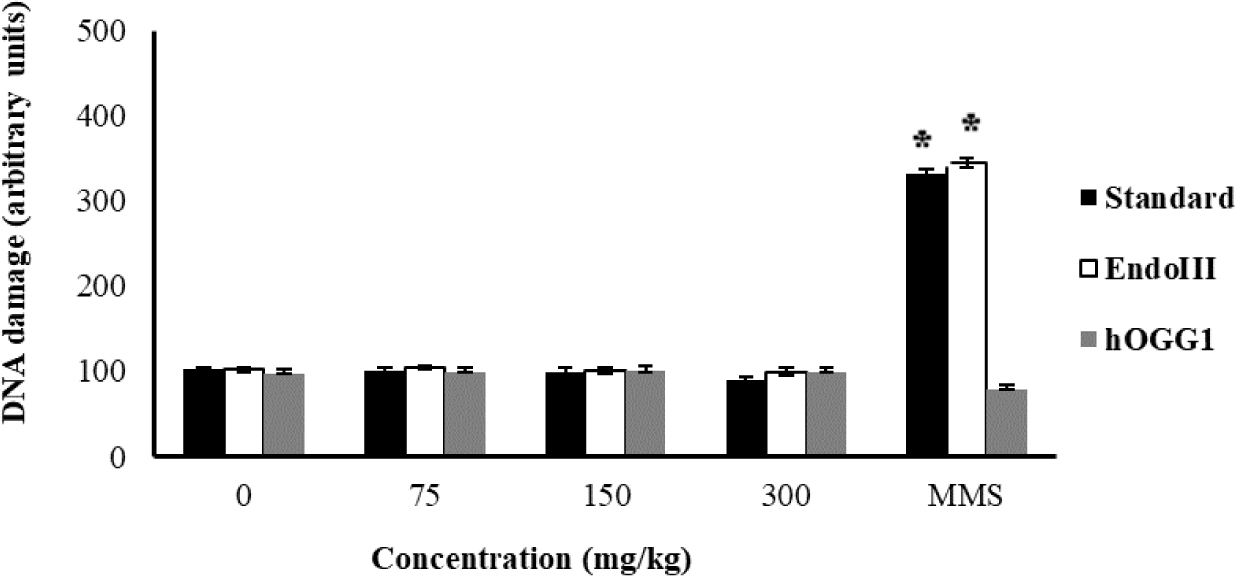
Figure 6
DNA damage induced by Fe2O3 nanoparticles in mice bone marrow measured by the standard and enzyme-modified comet assays. * significant difference (P<0.05) from negative control. EndoIII – endonuclease III-modified comet assay; hOGG1 – human 8-hydroxyguanine DNA-glycosylase-modified comet assay; MMS – methyl methanesulphonate. Note: the reason for low hOGG1 findings with MMS is that it cannot detect alkylating damage caused by it (43)
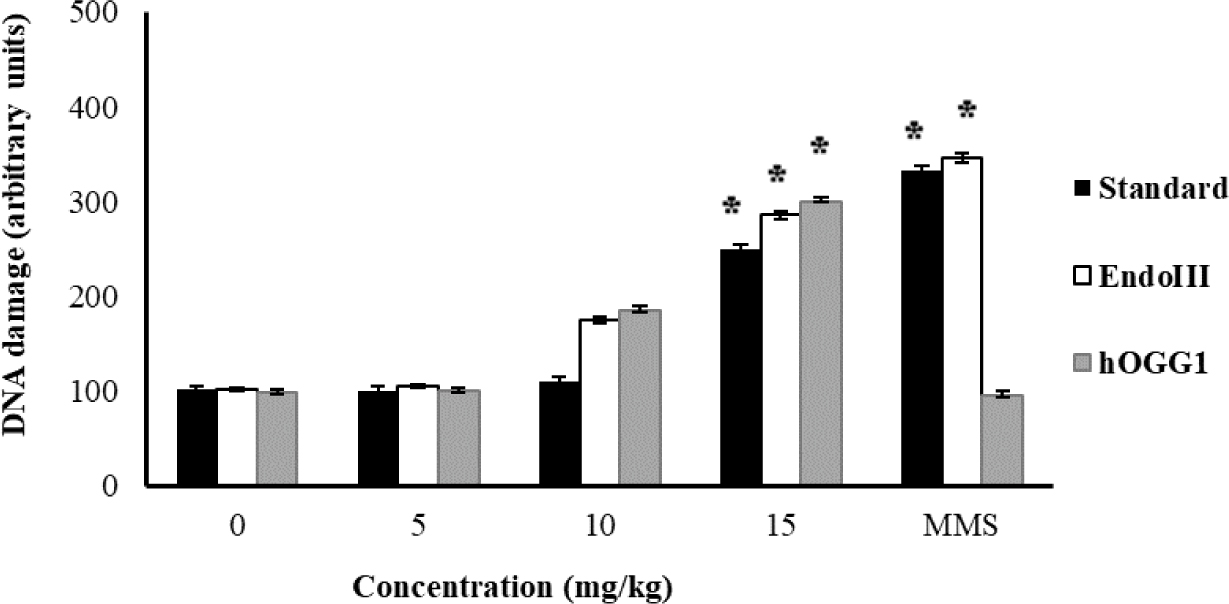
Figure 7
DNA damage induced by Cu nanoparticles in mice bone marrow measured by the standard and enzyme-modified comet assays. * significant difference (P<0.05) from negative control. EndoIII – endonuclease III-modified comet assay; hOGG1 – human 8-hydroxyguanine DNA-glycosylase-modified comet assay; MMS – methyl methanesulphonate. Note: the reason for low hOGG1 findings with MMS is that it cannot detect alkylating damage caused by it (43)