
Figure 1
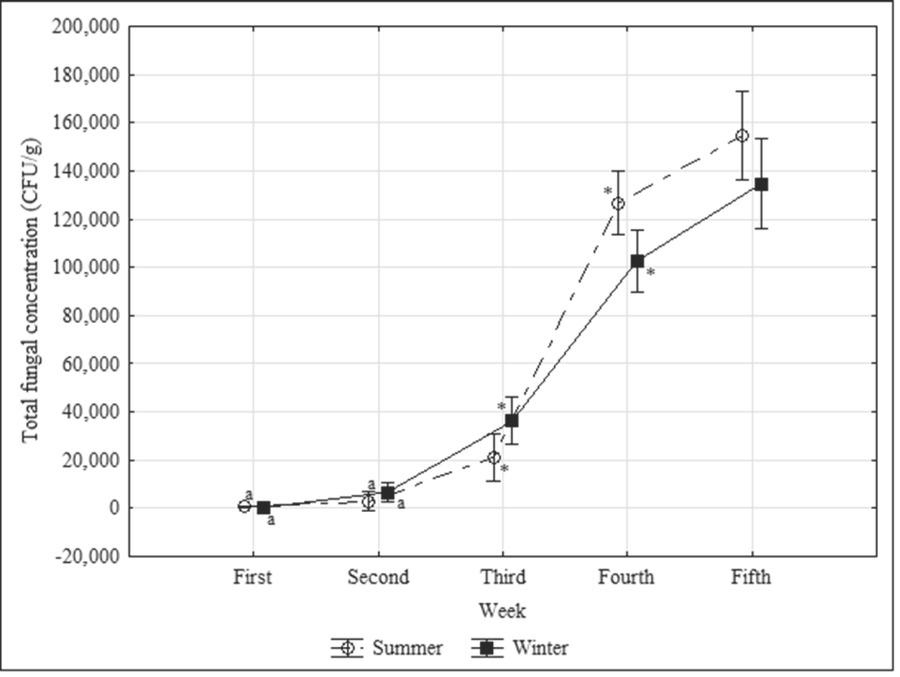
Figure 2
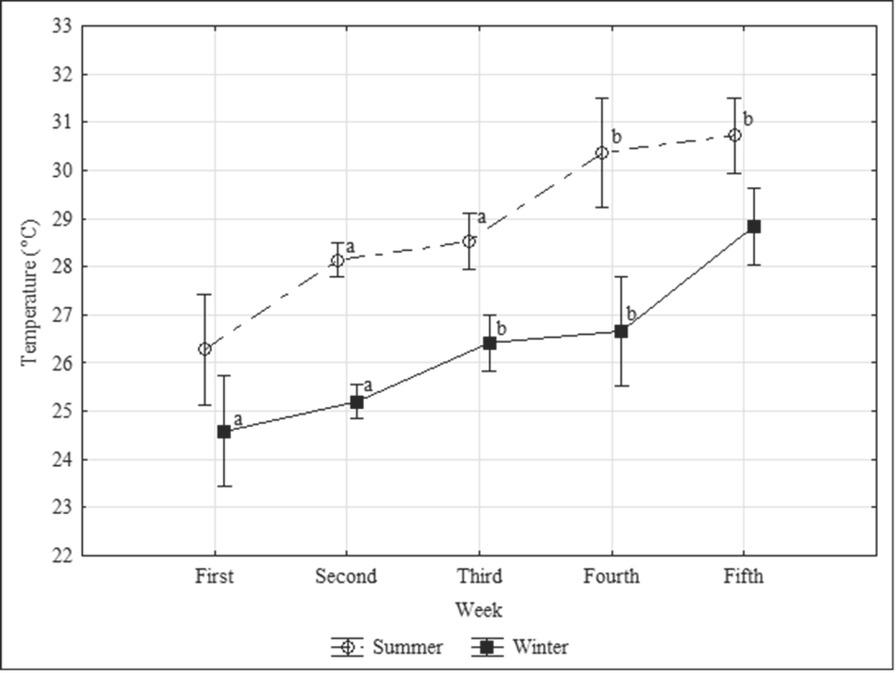
Figure 3
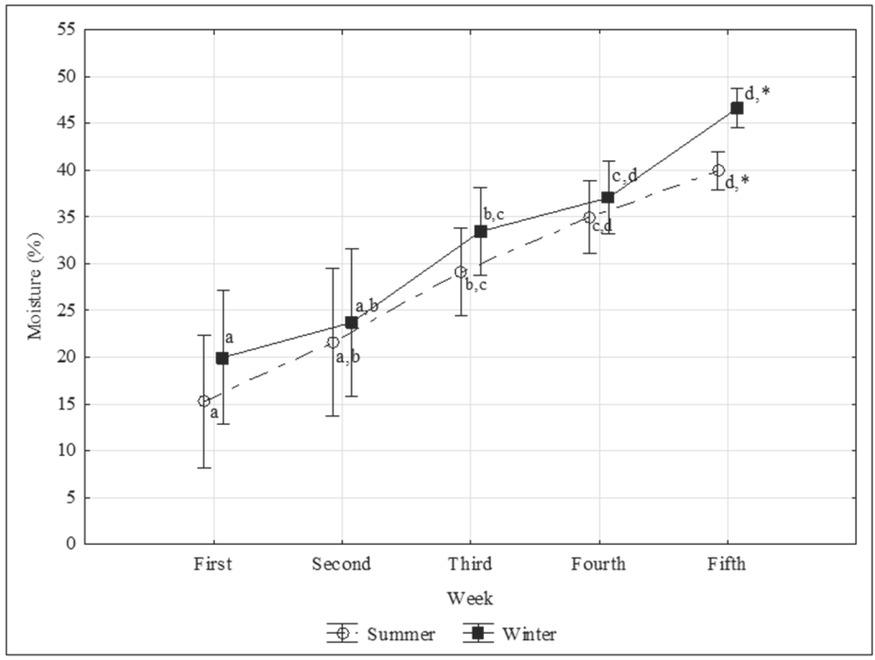
Figure 4
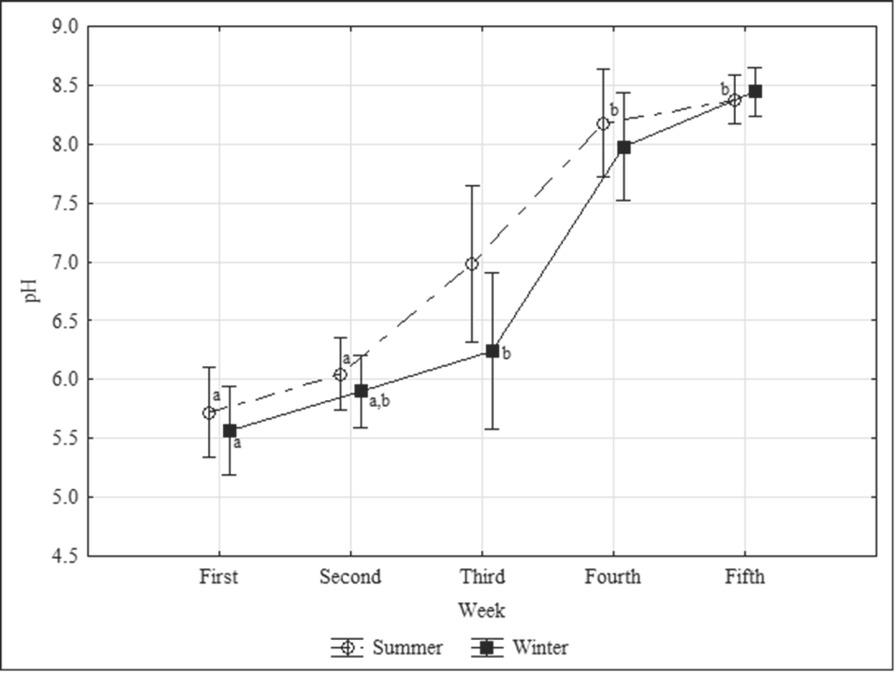
Comparison of total litter fungal concentrations, temperature, moisture, and pH between the summer and winter broiler fattening periods
| Parameter | Summer | Winter | P | |
|---|---|---|---|---|
| Fungi (CFU/g) | Median (range) | 1.82×10⁴ (3.00×10²–1.65×10⁵) | 3.32×10⁴ (2.00×10²–1.58×10⁵) | 0.62 |
| Temperature (°C) | Mean±SD (range) | 28.80±1.74 (25.60–31.80) | 26.34±1.75 (22.90–29.80) | <0.001 |
| Moisture (%) | Mean±SD (range) | 28.18±10.12 (7.90–42.30) | 32.17±11.07 (12.60–49.00) | 0.19 |
| pH | Mean±SD (range) | 7.06±1.18 (4.95–8.71) | 6.83±1.23 (5.42–8.61) | 0.50 |
Comparison of litter fungal composition (with concentrations by genera/sections) between the summer and winter broiler fattening periods
| Fungal genera | CFU/g Median (range) | P | |
|---|---|---|---|
| Summer | Winter | ||
| Aspergillus spp. | 2.00×10² (0–1.40×10³) | 0 (0–5.00×10²) | <0.01 |
| A. section Flavi | 1.00×10² (0–1.00×10³) | Not detected | <0.001 |
| A. section Nigri | 1.00×10² (0–1.40×10³) | 0 (0–5.00×10²) | 0.18 |
| Cladosporium spp. | 0 (0–1.00×10²) | Not detected | 0.82 |
| Fusarium spp. | Not detected | 0 (0–1.00×10²) | 0.82 |
| Mucor spp. | Not detected | 1.00×10² (0–2.90×10⁴) | <0.001 |
| Penicillium spp. | 0 (0–4.00×10²) | 1.50×10³ (0–2.85×10⁴) | <0.001 |
| Rhizopus spp. | 0 (0–1.00×10²) | 0 (0–2.00×10²) | 0.83 |
| Yeasts | 1.71×10⁴ (0–1.64×10⁵) | 9.20×10³ (0–1.35×10⁵) | 0.19 |
| Unidentified | 0 (0–1.00×10³) | 0 (0–50) | 0.03 |
Correlations between total litter fungal concentrations and litter temperature, moisture, and pH
| Parameter | Temperature (°C) | Moisture (%) | pH |
|---|---|---|---|
| Fungi (CFU/g) | 0.710* | 0.791* | 0.918* |