
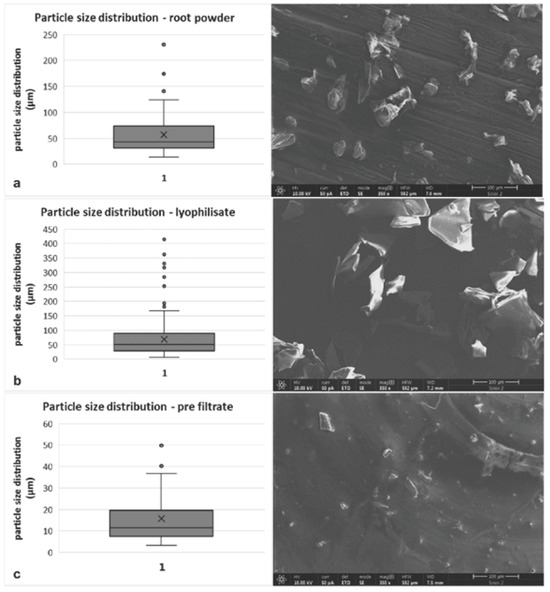
Figure 1
Particle size distribution of dispersed particles in (a) yellow gentian root powder; (b) lyophilisate; and (c) dissolved lyophilisate (pre-filtrate). Scale bar – 100 μm
Table 1
Gradient condition details used for UPLC separation.
| time (min) | % B |
|---|---|
| 0 → 2 | 10 → 28 |
| 2 → 3.5 | 28 → 30 |
| 3.5 → 5 | 30 → 55 |
| 5 → 5.1 | 55 → 10 |
| 5.1 → 6 | 10 → |
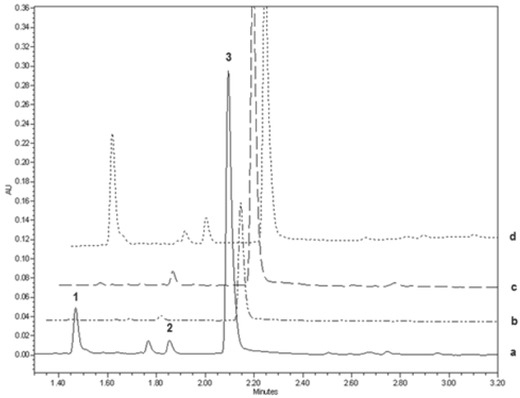
Figure 2
UPLC chromatograms of yellow gentian root extract in ethanol solution exported at 254 nm (a); 300 nm (b); 270 nm (c); and 240 nm (d). 1 – loganic acid; 2 – swertiamarin; 3 – overlapping gentiopicroside and sweroside peaks
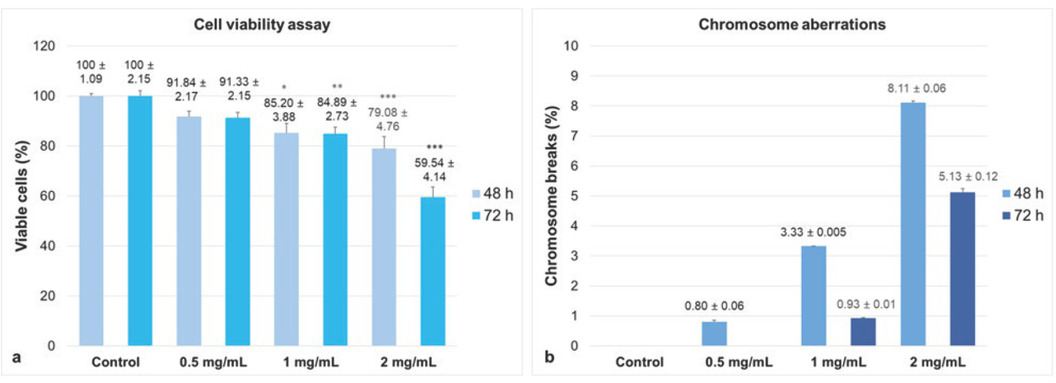
Figure 3
Cell viability expressed as percentage of control (a) and percentage of chromosome breaks (b) at different concentrations of yellow gentian root extract after 48 and 72 h treatment. *p<0.05, **p<0.01, ***p<0.001
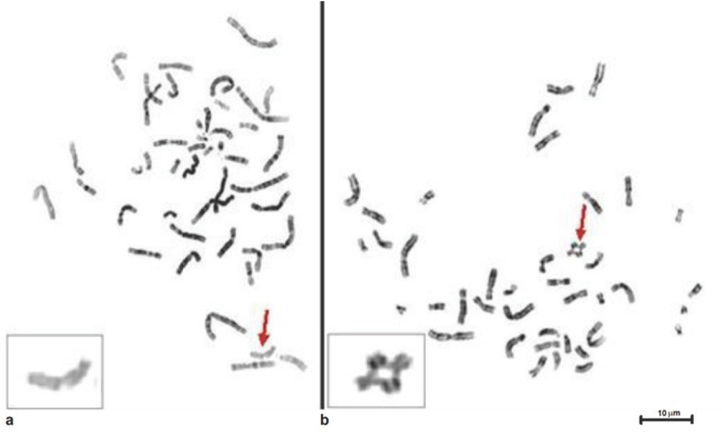
Figure 4
Photomicrograph of metaphase spreads after 72 h treatment with 2 mg/mL of yellow gentian root extract. Arrows mark chromatid break (a) and radial figure between two homologous chromosomes (17q) an indicator of homologous recombination - a mechanism of template-dependent DNA DSBs repair (b)
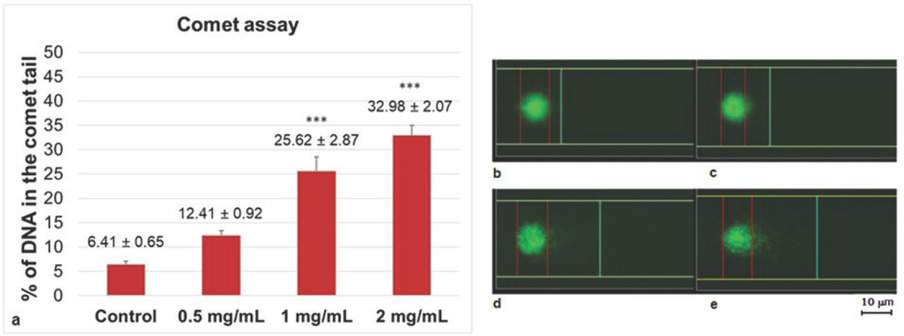
Figure 5
Graph (a) and photomicrograph (b-e) of YGRE-induced DNA damage established with the comet assay. b – control; c – 0.5 mg/mL; d – 1 mg/mL; e – 2 mg/mL; YGRE – yellow gentian root extract. Scale bar – 10 μm. ***p<0.001
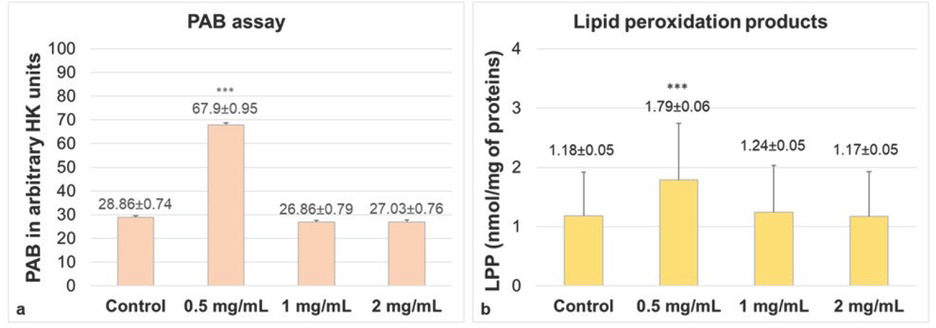
Figure 6
PAB levels presented as arbitrary HK units (a) and LPP levels expressed as nmol/mg of proteins (b) after treatment with increasing concentrations of yellow gentian root extract. ***p<0.001