
Driven by a growing collective focus on preventing metabolic illnesses, the international usage of sugar-free substitutes and ultra-processed nutritional products has expanded significantly. This shift reflects a broader attempt to mitigate the health risks associated with excessive sugar consumption [1]. Aspartame, a low-calorie artificial sweetener widely used in processed foods, beverages, and pharmaceuticals, has become a staple in modern diets due to its high sweetness and low metabolic burden [2]. However, mounting epidemiological and experimental evidence has raised concerns about its potential long-term health risks [3], particularly in relation to hepatocellular carcinoma (HCC) [4] – one of the most common and lethal malignancies worldwide with a complex pathogenesis [5]. Oxidative tension arises when reactive oxygen species (ROS) accumulation overwhelms the endogenous antioxidant defenses, fundamentally fueling the pathological evolution of HCC. Such redox instability is recognized as a key catalytic element in liver cancer development [6]. Through the modulation of particular signaling cascades and genomic expressions, it facilitates metabolic alterations, DNA impairment, and dysregulated cellular growth. Consequently, deciphering how aspartame exposure interacts with genes associated with oxidative stress (OS) becomes essential for unmasking the latent molecular ties between this additive and HCC development.
Previous studies have made valuable progress in exploring the link between artificial sweeteners and liver carcinogenesis. A recent study by Sun et al. [4] focused on glutathione reductase (GSR) as a key molecular target in HCC potentially associated with aspartame, revealing that GSR modulates tumor cell proliferation through glycolytic enzyme regulation and metabolic reprogramming [4]. Their research, combining network toxicology and Mendelian randomization, highlighted GSR’s potential as a prognostic biomarker and therapeutic target, providing important insights into the metabolic mechanisms potentially linking aspartame to liver cancer. Despite these advancements, significant research gaps remain. First, existing studies primarily focus on single molecular targets (e.g., GSR) rather than systematically analyzing the broader network of OS-related genes involved in aspartame-mediated HCC. Second, the lack of integration of machine learning techniques limits the ability to efficiently screen and prioritize core regulatory genes from complex omics data. Third, the binding specificity and interaction mechanisms between aspartame and multiple OS-related target proteins have not been comprehensively verified through molecular docking, leaving the direct molecular interactions underlying aspartame’s hepatocarcinogenic effects unclear.
The aim of this study is to address the aforementioned gaps by systematically investigating the potential molecular network linking aspartame to HCC mediated by OS genes. Specifically, the objectives are: (1) to identify differential expression profiles of HCC-related genes associated with aspartame exposure across multiple datasets; (2) to screen and prioritize core OS-related genes using integrated machine learning algorithms; (3) to verify the expression patterns of these core genes in HCC; and (4) to confirm the binding affinity between aspartame and the core target proteins through molecular docking simulations. Collectively, these efforts seek to elucidate potential key molecular associations between aspartame exposure and HCC progression via OS pathways.
In the context of widespread aspartame consumption and the rising global burden of HCC, this study holds important practical and public health significance. It responds to the urgent need to clarify the long-term safety of aspartame by focusing on its potential carcinogenic mechanisms, which can inform risk assessment and regulatory policies for artificial sweeteners [3]. Additionally, identifying core OS genes potentially associated with the aspartame-HCC axis provides novel targets for early diagnosis, prognostic evaluation, and targeted therapy of HCC, addressing unmet clinical needs.
Unlike previous single-target studies, it adopts a network-oriented approach to systematically analyze the entire set of OS-related genes, revealing the potential holistic molecular regulatory network linking aspartame to HCC. The study integrates multiple machine learning algorithms to prioritize core genes, enhancing the efficiency and accuracy of target screening compared to traditional bioinformatics methods. With the combination of network toxicology, differential expression analysis, and molecular docking achieves a comprehensive validation from gene expression patterns to protein–ligand binding interactions, providing more robust evidence for the potential associative link between aspartame and OS-mediated HCC.
Notably, given the current lack of public transcriptomic datasets for HCC stratified by aspartame exposure, this study adopts an exploratory associative framework. Our goal is to identify potential overlapping molecular targets between aspartame and HCC-related OS pathways, rather than to establish definitive causal links. The findings should be interpreted as hypothesis-generating, laying the groundwork for future studies with exposure-specific experimental designs.
We selected two HCC datasets: GSE36376 and GSE54236 functioned as the training set; three additional datasets – GSE14811, GSE25097, and GSE76427 – acted as the external validation set (Supplementary Figure S1). OS-responsive genes (n = 14,130) were gathered from GeneCards, followed by batch integration using the “sva”(v.3.5.0) “ComBat” method [7]. The comparative impact of this batch-correction step was scrutinized via principal component analysis (PCA), ensuring consistency in data quality across the integrated cohorts.
To identify the chemical attributes and associated targets of aspartame, we performed a multi-source data integration. While PubMed was consulted for biological parameters and physicochemical properties, the standard 2D molecular descriptors were sourced from PubChem. Our target identification involved a triple-approach: exploring ligand–receptor profiles via ChEMBL, utilizing SwissTargetPrediction for chemical genomics-based forecasting, and employing PharmMapper for 3D pharmacophore alignment. The scope of all identified targets was restricted to the human proteome.
The significance thresholds for DEG screening (|log2FC| > 0.585 and P-value < 0.05) were selected based on two key considerations: (1) Biological relevance: A |log2FC| threshold of 0.585 corresponds to a 1.5-fold change in gene expression, a widely accepted cutoff in transcriptomic studies that balances sensitivity (capturing biologically meaningful expression alterations) and specificity (reducing false positives from trivial changes). (2) Statistical rigor: Given the high dimensionality of transcriptomic data, we applied the Benjamini-Hochberg multiple testing correction procedure to control the false discovery rate at <0.05. This correction was prioritized over Bonferroni correction to avoid excessive stringency that could miss potentially important DEGs, which is consistent with standard practices in omics analyses [8,9,10].The intersection of the two DEG sets was subsequently retrieved and illustrated with a Venn diagram. To investigate the relationships between the acquired shared genes, a protein–protein interaction (PPI) network was built with Cytoscape (https://cytoscape.org/).
We utilized the “clusterProfiler” package and associated R dependencies (“ggplot2,” “enrichplot,” and “org.Hs.eg.db”) to run Gene Ontology (GO) and Kyoto Encyclopedia of Genes and Genomes (KEGG) enrichment for the identified hub genes. This analysis aimed to map their potential biological pathways and mechanistic roles. A p-value cut-off below 0.05 was implemented to define the statistical significance of the enrichment results.
Key parameters in weighted gene co-expression network analysis (WGCNA) were selected based on field standards and dataset-specific characteristics: (1) Soft thresholding power (β = 10): This value was chosen because it satisfied the scale-free topology criterion (R2 = 0.9), a fundamental requirement for WGCNA to ensure that the constructed network follows biological network properties (sparse connectivity with hub genes). A β value of 10 was optimal for our merged HCC dataset (GSE36376 + GSE54236), as lower β values (<8) failed to meet the scale-free R 2 threshold, while higher β values (>12) led to excessive network sparsity and loss of meaningful co-expression relationships. (2) minModuleSize = 30: This parameter was set to balance module granularity and statistical power – modules with <30 genes are often too small to capture robust co-expression patterns, while larger modules (>50 genes) may aggregate functionally distinct gene clusters. (3) mergeCutHeight = 0.25: This cutoff corresponds to a correlation coefficient of 0.75 between module eigengenes, ensuring that highly similar modules are merged to avoid redundancy, which is consistent with recommendations for HCC transcriptomic data with moderate heterogeneity.
To pinpoint the central targets linking aspartame to HCC, we executed a cross-comparison among four distinct gene sets: aspartame-predicted molecules, WGCNA-derived hub markers, DEGs, and OS-related targets. The resulting overlapping candidates were illustrated through Venn diagrams to highlight their commonalities.
To map the potential pathways involved in the aspartame-HCC axis, GO (biological process [BP], cellular components [CC], and molecular functions [MF]) and KEGG enrichment were executed via the R package “clusterProfiler” (version 4.12.6). Meaningful biological insights were defined by an enrichment significance of p < 0.05, focusing on the essential roles of the identified hub proteins.
Prior to diagnostic model construction, raw transcriptomic data underwent standardized preprocessing. Missing entries and outlying data points were removed to ensure dataset reliability, and Z-score normalization was applied to rescale all features to a mean of 0 and standard deviation of 1, removing distortions caused by inconsistent feature scales. Two HCC datasets (GSE36376 and GSE54236) were assigned as the training cohort, and three independent datasets (GSE14811, GSE25097, and GSE76427) were utilized as an external validation panel. Twelve machine learning approaches were adopted for predictive modeling, classified by core computational logic: linear frameworks (Lasso, Ridge, Elastic Net, LDA), generalized linear regression tools (Stepglm, glmBoost, plsRglm), ensemble tree-based learners (Random Forest, gradient boosting machine (GBM), extreme gradient boosting (XGBoost)), and classic classification algorithms (support vector machine (SVM), NaiveBayes). Key hyperparameters for core algorithms were optimized via cross-validation, including Elastic Net (λ = 0.1), Ridge (λ = 1.0), SVM (C = 1.0, γ = 0.01), GBM (learning rate = 0.1, 100 trees), and XGBoost (learning rate = 0.01, 150 trees). A total of 113 algorithm combinations were evaluated on the training cohort through tenfold cross-validation for feature screening and model building. Model performance was measured using area under the receiver operating characteristic (ROC) curve (AUC), accuracy, and F1-score; AUC values were calculated with the “RunEval” function, and performance comparisons were visualized via heatmaps from the “SimpleHeatmap” tool. A stacking ensemble strategy was used to integrate predictions from top individual models (AUC > 0.9), and candidate core genes were determined by ranking feature occurrence frequencies across these high-performance models. Calibration curves were generated to assess the predictive accuracy of the diagnostic model, while gene expression profiles were illustrated using the “pheatmap” R package (version 1.0.13).
To enhance the interpretability of our model, the SHapley Additive exPlanations (SHAP) method was employed to assess feature importance. Individual SHAP values were calculated to determine how each variable influences the final predictions, providing a clear visualization of their specific impact on the overall predictive accuracy.
To confirm the binding potential between aspartame and pivotal OS-related genes, we performed computational docking simulations. The 3D protein architectures were retrieved from the UniProt database, while the corresponding ligand structure in SDF format was sourced from PubChem. Pre-docking preparation for the proteins included the elimination of water molecules and the incorporation of polar hydrogen atoms; simultaneously, the ligand underwent energy minimization and geometry optimization. We defined the docking grid boxes around the anticipated catalytic pockets, with grid parameters adjusted to accommodate the ligand’s spatial dimensions and predicted orientation. All binding assays were executed using the AutoDock Vina engine.
To identify the biological targets of aspartame, we conducted a systematic prediction using a triad of specialized platforms: SwissTargetPrediction, PharmMapper, and ChEMBL. Following the merging of these diverse datasets and the elimination of duplicate records, a final set of 309 distinct candidate targets was established.
The training cohorts (GSE36376 and GSE54236) were integrated, followed by rigorous normalization to mitigate batch-related variances across gene expression matrices. Post-processing PCA demonstrated an optimized data distribution, characterized by more homogenous and well-defined clusters (Figure 1a). Our differential expression profiling identified 1,893 transcripts with significant variance in HCC, comprising 1,350 overexpressed and 543 underexpressed genes. These findings were graphically represented through volcano plots and heatmaps (Figure 1b and c).
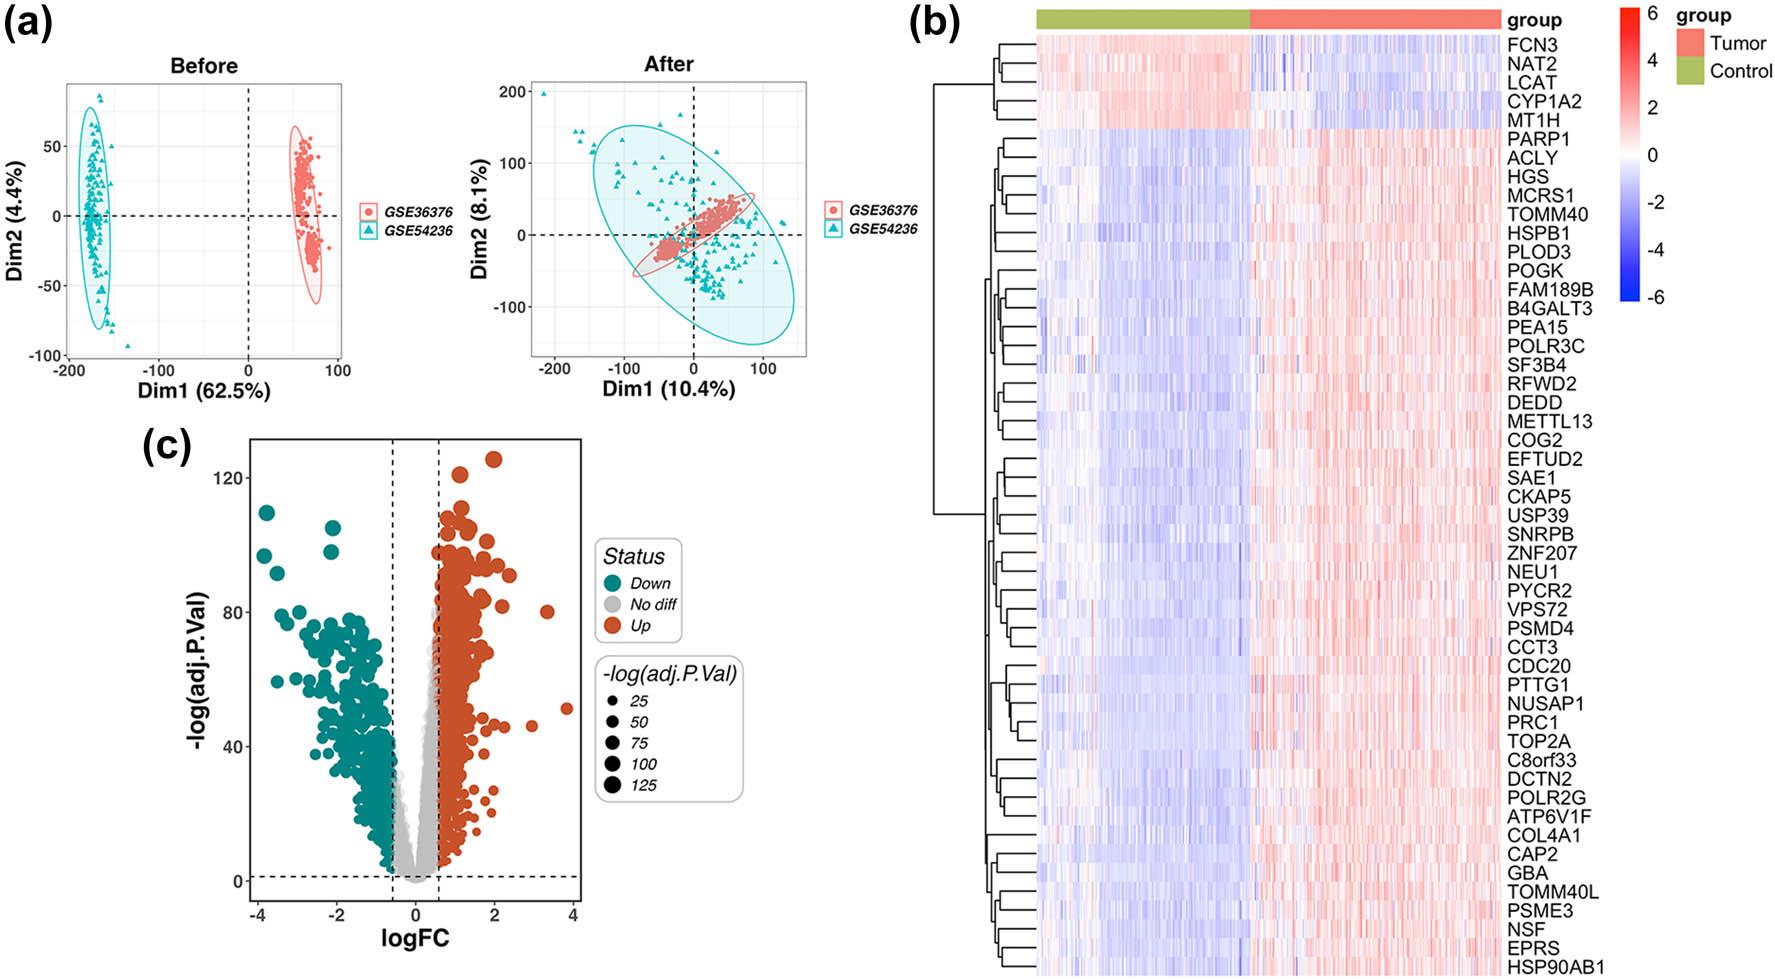
Identification of HCC-associated target genes. (a) Prior to batch correction, the PCA scatter plot shows distinct separation of the two datasets (GSE36376 and GSE54236), indicating the existence of batch effects. After batch correction, the PCA scatter plot demonstrates effective integration of the datasets, with marked reduction in batch effects as shown. (b) A heatmap displays the expression profiles of DEGs across all included samples. Downregulated genes are indicated in blue, while upregulated genes are highlighted in red. (c) A volcano plot categorizes DEGs based on log fold change (logFC) and statistical significance (|log2FC| > 0.585 and p-value < 0.05). Brown dots represent upregulated genes, green dots denote downregulated genes, and gray dots correspond to genes with no significant expression alterations. Abbreviations: HCC: hepatocellular carcinoma; PCA: principal component analysis; DEGs: differentially expressed genes
A co-expression network was generated using a soft-thresholding power of 10, ensuring the scale-free nature of the system (R 2 = 0.9, Figure 2a–c). WGCNA categorized the genes into ten modules, among which the turquoise and black modules were most significantly correlated with HCC status. Specifically, the turquoise module showed a positive coefficient of 0.81, while the black module showed a negative coefficient of –0.65 (both p < 0.05; Figure 2d). These findings highlight the modules’ pivotal roles in HCC-related molecular mechanisms.
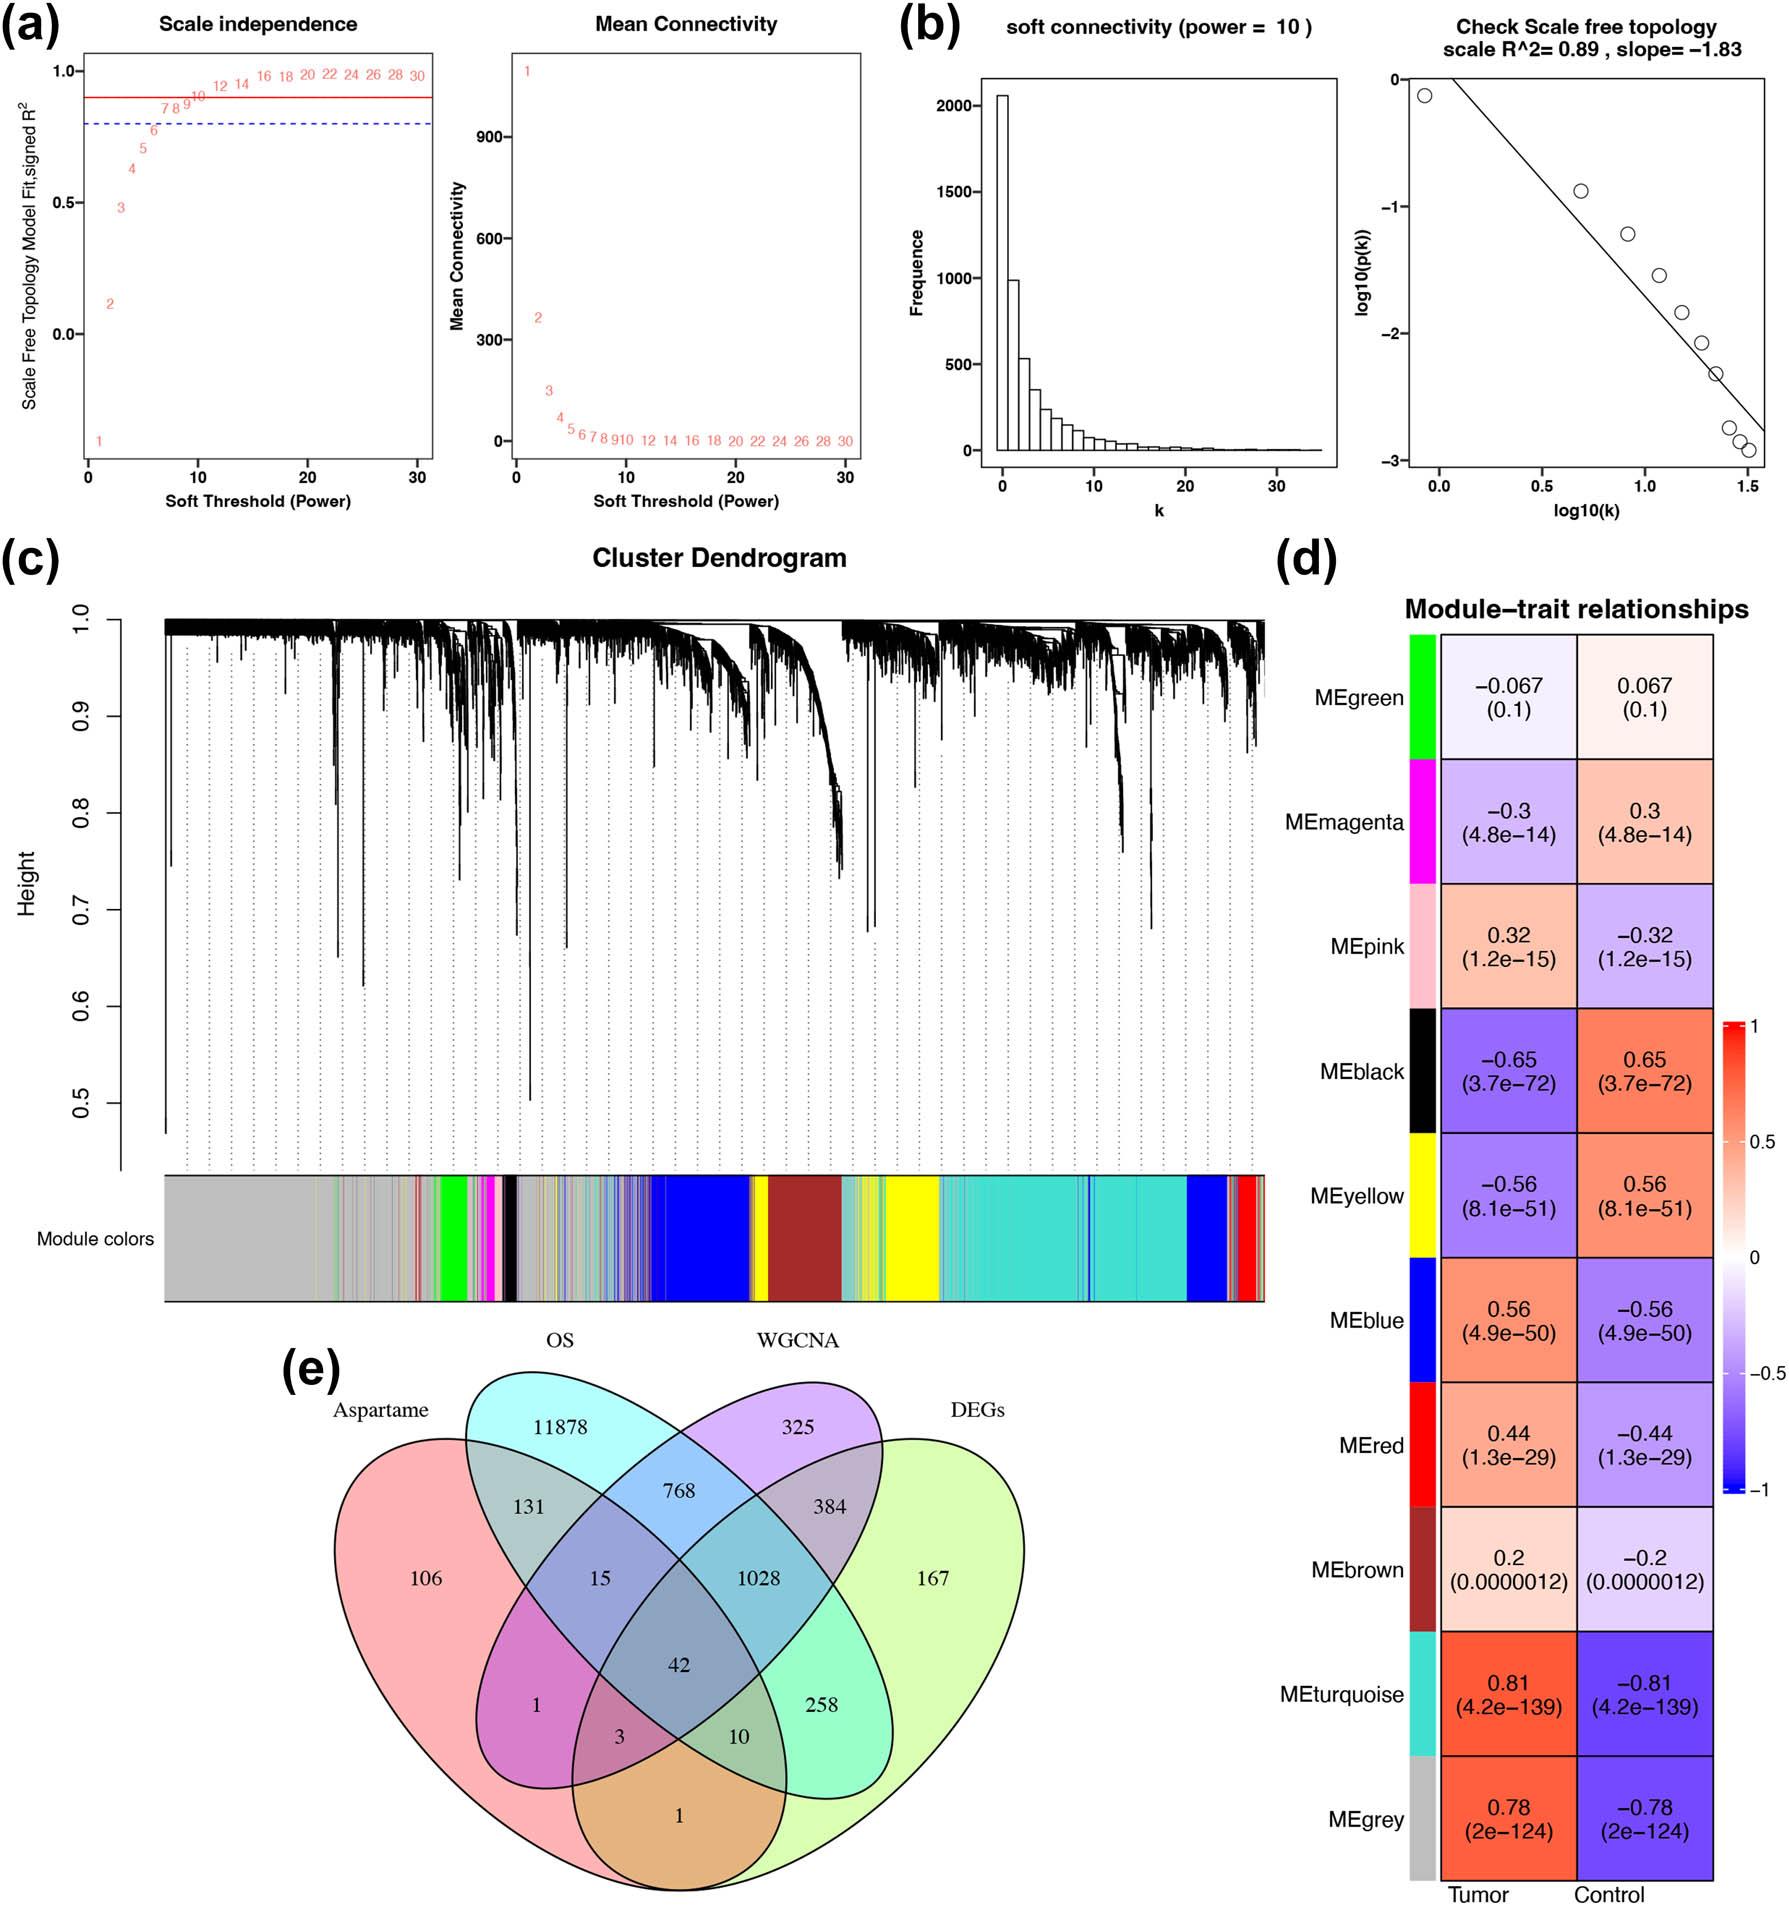
Construction of WGCNA and identification of overlapping genes. (a) Determination of the optimal soft-threshold power. Horizontal lines, arranged from top to bottom, correspond to R 2 values of 0.9 and 0.8, respectively. (b) Soft connectivity (power = 10) and verification of scale-free topology (R 2 = 0.89, slope = –1.83). (c) A gene dendrogram generated via WGCNA illustrates hierarchical clustering based on co-expression relationships. Different gene modules are represented by distinct colors in the lower section of the dendrogram. (d) A module-trait relationship heatmap exhibits correlations between WGCNA-identified modules and sample traits (Control group vs Tumor group). Correlation coefficients and P-values are displayed within each box. (e) Venn diagrams illustrate the overlapping genes among in silico predicted aspartame targets, OSOS-related genes, WGCNA module genes, and DEGs. Abbreviations: WGCNA: weighted gene co-expression network analysis; OS: oxidative stress; DEGs: differentially expressed genes
To refine our focus, we synthesized the genes within functional WGCNA modules, and the differentially expressed transcripts were identified via standard analysis. After the removal of redundant entries, 2,566 HCC-associated candidate genes were retained (Figure 2e). A subsequent cross-comparison among these disease-specific markers, aspartame’s predicted targets, and OS-responsive genes revealed 42 overlapping molecules. These genes likely represent the primary interactive nodes within the aspartame-HCC axis (Figure 2e).
To map the interactive landscape of the 42 candidate targets linked to aspartame-mediated HCC, we utilized Cytoscape (v3.10.1) to generate a PPI network (Figure 3a). Functional insights were further expanded through GO and KEGG pathway profiling. BP results highlighted an enrichment in the metabolism of sulfur compounds and ribose phosphates, as well as the catabolism of organic acids, carboxylic acids, and small molecules (Figure 3b).
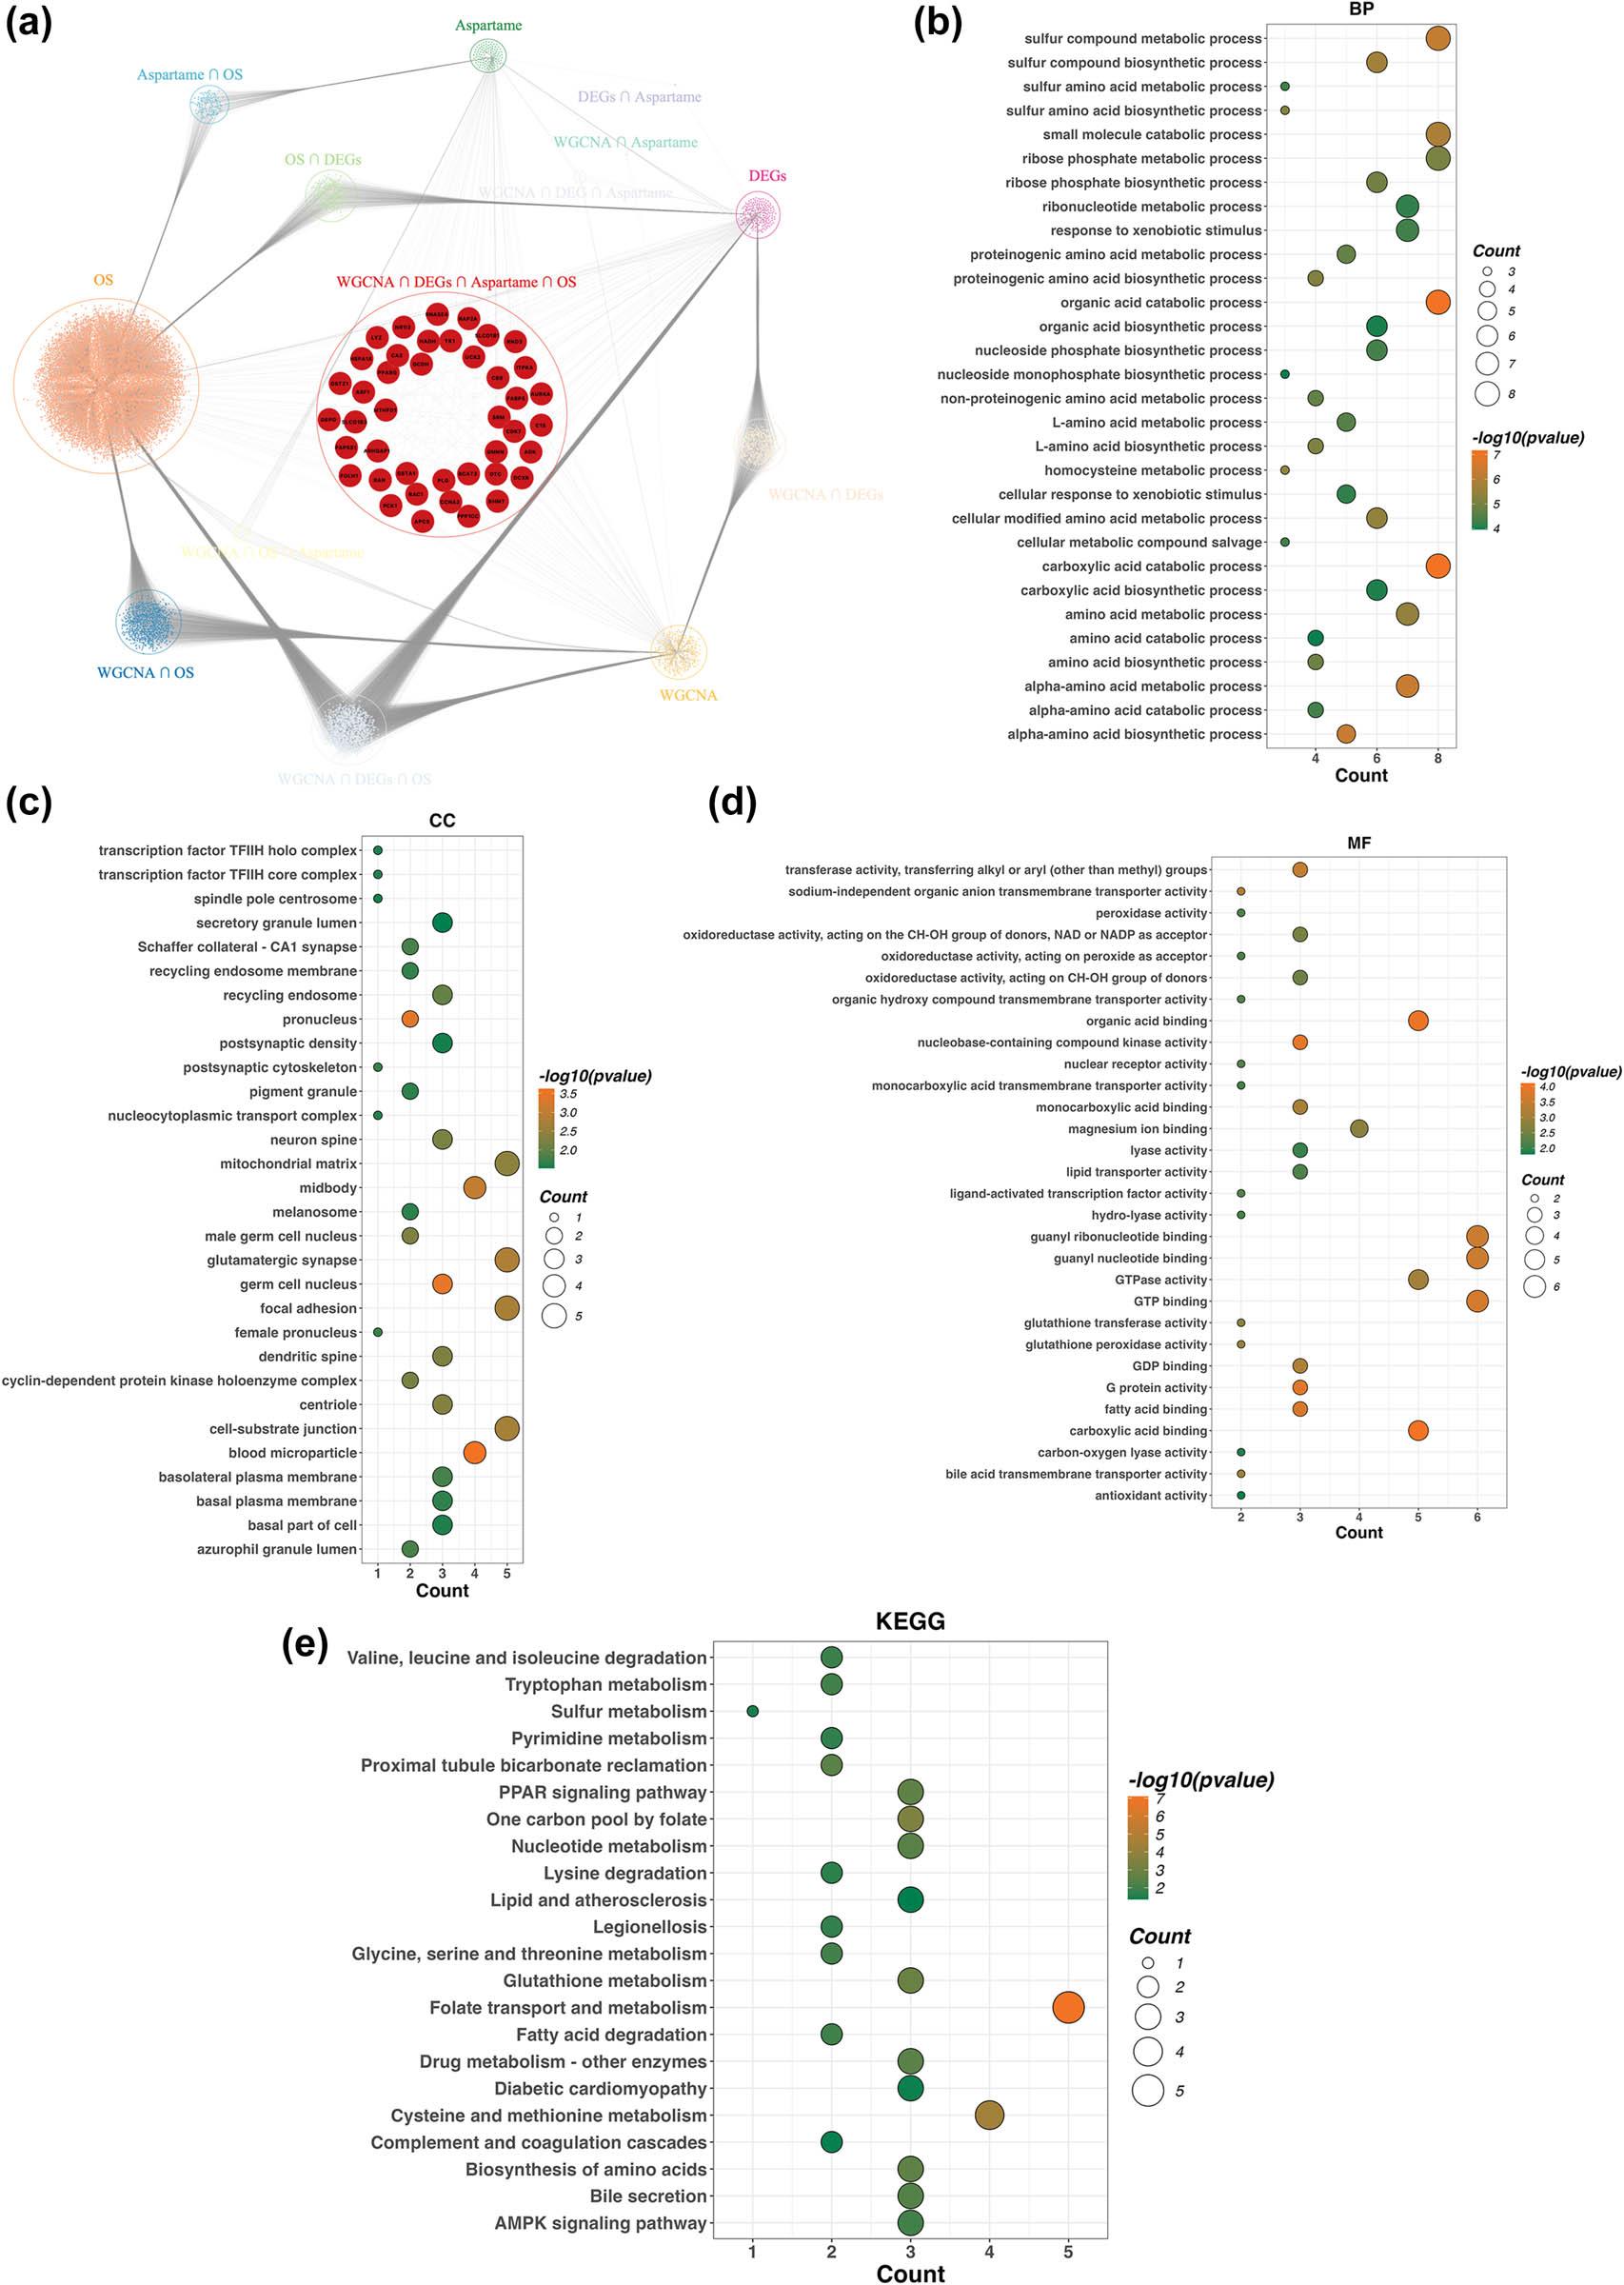
PPI networks and functional enrichment analysis. (a) PPI network encompassing genes overlapping with in silico predicted aspartame targets, DEGs, OS-related genes, and WGCNA-derived module genes. The central network visualizes interaction relationships among these overlapping genes. GO enrichment analysis annotates the overlapping genes in terms of (b) BP, (c) CC, and (d) MF. For these plots, the x-axis denotes gene count, and the color gradient correlates with adjusted P-values (darker red reflects greater statistical significance). (e) KEGG pathway analysis identifies enriched pathways associated with the overlapping genes. In this plot, the x-axis represents gene ratio, dot size corresponds to gene count, and the color gradient reflects adjusted p-values < 0.05. Abbreviations: PPI: Protein–protein interaction; GO: Gene Ontology; BP: biological processes; CC: cellular components; MF: molecular functions; KEGG: Kyoto Encyclopedia of Genes and Genomes
CC analysis revealed that these targets primarily localize to the mitochondrial matrix, focal adhesions, and cell-substrate junctions, with additional presence in the midbody and germ cell nucleus (Figure 3c). Regarding MF, the genes were predominantly associated with guanosine triphosphate binding, GTPase activity, and the binding of organic or carboxylic acids (Figure 3d). Furthermore, KEGG enrichment underscored their participation in cysteine and methionine metabolism, alongside folate transport (Figure 3e).
Model performance evaluation was conducted in the training dataset and three external validation datasets (GSE14811, GSE25097, and GSE76427) (Figure 4a). The final model with optimal performance was established by integrating the Stepglm[both] + SVMlinear algorithms, which identified four pivotal genes: RND3, glutathione S-transferase zeta 1 (GSTZ1), aurora kinase A (AURKA), and ADP-ribosylation factor 1 (ARF1). Notably, our model exhibited enhanced diagnostic performance across all training and external validation cohorts (Figure 4b–i). Our results indicated that ARF1 and AURKA were significantly upregulated, while GSTZ1 and RND3 were notably downregulated (p < 0.001) (Figure 4j–m).
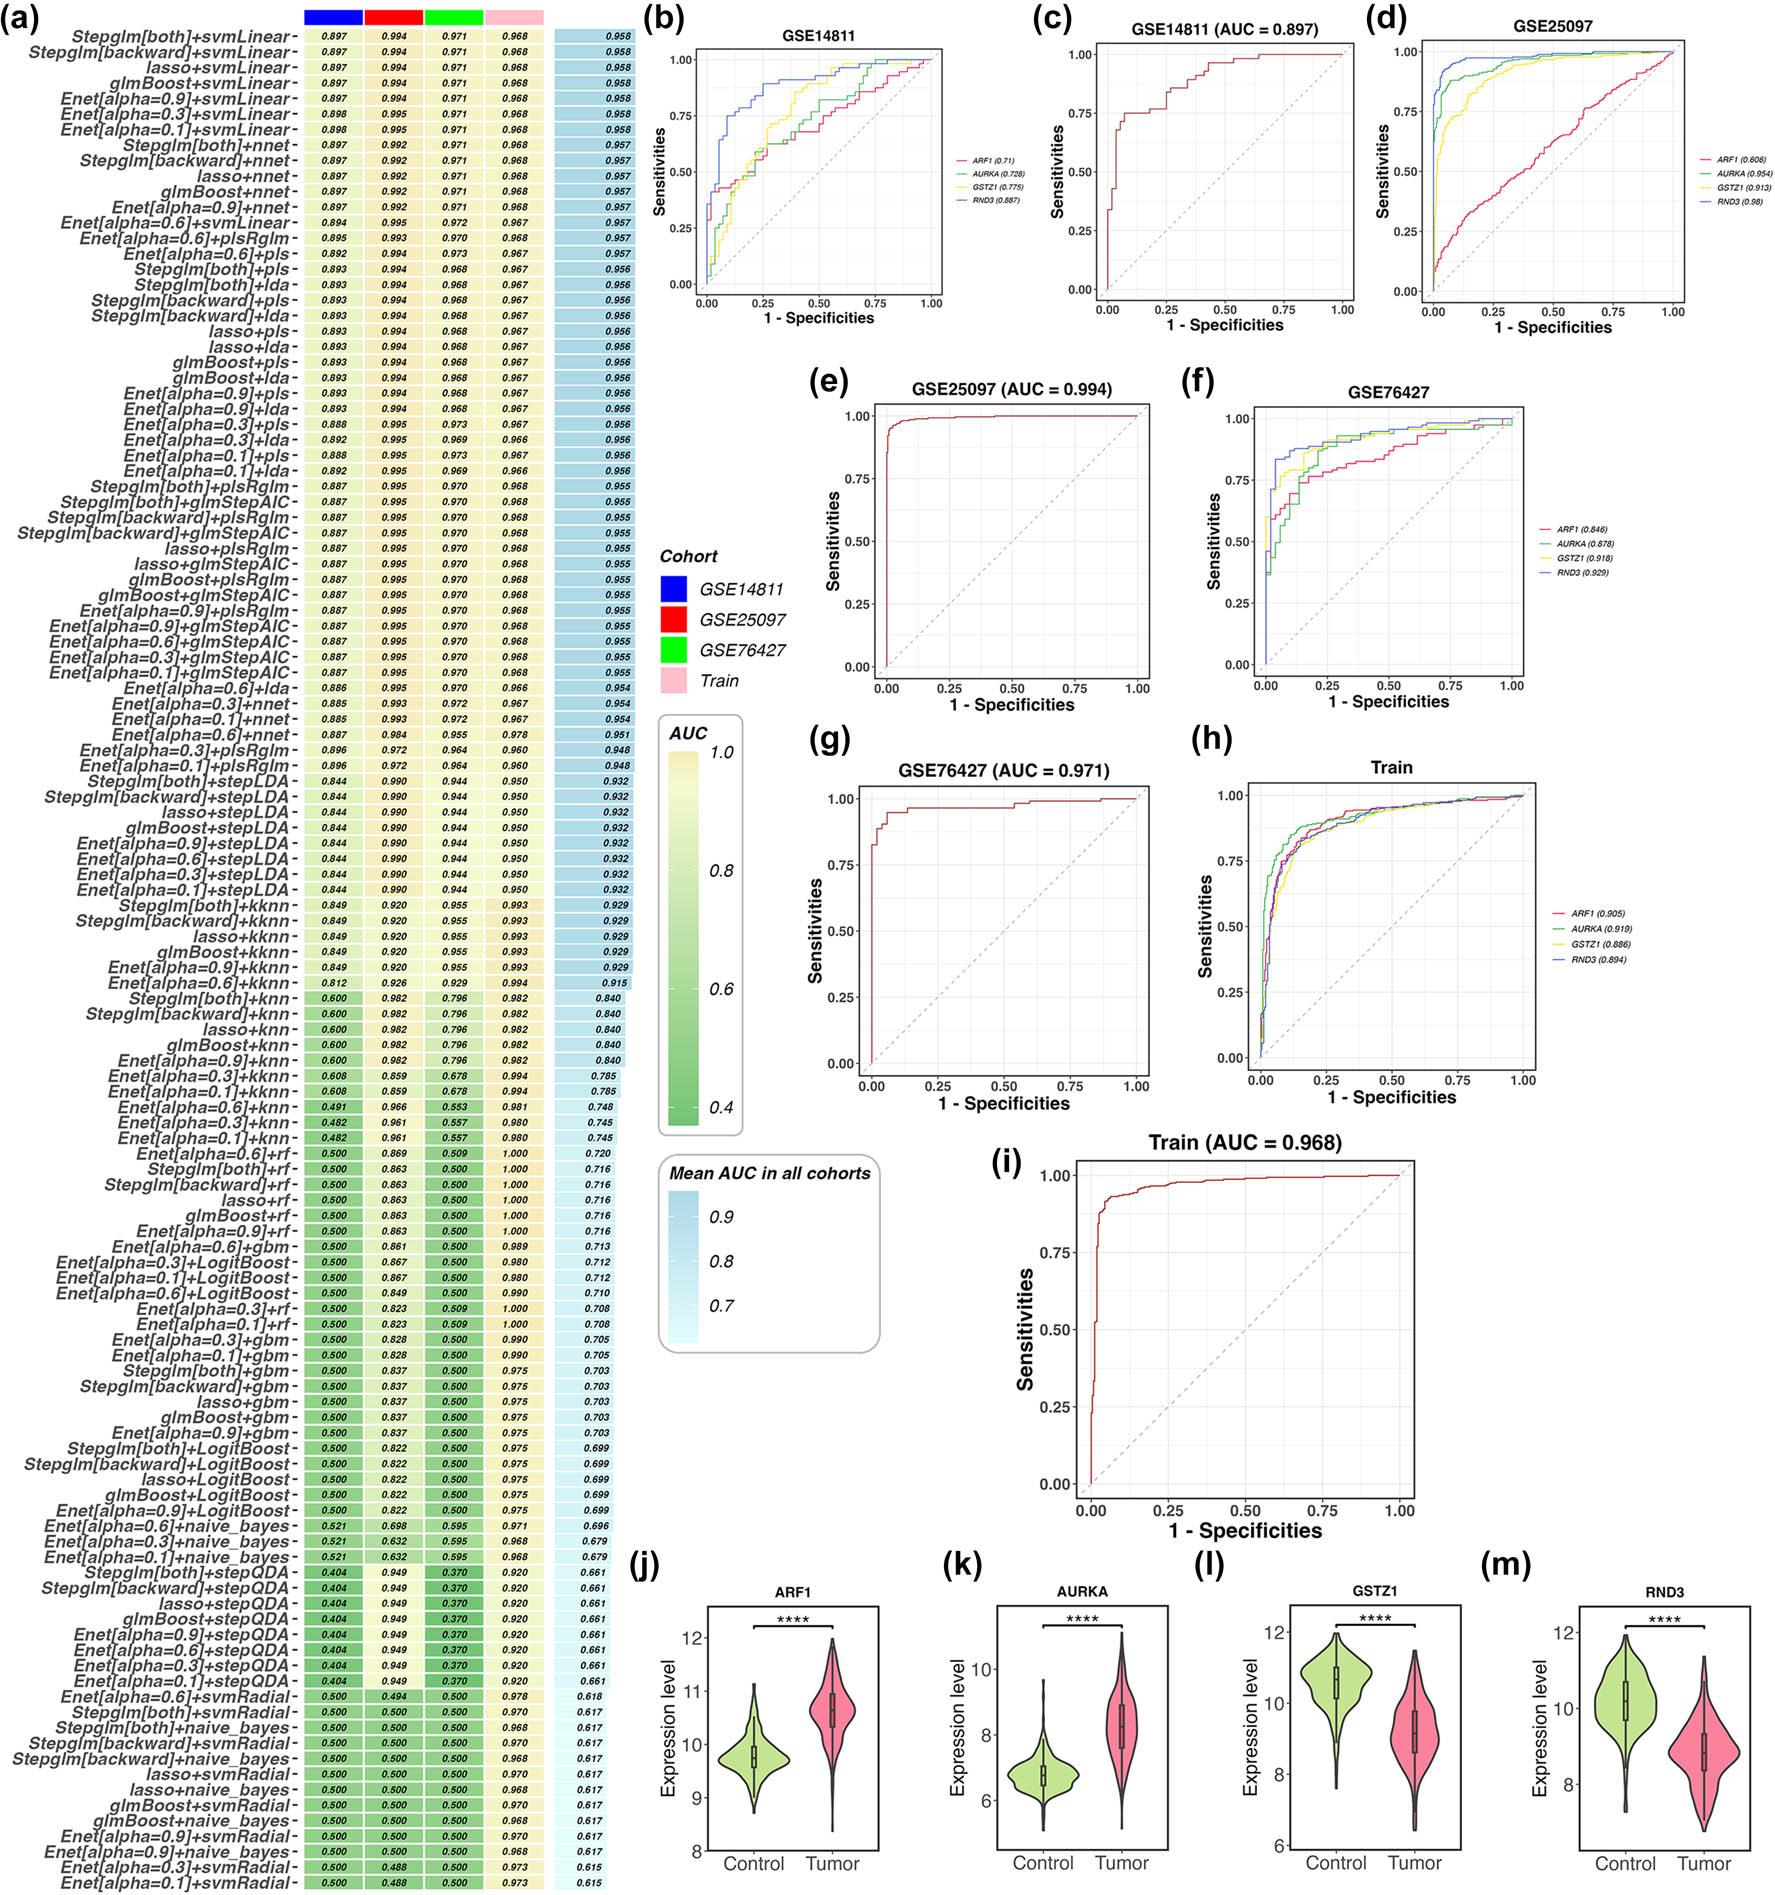
Identification of core genes associated with HCC status overlapping with in silico predicted aspartame targets. (a) Comparison of model performance: A heatmap displays AUC values of distinct models across multiple cohorts. The left column lists the models, while the right column presents AUC values (higher values indicate superior performance). Cohort sources are distinguished by different colors. (b–i) ROC curves: ROC curves for the core genes are shown for three external validation datasets (GSE14811, GSE25097, and GSE76427) and the training dataset. For these curves, the x-axis represents false positive rate, and the y-axis denotes sensitivity. Predictive capability is assessed via AUC values. (j–m) Expression levels of the four core genes in the external validation datasets. ****, p < 0.0001. Abbreviations: AUC: Area under the receiver operating characteristic curve; ROC: Receiver operating characteristic
SHAP interpretable analysis quantified the predictive contribution of each feature to the diagnostic model. AURKA (SHAP value = 0.148) and RND3 (SHAP value = 0.134) emerged as the top two influential variables for model prediction (Figure 5a), and AURKA exhibited a bidirectional pattern of predictive contribution in the model (Figure 5b). Two key statistical correlations were observed: (1) The expression levels of RND3 and GSTZ1 were positively correlated with their respective SHAP values, while the expression levels of AURKA and ARF1 were negatively correlated with their SHAP values; (2) RND3 and GSTZ1 showed the maximal predictive contribution to the model at high expression levels (>10) (Figure 5c–f). Force-directed analysis further indicated that AURKA (expression = 8.45, Δ = −0.136) and ARF1 (expression = 10.9, Δ = −0.112) served as major negative contributors to model prediction, pushing the model’s predictive values (f(x) = −0.297) below the baseline expectation (E[f(x)] = 0) (Figure 5g). These patterns reflect statistical properties of the predictive model, not definitive biological regulatory functions.

Model interpretation via SHAP analysis. (a) Ranking of feature importance: A bar chart ranks the top genes according to their statistical feature importance for HCC prediction. Larger bar heights correspond to greater contributions to the predictive model. (b) Violin plot: A violin plot depicts the distribution of gene expression across distinct experimental conditions. Plot width represents data density, and colors indicate expression levels. (c–f) Distribution of SHAP values: Scatter plots display SHAP values for the core genes, reflecting their statistical impacts on model predictions for HCC status. (g) SHAP summary plot: A SHAP summary plot exhibits the statistical contribution of each core gene to model predictions for HCC status. Negative SHAP values indicate a reduction in predictive probability, while positive values indicate an elevation in predictive probability. Abbreviations: SHAP: SHapley Additive exPlanations
To validate the docking potential of aspartame with the prioritized core proteins, we conducted exhaustive molecular docking simulations. The results indicated robust binding affinities for the target proteins (AURKA, ARF1, and GSTZ1), with binding free energies consistently falling between −5.0 and −7.1 kcal/mol, suggesting that these molecular interactions occur spontaneously and stably. According to established computational docking benchmarks, a binding energy below 0 kcal/mol signifies spontaneous association, while values lower than −5.0 kcal/mol represent high-strength affinity. Structural visualization (Figure 6a–c) confirmed the stable configurations of these aspartame–protein complexes, offering tangible evidence of direct interactions between the sweetener and the OS-related HCC targets. Notably, the aspartame–ARF1 complex displayed the most extensive interaction network with five distinct binding sites and an energy of −5.6 kcal/mol (Figure 6a). Additionally, GSTZ1 exhibited a binding energy of −7.1 kcal/mol, characterized by close contact with four specific amino acid residues (Figure 6c).
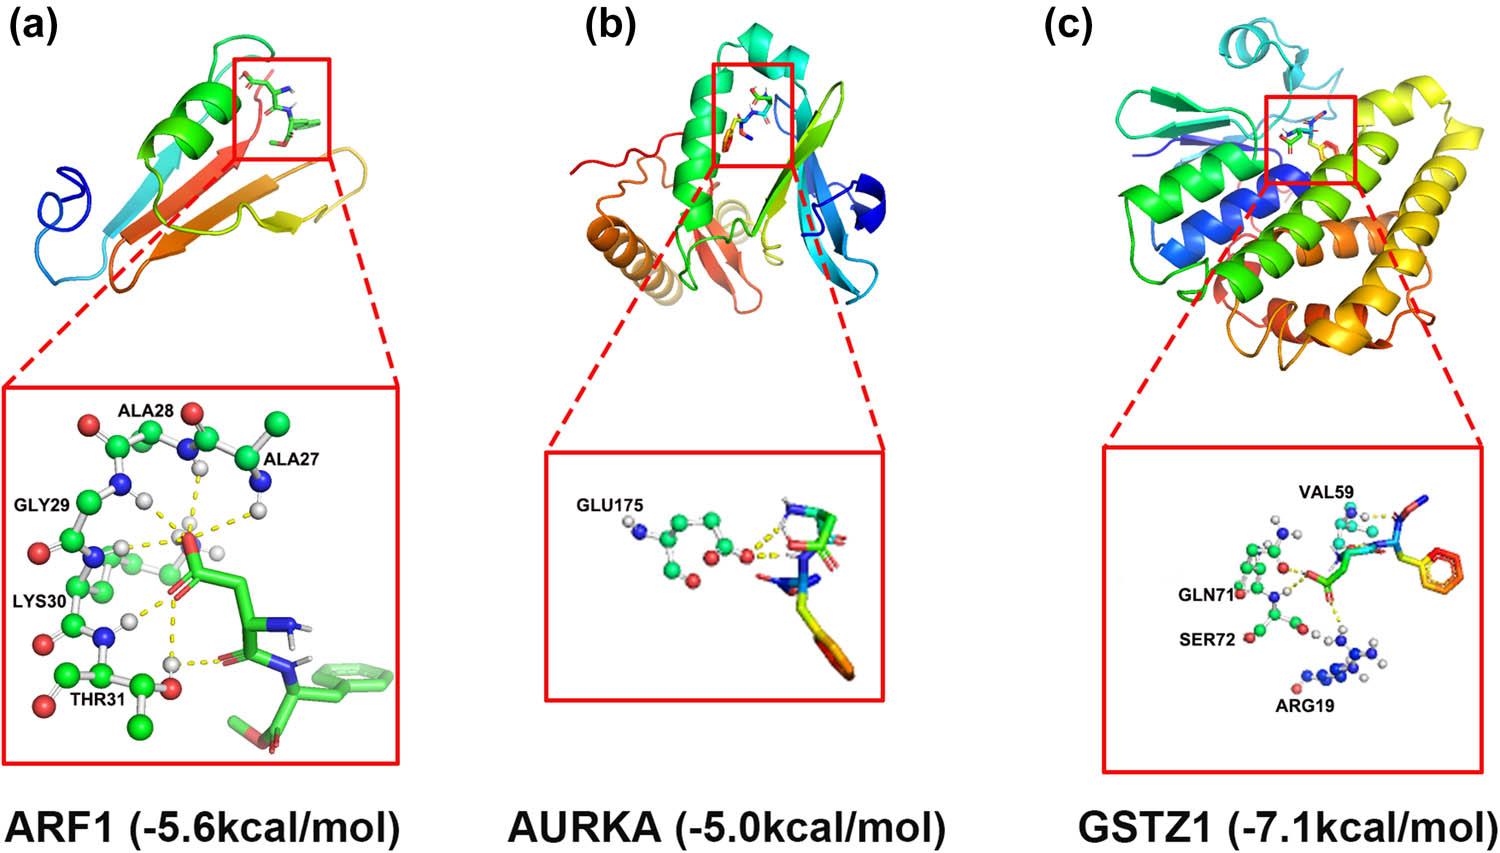
In silico molecular docking prediction of the binding potential between aspartame and core genes. Molecular docking results (binding energy < –5.0 kcal/mol) for the binding potential between aspartame and (a) ARF1 (–5.6 kcal/mol), (b) AURKA (–5.0 kcal/mol), and (c) GSTZ1 (–7.1 kcal/mol). Abbreviations: ARF1: ADP-ribosylation factor 1; AURKA: aurora kinase A; GSTZ1: glutathione S-transferase zeta 1
This study systematically investigated the potential molecular network linking aspartame to HCC by integrating multi-omics analysis, machine learning, and molecular docking techniques, with a focus on the mediating role of OS-related genes. By mining public HCC datasets, predicting aspartame targets, and constructing WGCNA, we initially identified 42 potential key targets associated with hepatocarcinogenesis potentially associated with aspartame. Through a stacking ensemble learning framework incorporating 12 machine learning algorithms, 4 core OS-related genes were prioritized, and their differential expression patterns were validated across training and external cohorts. SHAP analysis further quantified the predictive contributions of these core genes to the diagnostic model, while molecular docking confirmed robust binding affinities between aspartame and ARF1, AURKA, and GSTZ1. Collectively, these findings establish a potential direct molecular association between aspartame exposure, OS dysregulation, and HCC progression, and provide novel diagnostic and therapeutic targets for this malignancy.
Our results were consistent with accumulating evidence linking artificial sweeteners to liver carcinogenesis and highlighting the critical role of OS in this process. A recent study identified GSR as a key target in HCC potentially associated with aspartame, emphasizing metabolic reprogramming as a core mechanism [4]. While the study focused on a single molecular target, our work extends this by adopting a network-oriented approach, revealing a cohort of OS-related genes rather than an isolated target – supporting the notion that carcinogenesis is driven by complex molecular networks rather than individual proteins [11]. Another similar study identified CASP1 as a potential target for liver cancer potentially linked to aspartame [12]. Beyond confirming aspartame’s link to liver cancer, the Ramazzini Institute’s research emphasized that prenatal exposure amplifies carcinogenic risk [13], a finding consistent with our model showing core genes exert context-dependent regulatory effects that may be particularly impactful during developmental stages. This convergence underscores the importance of our OS-mediated pathway [14] in explaining the potential long-term hepatotoxicity associated with aspartame [15].
Our identification of OS as a mediating pathway aligns with these observations, as aspartame metabolism has been shown to be potentially associated with ROS production by disrupting mitochondrial function and antioxidant defense systems [16]. The differential expression patterns of our core genes were also consistent with their known roles in HCC. AURKA, a serine/threonine kinase involved in cell cycle regulation, is frequently amplified and overexpressed in HCC [17], where it promotes proliferation and metastasis by activating PI3K/Akt [18,19] and MAPK [20] pathways. Wu et al. further validated the intimate link between AURKA and OS in carcinogenesis, showing that serum AURKA levels were significantly elevated in patients alongside OS markers and that their combination yielded a robust diagnostic nomogram [21]. ARF1, a small GTPase regulating vesicular trafficking, has been implicated in tumor metabolic reprogramming [22], with its overexpression correlating with poor prognosis in HCC patients [23]. A study by Jiang et al. identified ARF1 as a key oncogenic driver in HCC, showing that targeted inhibition of Arf1 with Brefeldin A derivatives potently suppressed cell proliferation and induced apoptosis by elevating intracellular ROS levels [24]. This aligns with our finding that ARF1 was significantly upregulated in HCC potentially associated with aspartame and functions as a core OS-related target – suggesting that potential binding of aspartame to ARF1 may disrupt its normal role in ROS homeostasis, leading to unregulated ROS accumulation and subsequent hepatocarcinogenesis.
In contrast, GSTZ1, a critical tumor-suppressive role in HCC and the oncogenic consequences of its downregulation were strongly supported by mechanistic studies: Zhan demonstrated that UHRF1, a key epigenetic regulator, directly downregulates GSTZ1 via DNA methylation modification, which in turn inhibits ferroptosis, disrupts redox balance (dysregulated GSH/GSSG and NADP +/NADPH ratios), and induces lipid peroxidation in HuH7 and HepG2 hepatoma cells [25]. This aligns with our finding that GSTZ1 is significantly downregulated in HCC potentially associated with aspartame and functions as a core OS-related target – suggesting that aspartame may potentially synergize with epigenetic silencing to amplify GSTZ1 suppression, thereby promoting HCC progression through impaired ferroptosis and exacerbated OS [26,27]. Meanwhile, recent studies by Li et al. demonstrated that RND3 low expression correlates with elevated OS, while RND3 overexpression suppresses OS via upregulating activating the NRF2/NQO-1/HO-1 antioxidant pathway [28]. Therefore, the inverse relationship between RND3 downregulation and enhanced OS was well-established in chronic inflammatory diseases, and our findings extend this mechanistic link to HCC. This aligns with our observation that RND3 is significantly downregulated in HCC potentially associated with aspartame – suggesting that potential aspartame-related RND3 suppression may disrupt the antioxidant pathway, leading to unmitigated OS and promoting hepatocarcinogenesis. Our findings extend these prior observations by demonstrating that these genes are potential direct targets of aspartame, providing a mechanistic explanation for their dysregulation in aspartame-induced HCC.
Notably, our integration of machine learning algorithms for core gene screening is consistent with the growing application of artificial intelligence in precision oncology. Ji et al. showed that stacking ensemble models outperform single algorithms in identifying cancer-related genes from complex omics data [29], as they mitigate bias and enhance predictive stability – findings mirrored in our use of 113 algorithm combinations and tenfold cross-validation. Similarly, SHAP analysis has emerged as a powerful tool for interpreting black-box machine learning models in biomedical research [30], and our use of this approach to quantify gene contributions aligns with recent efforts to improve the interpretability of artificial intelligence-driven discoveries [31].
Several unexpected observations emerged from this study, providing new insights into aspartame-induced HCC. First, SHAP analysis showed that AURKA displayed a bidirectional pattern of predictive contribution to the diagnostic model. This statistical pattern may be hypothesized to reflect context-dependent biological signaling of AURKA in cancers [18], as AURKA exerts multifaceted roles in tumor biology, and its net biological effect may depend on the expression levels of co-regulators [32]. This finding highlights the complexity of AURKA’s biological function in HCC, and we hypothesize that targeting AURKA may require personalized strategies based on co-regulator expression (this hypothesis requires experimental validation).
Second, we observed that RND3 and GSTZ1 exhibited maximal predictive contribution to the model at high expression levels (>10), whereas AURKA and ARF1 showed negative correlations between expression and SHAP values. This statistical pattern was observed because tumor suppressors including RND3 and GSTZ1 are typically downregulated in HCC, while their high expression correlated with heightened model-predicted HCC risk. We hypothesize that this pattern may reflect a compensatory biological response: aspartame-related ROS accumulation may initially upregulate RND3 and GSTZ1 to mitigate oxidative damage, while sustained exposure may overwhelm this protective mechanism and lead to their downregulation with tumor progression. This “compensatory-upregulation-then-suppression” framework is a biological hypothesis derived from model interpretability, not a confirmed mechanism.
Third, molecular docking revealed that GSTZ1 exhibits the highest binding affinity with aspartame despite being a tumor suppressor. Our finding suggests that aspartame may directly inhibit tumor suppressors by binding to their active sites. GSTZ1’s active site is critical for its glutathione-conjugating activity, and aspartame binding may block this function, impairing ROS detoxification. This provides a novel potential mechanism by which aspartame may be associated with HCC progression – direct inhibition of antioxidant enzymes – and underscores the importance of targeting both oncogenes and tumor suppressors in understanding its carcinogenic effects.
This study makes several key theoretical contributions to the field of environmental toxicology and oncology. First, it establishes a comprehensive molecular network potentially linking aspartame exposure to HCC via OS, addressing the critical gap in single-target studies by revealing the potential holistic regulatory landscape linking aspartame to hepatocarcinogenesis. This network perspective is essential for understanding complex diseases like cancer, where multiple genes and pathways interact synergistically. Second, the integration of network toxicology, machine learning, and molecular docking provides a paradigm for investigating environmental carcinogens. Our multi-faceted approach combines the efficiency of computational biology with the rigor of structural validation, offering a scalable model for identifying molecular targets of environmental toxins.
Third, our findings expand the understanding of OS in HCC by demonstrating that aspartame directly targets both oncogenic and tumor-suppressive genes in this pathway. Prior work has focused on ROS-induced DNA damage as the primary mechanism [33], but our results suggest that direct protein–ligand interactions may also potentially disrupt OS balance – opening new avenues for studying environmental toxin-induced carcinogenesis.
Our findings offer actionable practical implications for stakeholders in the food and pharmaceutical industries that widely use aspartame as a low-calorie sweetener. The four core OS-related genes identified can serve as novel molecular biomarkers for in vitro safety assessment of aspartame-containing products, allowing manufacturers to integrate hepatic OS toxicity screening into pre-market quality evaluation. The strong binding affinity between aspartame and key antioxidant/tumor-suppressive proteins, especially GSTZ1, underscores the necessity of rational dosage control in formulations to minimize disruption to hepatic redox homeostasis. Moreover, our results support improved product labeling transparency and post-market monitoring of aspartame intake to guide consumer choices and update industry safety standards. Additionally, the OS-mediated mechanism revealed provides a theoretical basis for developing enhanced sweetener systems, such as composite sweeteners blending aspartame with natural antioxidants to counteract reactive oxygen species accumulation, thereby boosting the safety and health value of low-calorie food and pharmaceutical products.
Despite its strengths, this study has several limitations that should be acknowledged. First and foremost, the analyses conducted are associative and exploratory in nature, which does not support causal inferences or claims directly related to aspartame exposure. Given the unavailability of direct aspartame-exposed HCC datasets to date, the machine learning model was trained on general gene expression omnibus (GEO) datasets without stratification by aspartame exposure status. Accordingly, it is important to clarify that the core genes identified herein are primarily HCC-associated genes, as their classification as potential aspartame-related targets is based solely on in silico target prediction and molecular docking results – rather than direct experimental evidence of aspartame-specific regulation. These genes thus reflect inherent associations with HCC pathological status, and their specific responsiveness to aspartame will require further validation using exposure-stratified datasets and functional experiments. This limitation ultimately restricts our ability to specifically link the identified core genes to aspartame rather than general HCC progression, as the predictive models prioritize genes associated with HCC status, not genes specific to the effects of aspartame. Second, the analysis relies on public omics datasets, which may suffer from heterogeneity in sample collection, processing, and sequencing platforms. While we corrected for batch effects using “ComBat,” residual variation could influence the identification of DEGs. Third, the molecular docking results are purely in silico predictions and lack experimental validation. In vitro binding assays and functional experiments are needed to confirm the interaction between aspartame and the core targets, as well as the biological consequences of this binding. Fourth, we did not investigate the downstream signaling pathways of the core genes, leaving the precise mechanisms by which potential aspartame-target binding may alter OS and HCC progression unclear. Fifth, the study lacks in vivo validation: animal models exposed to aspartame would be necessary to confirm the differential expression of core genes and their role in tumor formation.
In summary, this study systematically identifies the potential molecular network linking aspartame to HCC mediated by OS genes, prioritizes core targets, and validates their associations with aspartame. The findings align with existing literature on artificial sweetener toxicity and HCC biology while uncovering unexpected regulatory complexities and novel mechanisms. From a translational perspective, the core genes identified herein hold promise as diagnostic biomarkers for HCC potentially associated with aspartame, while their interaction with aspartame provides potential targets for chemoprevention in high-risk populations. From a population health perspective, our findings underscore the urgency of reassessing the prolonged safety profile of aspartame, especially given the escalating global burden of HCC. Subsequent research should prioritize the experimental validation of these core gene-aspartame interactions, alongside the exploration of specific downstream signaling cascades and the use of in vivo models to substantiate the proposed oncogenic mechanisms. In conclusion, this research refines our knowledge of liver malignancy triggered by environmental additives and establishes a framework for tailoring personalized preventive and therapeutic approaches.
We sincerely thank all participants involved in this study and the staff who provided valuable assistance and technical support throughout the research process.
Zhou An conceived the original idea, designed the study, and supervised the project. Xianhua Wang conducted the literature review and drafted the initial version of the manuscript. Zhou An and Xianhua Wang were responsible for data collection and statistical analyses. Yuyun Jia developed the experimental protocols and contributed to discussion. Zhou An assisted with data analysis. All authors have read and approved the final manuscript.
Zhou An https://orcid.org/0009-0006-8969-1654
Xianhua Wang https://orcid.org/0009-0006-7205-7876
Yuyun Jia https://orcid.org/0009-0009-5564-3541
The authors have no potential conflict of interests to declare.