
Figure 1
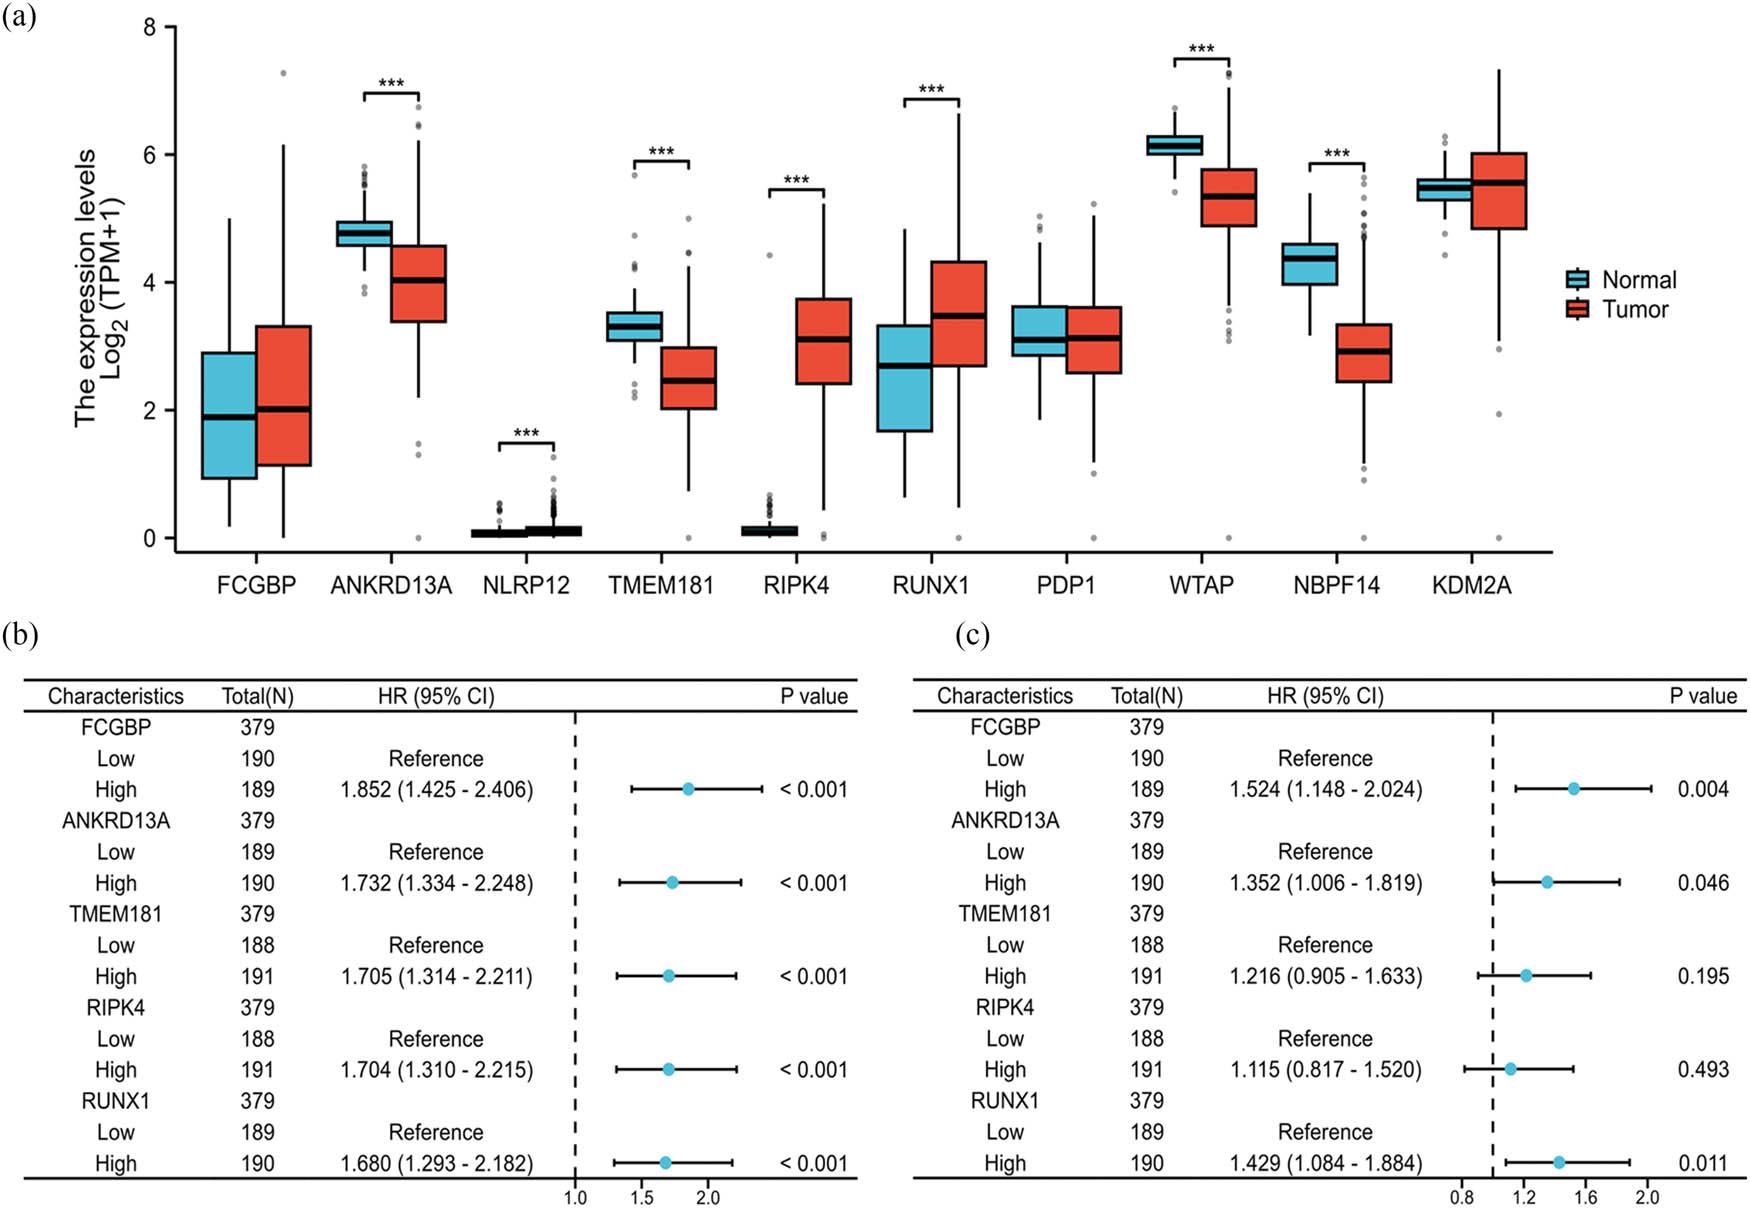
Figure 2
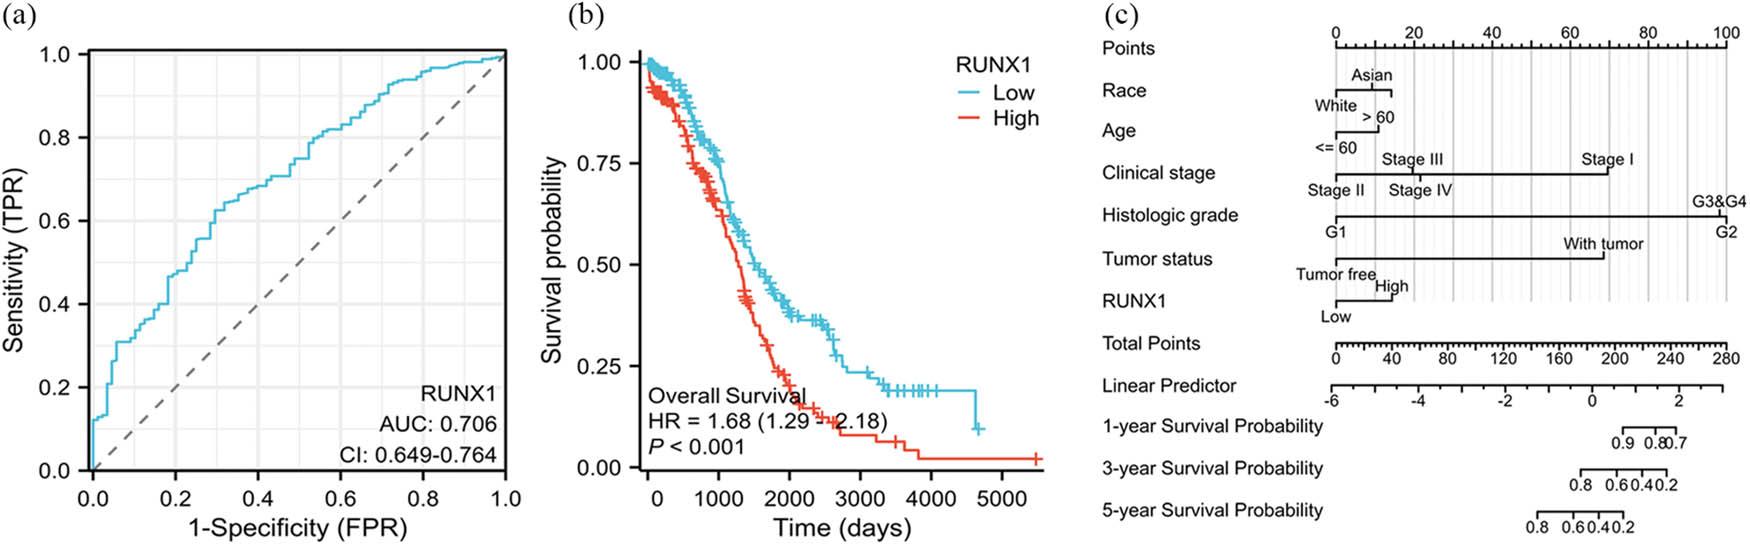
Figure 3
Figure 4
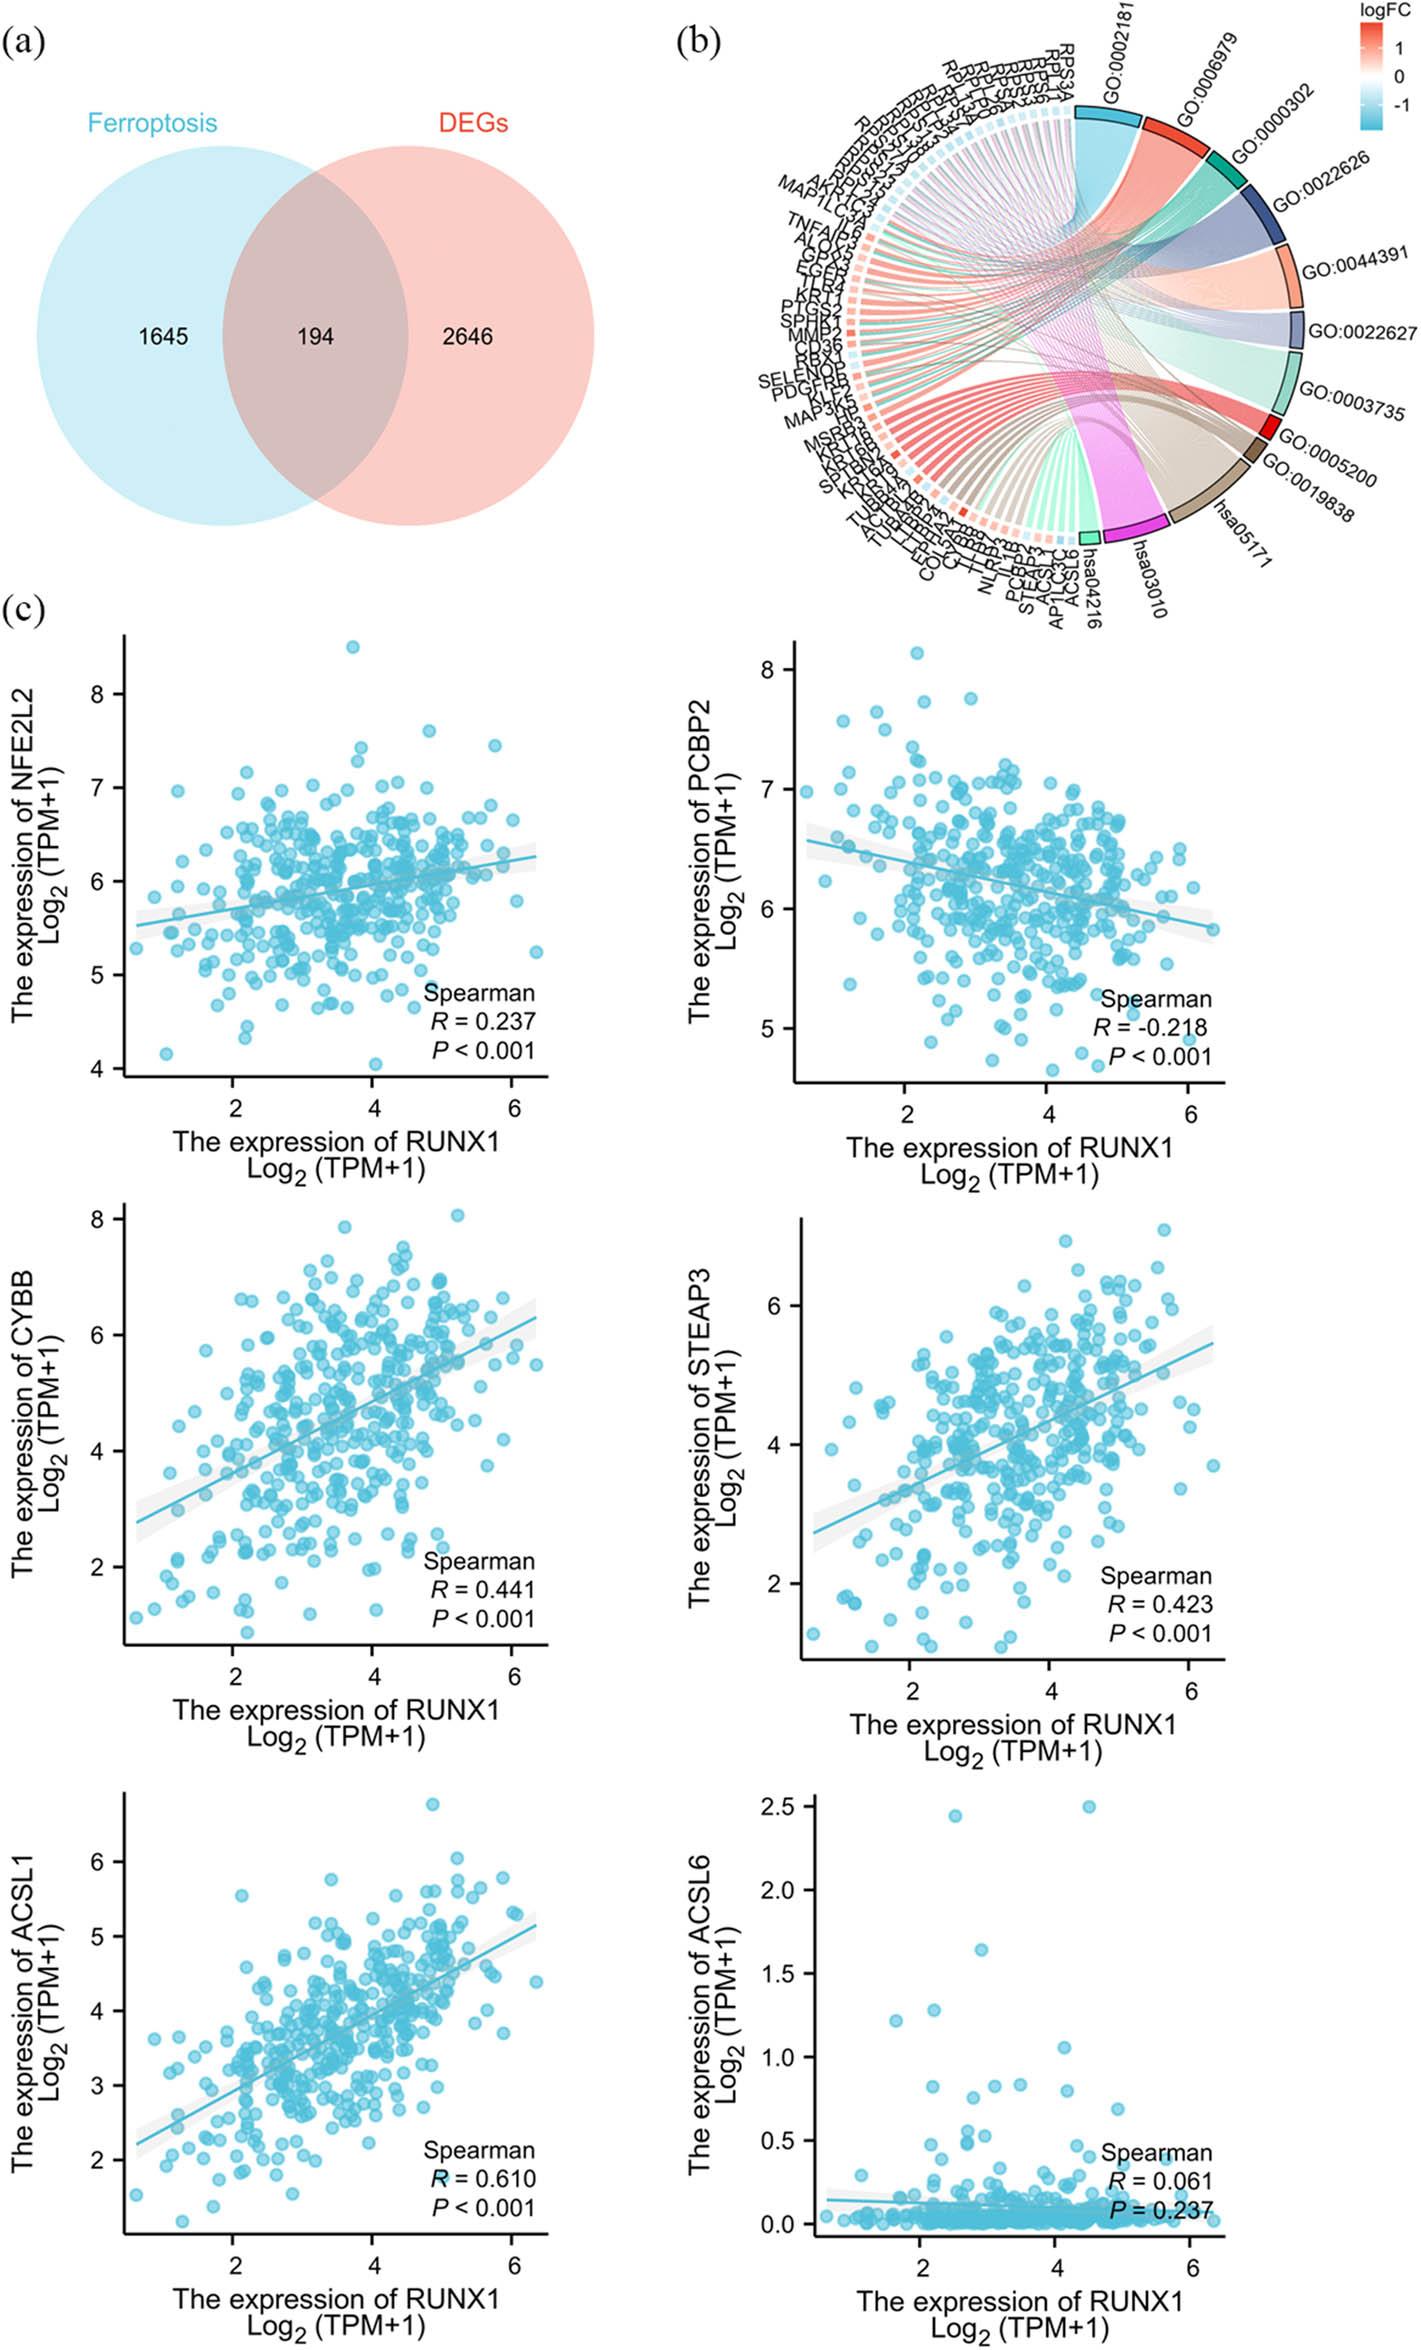
Figure 5
Figure 6
Figure 7
GO and KEGG analyses incorporating fold-change criteria
| Ontology | ID | Description | Gene ratio | Bg Ratio | p value | p. adjust | z score |
|---|---|---|---|---|---|---|---|
| BP | GO:0002181 | Cytoplasmic translation | 20/189 | 146/18,800 | 2.72 × 10⁻¹⁷ | 9.34 × 10⁻¹⁴ | −4.4721 |
| BP | GO:0006979 | Response to oxidative stress | 21/189 | 433/18,800 | 2.83 × 10⁻⁹ | 4.86 × 10⁻⁶ | 2.4004 |
| BP | GO:0000302 | Response to reactive oxygen species | 14/189 | 203/18,800 | 1.85 × 10⁻⁸ | 2.12 × 10⁻⁵ | 1.6036 |
| BP | GO:0042060 | Wound healing | 19/189 | 429/18,800 | 7.1 × 10⁻⁸ | 6.09 × 10⁻⁵ | 2.5236 |
| BP | GO:0034614 | Cellular response to reactive oxygen species | 11/189 | 147/18,800 | 2.86 × 10⁻⁷ | 0.0002 | 1.5076 |
| CC | GO:0022626 | Cytosolic ribosome | 20/193 | 102/19,594 | 1.12 × 10⁻²⁰ | 3.65 × 10⁻¹⁸ | −4.4721 |
| CC | GO:0044391 | Ribosomal subunit | 20/193 | 178/19,594 | 9.76 × 10⁻¹⁶ | 1.59 × 10⁻¹³ | −4.4721 |
| CC | GO:0022627 | Cytosolic small ribosomal subunit | 12/193 | 43/19,594 | 6.94 × 10⁻¹⁵ | 7.54 × 10⁻¹³ | −3.4641 |
| CC | GO:0030055 | Cell-substrate junction | 27/193 | 428/19,594 | 1.62 × 10⁻¹⁴ | 1.32 × 10⁻¹² | 0.57735 |
| CC | GO:0005925 | Focal adhesion | 26/193 | 419/19,594 | 7.58 × 10⁻¹⁴ | 4.94 × 10⁻¹² | 0.39223 |
| MF | GO:0003735 | Structural constituent of ribosome | 20/190 | 181/18,410 | 3.18 × 10⁻¹⁵ | 1.41 × 10⁻¹² | −4.4721 |
| MF | GO:0005200 | Structural constituent of cytoskeleton | 8/190 | 104/18,410 | 1.23 × 10⁻⁵ | 0.0027 | 1.4142 |
| MF | GO:0019838 | Growth factor binding | 8/190 | 139/18,410 | 9.88 × 10⁻⁵ | 0.0123 | 1.4142 |
| MF | GO:0038187 | Pattern recognition receptor activity | 4/190 | 26/18,410 | 0.0001 | 0.0123 | 2 |
| MF | GO:0048027 | mRNA 5′-UTR binding | 4/190 | 27/18,410 | 0.0002 | 0.0123 | −2 |
| KEGG | hsa05171 | Coronavirus disease – COVID-19 | 28/115 | 232/8,164 | 5.15 × 10⁻¹⁹ | 1.11 × 10⁻¹⁶ | −2.2678 |
| KEGG | hsa03010 | Ribosome | 20/115 | 158/8,164 | 3.91 × 10⁻¹⁴ | 4.2 × 10⁻¹² | −4.4721 |
| KEGG | hsa04216 | Ferroptosis | 7/115 | 41/8,164 | 1.39 × 10⁻⁶ | 9.93 × 10⁻⁵ | −0.37796 |
| KEGG | hsa05144 | Malaria | 7/115 | 50/8164 | 5.55 × 10⁻⁶ | 0.0003 | 2.6458 |
| KEGG | hsa04066 | HIF-1 signaling pathway | 8/115 | 109/8,164 | 0.0001 | 0.0061 | 0 |
Univariate and multivariate analysis
| Characteristics | Total (N) | Univariate analysis | Multivariate analysis | ||
|---|---|---|---|---|---|
| HR (95% CI) | p value | HR (95% CI) | p value | ||
| FCGBP | 379 | ||||
| Low | 190 | Reference | Reference | ||
| High | 189 | 1.852 (1.425–2.406) | <0.001 | 1.524 (1.148–2.024) | 0.004 |
| ANKRD13A | 379 | ||||
| Low | 189 | Reference | Reference | ||
| High | 190 | 1.732 (1.334–2.248) | <0.001 | 1.352 (1.006–1.819) | 0.046 |
| TMEM181 | 379 | ||||
| Low | 188 | Reference | Reference | ||
| High | 191 | 1.705 (1.314–2.211) | <0.001 | 1.216 (0.905–1.633) | 0.195 |
| RIPK4 | 379 | ||||
| Low | 188 | Reference | Reference | ||
| High | 191 | 1.704 (1.310–2.215) | <0.001 | 1.115 (0.817–1.520) | 0.493 |
| RUNX1 | 379 | ||||
| Low | 189 | Reference | Reference | ||
| High | 190 | 1.680 (1.293–2.182) | <0.001 | 1.429 (1.084–1.884) | 0.011 |
Baseline characteristics
| Characteristics | Low expression of RUNX1 | High expression of RUNX1 | p value |
|---|---|---|---|
| n | 190 | 191 | |
| Race, n (%) | 0.708 | ||
| Asian | 5 (1.4%) | 7 (1.9%) | |
| Black or African American | 14 (3.8%) | 11 (3%) | |
| White | 165 (45%) | 165 (45%) | |
| Age, n (%) | 0.384 | ||
| < = 60 | 100 (26.2%) | 109 (28.6%) | |
| >60 | 90 (23.6%) | 82 (21.5%) | |
| Clinical stage, n (%) | 0.250 | ||
| Stage I | 1 (0.3%) | 0 (0%) | |
| Stage II | 15 (4%) | 8 (2.1%) | |
| Stage III | 146 (38.6%) | 150 (39.7%) | |
| Stage IV | 26 (6.9%) | 32 (8.5%) | |
| Tumor status, n (%) | 0.288 | ||
| Tumor free | 40 (11.8%) | 32 (9.5%) | |
| With tumor | 129 (38.2%) | 137 (40.5%) | |
| Histologic grade, n (%) | 1.000 | ||
| G1 | 1 (0.3%) | 0 (0%) | |
| G2 | 22 (5.9%) | 23 (6.2%) | |
| G3 and G4 | 162 (43.7%) | 163 (43.9%) | |
| Primary therapy outcome, n (%) | 0.069 | ||
| PD | 15 (4.9%) | 12 (3.9%) | |
| SD | 10 (3.2%) | 12 (3.9%) | |
| PR | 15 (4.9%) | 28 (9.1%) | |
| CR | 122 (39.5%) | 95 (30.7%) | |
| Lymphatic invasion, n (%) | 0.212 | ||
| No | 29 (19.5%) | 19 (12.8%) | |
| Yes | 50 (33.6%) | 51 (34.2%) | |
| OS event, n (%) | 0.004 | ||
| Alive | 87 (22.8%) | 60 (15.7%) | |
| Dead | 103 (27%) | 131 (34.4%) | |
| DSS event, n (%) | 0.019 | ||
| No | 89 (25.1%) | 65 (18.3%) | |
| Yes | 91 (25.6%) | 110 (31%) | |
| PFI event, n (%) | 0.933 | ||
| No | 51 (13.4%) | 52 (13.6%) | |
| Yes | 139 (36.5%) | 139 (36.5%) |