
Ovarian serous cystadenocarcinoma (OSC) represents a prevalent form of malignant neoplasm in women [1,2]. Late diagnosis of this disease frequently leads to significant reductions in patient quality of life and imposes substantial economic burdens on healthcare systems [3,4]. Although current treatments include surgical resection, chemotherapy, and radiotherapy, early screening and prognostic evaluation for ovarian cancer remain inadequate. Therefore, it is essential to discover novel biomarkers that can enhance the rates of early diagnosis and the effectiveness of treatment [5,6].
Recent investigations reveal that various cancer cells display marked susceptibility to ferroptosis under specific conditions, which suggests a promising approach to overcome drug resistance [7,8]. Modulating ferroptosis sensitivity is emerging as a strategy in ovarian cancer [9]. Ferroptosis is a promising therapeutic avenue for overcoming chemoresistance in various cancers, including ovarian cancer [10,11]. Its therapeutic potential is underscored by the vulnerability of ovarian cancer cells, linked to their metabolic rewiring and reliance on lipid metabolism, which makes them sensitive to pharmacological inducers such as erastin and RSL3 [12,13,14]. The sensitivity to ferroptosis is tightly regulated at the transcriptional level. Key transcription factors, notably the master antioxidant regulator Nrf2, have been identified as critical negative regulators of this process; their activation promotes tumor progression by conferring ferroptosis resistance [15,16,17]. This highlights the importance of identifying upstream transcriptional controllers of ferroptosis in cancer. The transcription factor RUNX1 is a well-established regulator of proliferation and differentiation in various malignancies. However, its role in OSC is poorly defined; whether and how RUNX1 influences this cell death pathway in any cancer, including OSC, remains entirely unexplored.
Here we explored the clinical significance and biological function of RUNX1 in OSC, while focusing on its role in ferroptosis. Moreover, we validate its oncogenic functions in vitro through proliferation and colony formation assays, and elucidate its mechanistic involvement in regulating ferroptosis sensitivity, particularly through the Nrf2 pathway.
SHIN-3 (YS1241C; YaJi Biological, Shanghai, China) and OVCAR-3 human epithelial ovarian adenocarcinoma cells (HTB-161; ATCC) derived from malignant ascites were maintained in culture. SHIN-3 cells were sourced commercially while OVCAR-3 represents a patient-derived model. For genetic perturbation, lentiviral particles expressing RUNX1-targeting shRNA (sc-37677-V) and nontargeting control shRNA (sc-108080) were procured from Santa Cruz Biotechnology.
RNA sequencing data, along with the associated clinical data for the TCGA-OV project were downloaded from TCGA database. The baseline characteristics are presented in Table 1. Gene expression data in transcripts per million (TPM) format underwent initial filtering, while excluding normal samples and those lacking associated clinical information. Thereafter, expression values were transformed using a log2 (value + 1) normalization. Prognostic screening for association with overall survival (OS) was performed using univariate Cox proportional hazards regression models implemented in the R survival package [18]. A two-stage Cox regression analysis was performed using R (survival and rms packages). First, an exploratory univariate analysis was conducted for each protein-coding gene (patients dichotomized by median expression), p-value <0.05 were selected. Second, a confirmatory multivariate analysis was performed on top candidates, adjusting for key clinical covariates (e.g., age, stage), to identify independent prognostic factors.
Baseline characteristics
| Characteristics | Low expression of RUNX1 | High expression of RUNX1 | p value |
|---|---|---|---|
| n | 190 | 191 | |
| Race, n (%) | 0.708 | ||
| Asian | 5 (1.4%) | 7 (1.9%) | |
| Black or African American | 14 (3.8%) | 11 (3%) | |
| White | 165 (45%) | 165 (45%) | |
| Age, n (%) | 0.384 | ||
| < = 60 | 100 (26.2%) | 109 (28.6%) | |
| >60 | 90 (23.6%) | 82 (21.5%) | |
| Clinical stage, n (%) | 0.250 | ||
| Stage I | 1 (0.3%) | 0 (0%) | |
| Stage II | 15 (4%) | 8 (2.1%) | |
| Stage III | 146 (38.6%) | 150 (39.7%) | |
| Stage IV | 26 (6.9%) | 32 (8.5%) | |
| Tumor status, n (%) | 0.288 | ||
| Tumor free | 40 (11.8%) | 32 (9.5%) | |
| With tumor | 129 (38.2%) | 137 (40.5%) | |
| Histologic grade, n (%) | 1.000 | ||
| G1 | 1 (0.3%) | 0 (0%) | |
| G2 | 22 (5.9%) | 23 (6.2%) | |
| G3 and G4 | 162 (43.7%) | 163 (43.9%) | |
| Primary therapy outcome, n (%) | 0.069 | ||
| PD | 15 (4.9%) | 12 (3.9%) | |
| SD | 10 (3.2%) | 12 (3.9%) | |
| PR | 15 (4.9%) | 28 (9.1%) | |
| CR | 122 (39.5%) | 95 (30.7%) | |
| Lymphatic invasion, n (%) | 0.212 | ||
| No | 29 (19.5%) | 19 (12.8%) | |
| Yes | 50 (33.6%) | 51 (34.2%) | |
| OS event, n (%) | 0.004 | ||
| Alive | 87 (22.8%) | 60 (15.7%) | |
| Dead | 103 (27%) | 131 (34.4%) | |
| DSS event, n (%) | 0.019 | ||
| No | 89 (25.1%) | 65 (18.3%) | |
| Yes | 91 (25.6%) | 110 (31%) | |
| PFI event, n (%) | 0.933 | ||
| No | 51 (13.4%) | 52 (13.6%) | |
| Yes | 139 (36.5%) | 139 (36.5%) |
OS (Overall Survival), DSS (Disease-Specific Survival), PFI (Progression-Free Interval), CR (Complete Response), PR (Partial Response), SD (Stable Disease), PD (Progressive Disease).
The analysis was performed by comparing the high vs low RUNX1 expression groups (dichotomized by median expression) using the DESeq2 package. An absolute log₂ fold change (|log₂FC|) > 0.5 and a padj <0.05 (Benjamini–Hochberg procedure) were defined as statistically significant DEGs. The threshold of |log₂FC| >0.5 (approximately a 1.4-fold change) is a widely accepted benchmark in transcriptomic studies to identify changes of meaningful biological relevance while controlling for false positives.
Survival probabilities were assessed using the Xiantao platform. Additionally, the hazard ratio (HR) along with the associated log-rank p-value for OS was calculated.
The RUNX1 expression and that of other genes were analyzed with clusterProfiler package (version 4.4.4) in R [19,20] utilizing extensive transcriptomic datasets from 427 OSC patients obtained from the TCGA project. Following this, GO/KEGG were analyzed in Xiantao platform.
A PPI network analysis was conducted to analyze interacting genes of RUNX1 in STRING database. Additionally, we limited the maximum number of interactors to no more than 20. The PPI enrichment analysis yielded a p-value of 6.5 × 10⁻⁵, thereby indicating significant interactions. We utilized Cytoscape CytoHubba plug-in to find the top ten hub genes, while ranking them based on maximal clique centrality (MCC).
The MTT assay was conducted using SHIN-3 or OVCAR-3 cells that had been transduced with either RUNX1 or control shRNA lentiviruses. Stable cell lines were established following standard protocols. The experiment was performed in 96-well plates at an appropriate density for 24, 48, and 72 h. To evaluate cell viability, the MTT assay was performed [21,22] with a minimum of three independent experiments, with each containing three replicates.
In the clone formation assay, stable cell lines were plated into 6-well plates (500 cells) and cultured for a period of 14 days. After this incubation phase, the cells were rinsed with phosphate-buffered saline and fixed using 4% paraformaldehyde for 10 min. Subsequently, the cells were treated with 0.1% crystal violet for 30 min, and colonies were defined as cell clusters containing ≥50 cells and were manually counted for each well. The experiment included three independent biological replicates.
GSH levels were evaluated using an assay kit from Nanjing Jiancheng (#A006-2) [23]. MDA concentrations were tested by MDA assay kit (ab118970; Abcam), while adhering to the protocols provided with the kit. Concentrations were determined using standard curves generated with each experiment.
The protein expressions of RUNX1, Nrf2, and β-actin in the SHIN-3 and OVCAR-3 cell lines were assessed using WB analysis. The membrane was incubated with the primay antibody overnight for 4°C. The primary antibodies used included an anti-RUNX1 antibody (Cat. No. CSB-PA245126, Cusabio Corporation, Wuhan, China), a rabbit polyclonal antibody specifically targeting RUNX1; an anti-Nrf2 antibody (Cat. No. ab137550; Abcam), a rabbit polyclonal antibody against Nrf2; and an anti-β-actin antibody (Cat. No. ab8227, Abcam), which is a rabbit polyclonal antibody specific to β-actin.
All the data were analyzed using R (v4.2.1) or GraphPad Prism (v9.0). p-value <0.05 was considered statistically significant. For a more nuanced presentation of the results, the following asterisk notation system is used in the figures: *p < 0.05, **p < 0.01, ***p < 0.001.
RUNX1 is a standalone prognostic indicator, demonstrating increased expression in tumor tissues and associated with adverse outcomes in OSC patients
We initially screened prognosis-associated DEGs using TPM-formatted RNA-seq data and clinical records of OSC patients from TCGA. OS analysis was performed via batch survival Cox regression [18]. We identified 1,774 protein-coding genes meeting statistical significance. Next multivariate Cox regression of the top ten ranked by descending HR values revealed FCGBP and RUNX1 as independent prognostic factors for OSC (Table 2). Moreover, expression validation of these top 10 HR-associated genes in UCSC XENA demonstrated significant upregulation of RIPK4 (p < 0.001) and RUNX1 (p < 0.001) in OSC vs NC controls, while ANKRD13A, TMEM181, WTAP, and NBPF14 showed marked downregulation (p < 0.001). Based on its high level in OSC patient and correlation with adverse prognosis, RUNX1 was selected as the research focus (Figure 1).
Univariate and multivariate analysis
| Characteristics | Total (N) | Univariate analysis | Multivariate analysis | ||
|---|---|---|---|---|---|
| HR (95% CI) | p value | HR (95% CI) | p value | ||
| FCGBP | 379 | ||||
| Low | 190 | Reference | Reference | ||
| High | 189 | 1.852 (1.425–2.406) | <0.001 | 1.524 (1.148–2.024) | 0.004 |
| ANKRD13A | 379 | ||||
| Low | 189 | Reference | Reference | ||
| High | 190 | 1.732 (1.334–2.248) | <0.001 | 1.352 (1.006–1.819) | 0.046 |
| TMEM181 | 379 | ||||
| Low | 188 | Reference | Reference | ||
| High | 191 | 1.705 (1.314–2.211) | <0.001 | 1.216 (0.905–1.633) | 0.195 |
| RIPK4 | 379 | ||||
| Low | 188 | Reference | Reference | ||
| High | 191 | 1.704 (1.310–2.215) | <0.001 | 1.115 (0.817–1.520) | 0.493 |
| RUNX1 | 379 | ||||
| Low | 189 | Reference | Reference | ||
| High | 190 | 1.680 (1.293–2.182) | <0.001 | 1.429 (1.084–1.884) | 0.011 |
Values in bold are statistically significant.
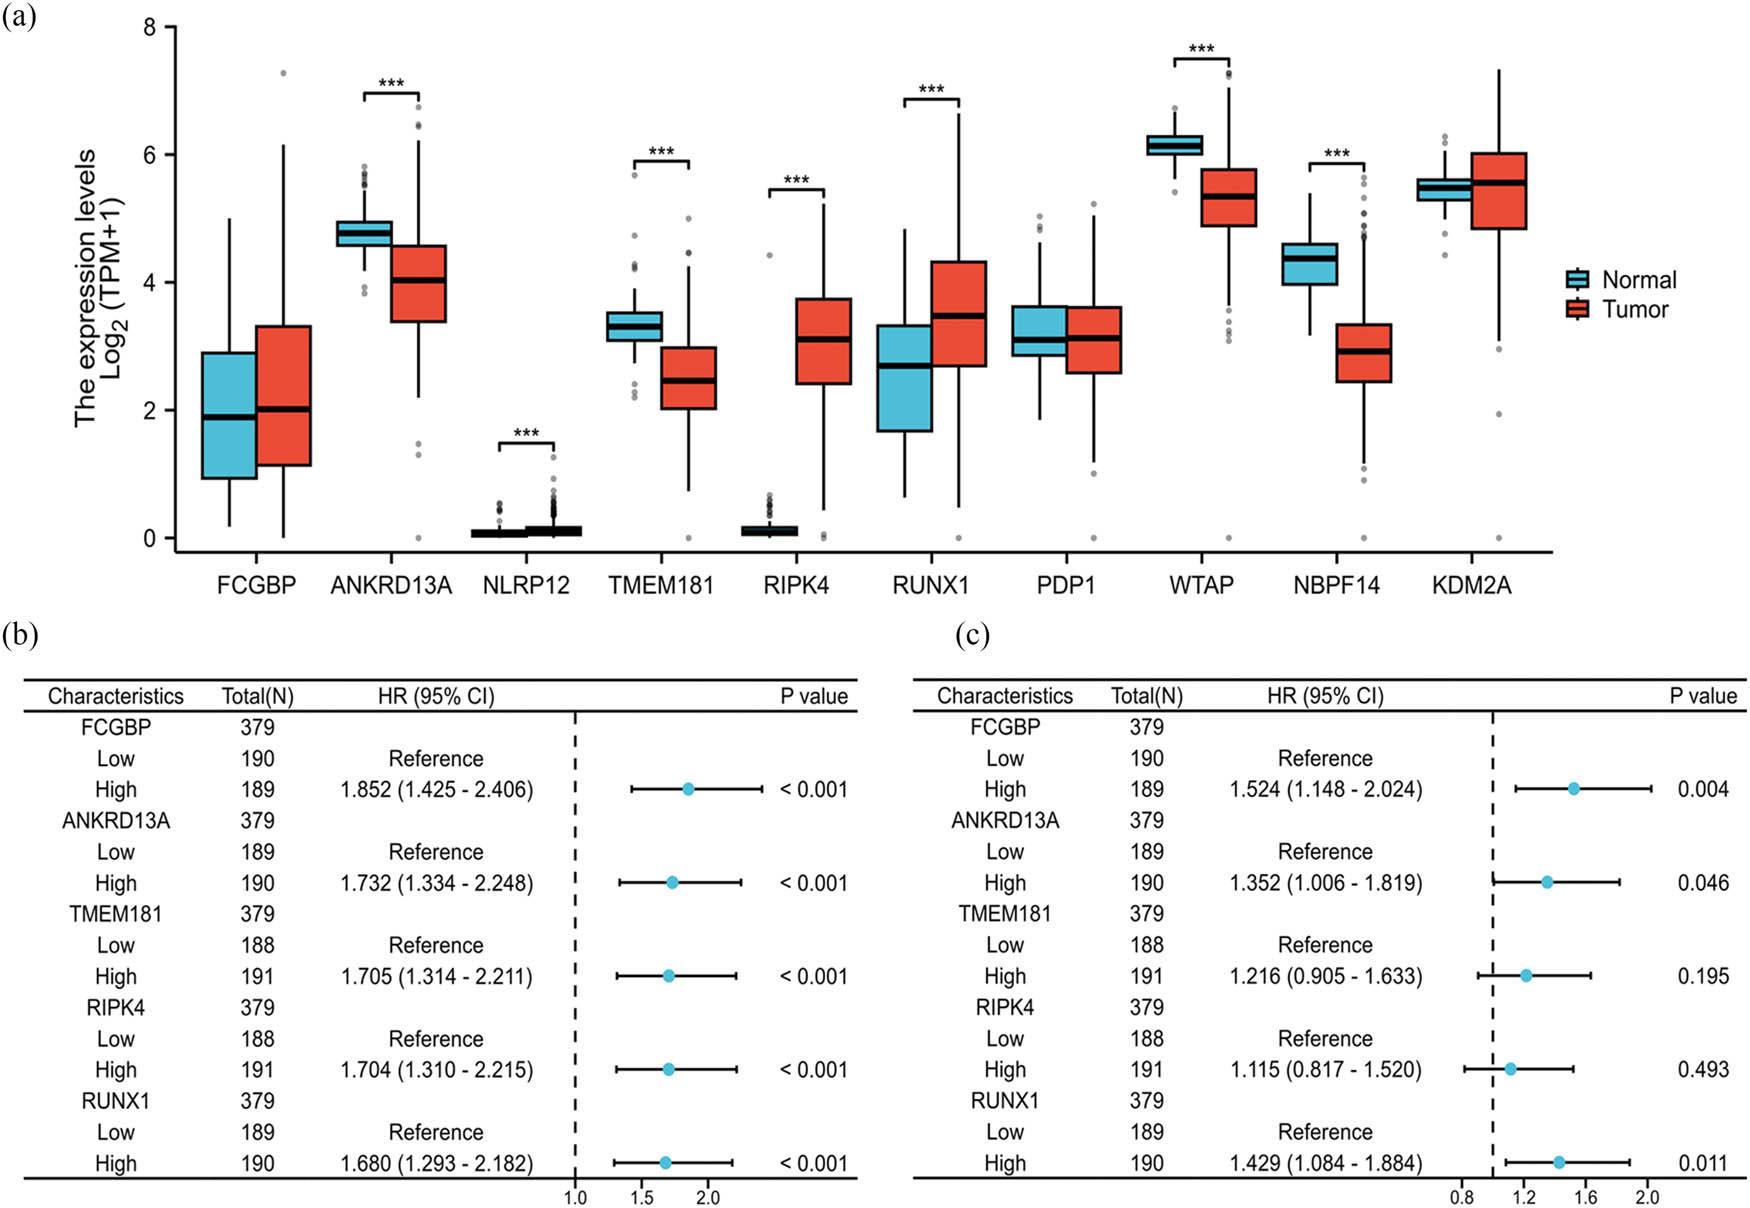
RUNX1 is an independent prognostic factor associated with both elevated expression in tumor tissues and poor clinical outcomes in OSC patients. (a) The expression levels of the top ten prognosis-related genes in OSC tissues (n = 427) and normal controls (n = 88). Data processing method: log2 (value + 1). Data were analyzed by unpaired two-tailed Student’s t-test. Data processing method: log₂(value + 1). ***p < 0.001. (b) Forest plot of univariate Cox regression analysis for OS. Univariate Cox proportional hazards regression was performed using the survival R package (v3.3.1). p < 0.05 was considered statistically significant. (c) Forest plot of multivariate Cox regression analysis for OS, HR, and 95% CI are shown. Statistical significance was assessed by the Wald test
The diagnostic efficacy of RUNX1 in individuals diagnosed with OSC was assessed using receiver operating characteristic (ROC), which sought to test the reliability and effectiveness of measured variables. The RUNX1 levels in OSC tissues were compared with normal control via ROC curves. The study population comprised 427 OSC patients alongside 88 healthy controls (Figure 2a). The ROC analysis revealed a moderate level of predictive accuracy for RUNX1, evidenced by an area under the curve (AUC) measuring 0.706 (CI = 0.649–0.764, p < 0.001). Moreover, the analysis revealed a sensitivity of 0.705 and a specificity of 0.625, with a determined cut-off value of 3.109 (Figure 2a).

Diagnostic and prognostic significance of RUNX1 in patients with OSC. (a) ROC analysis of RUNX1 in OSC patients. The AUC for RUNX1 was 0.706 (DeLong’s test, p < 0.001). (b) Data were extracted in TPM format alongside corresponding clinical records. Kaplan–Meier survival curves comparing OS between OSC patients with high (n = 190) vs low (n = 189) RUNX1 expression. (c) Prognostic nomogram integrating RUNX1 expression and clinical variables to predict 1-, 3-, and 5-year OS probability
The prognostic relevance of RUNX1 levels in OSC patients was evaluated utilizing the Kaplan–Meier plotter via Xiantao platform. Findings indicated an obvious correlation between higher RUNX1 expression and a reduced probability of OS (HR = 1.68 (1.29–2.18), p < 0.001) (Figure 2b).
Based on multivariate Cox results, nomograms were developed to forecast the likelihood of 1-, 3-, and 5-year OS rates, utilizing the RMS package (Figure 2c). The performance of the nomogram was assessed to yield a C-index of 0.672 (0.650–0.693).
Subsequently, we conducted an analysis of the interacting proteins associated with RUNX1 in Homo sapiens through the utilization of PPI analysis, which was established employing the STRING database as a foundational resource. A medium confidence threshold of 0.400 was determined as the minimal interaction score required for inclusion. The anticipated number of edges within the network was calculated to be 16, with a PPI enrichment p-value of 6.48 × 10⁻¹¹ (Figure 3a). Furthermore, utilizing Cytoscape, we identified the top ten hub genes, which included CBFB, SPI1, HDAC1, CEBPA, ETS1, GATA2, EP300, TAL1, FOXP3, and RUNX1 (Figure 3b). The levels of the hub genes were shown in Figure 3c. The results demonstrated that the levels of RUNX1, SPI1, CEBPA, and FOXP3 were obviously upregulated in OSC tissues, while the level of HDAC1, ETS1, GATA2, EP300, and TAL1 were significantly decreased in OSC patients (***p < 0.001, Figure S1).
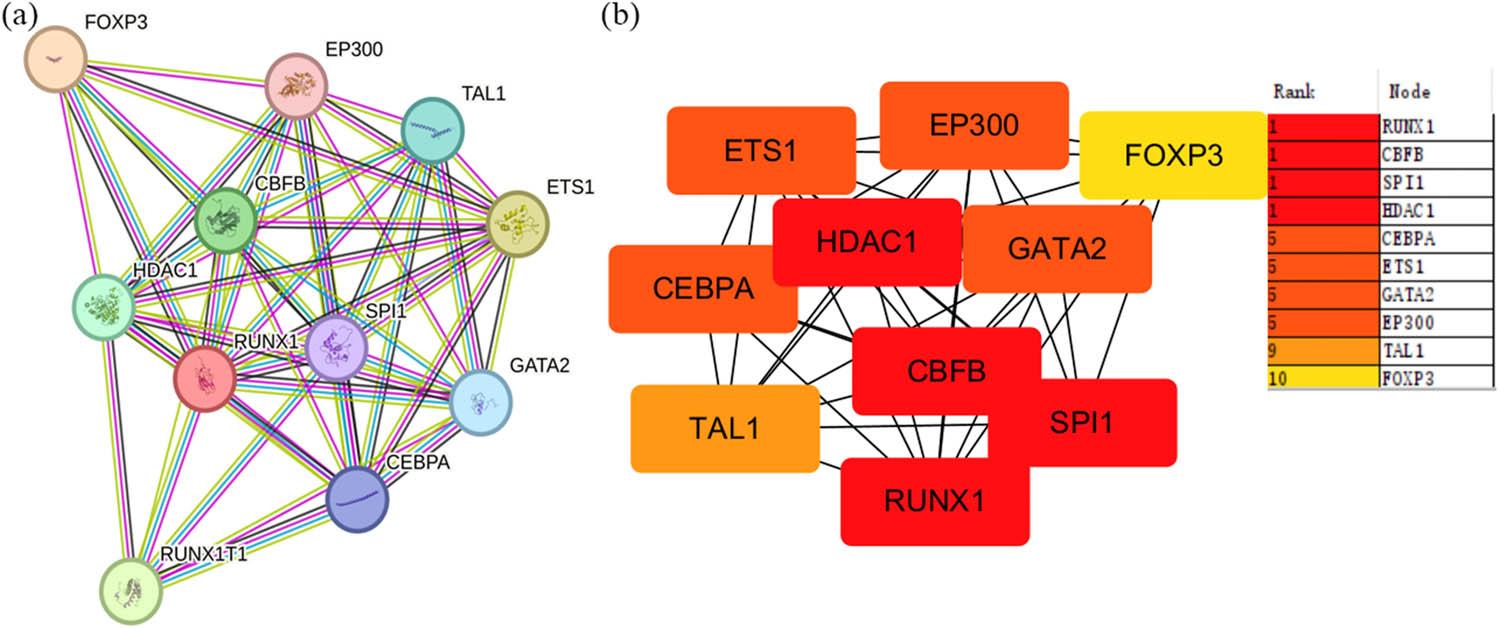
The analysis of top ten hub genes and the expression of the Top ten hub genes in OSC. (a) PPI analysis of the network linking RUNX1 in homo sapiens via STRING database (confidence threshold >0.400). (b) The Top ten hub gene linking RUNX1 in homo sapiens was shown by Cytoscape (CytoHubba plugin, ranked by MCC method)
It has been reported that modulating ferroptosis holds therapeutic potential for cancer treatment [24]. A Venn diagram analysis was performed using DEGs from RUNX1 expression groups and ferroptosis-related gene sets to explore the involvement of RUNX1 in regulating ferroptosis during OSC progression. This analysis identified 194 intersecting genes (Figure 4a). GO and KEGG analyses incorporating fold-change (FC) criteria were conducted, with results visualized using ggplot2 as chord plots (Figure 4b). The intersecting DEGs were enriched in biological processes (BP) including cytoplasmic translation (GO:0002181), oxidative stress (GO:0006979), and ROS (GO:0000302). In molecular functions (MF), DEGs were primarily enriched in GO:0005200, GO:0019838, and GO:0003735. For cellular components (CC), significant enrichment occurred in GO:0022626, GO:0044391, and GO:0022627. KEGG pathway analysis revealed enrichment in coronavirus disease (COVID-19) (hsa05171), ribosome (hsa03010), ferroptosis (hsa04216), and malaria (hsa05144) among others (Table 3).
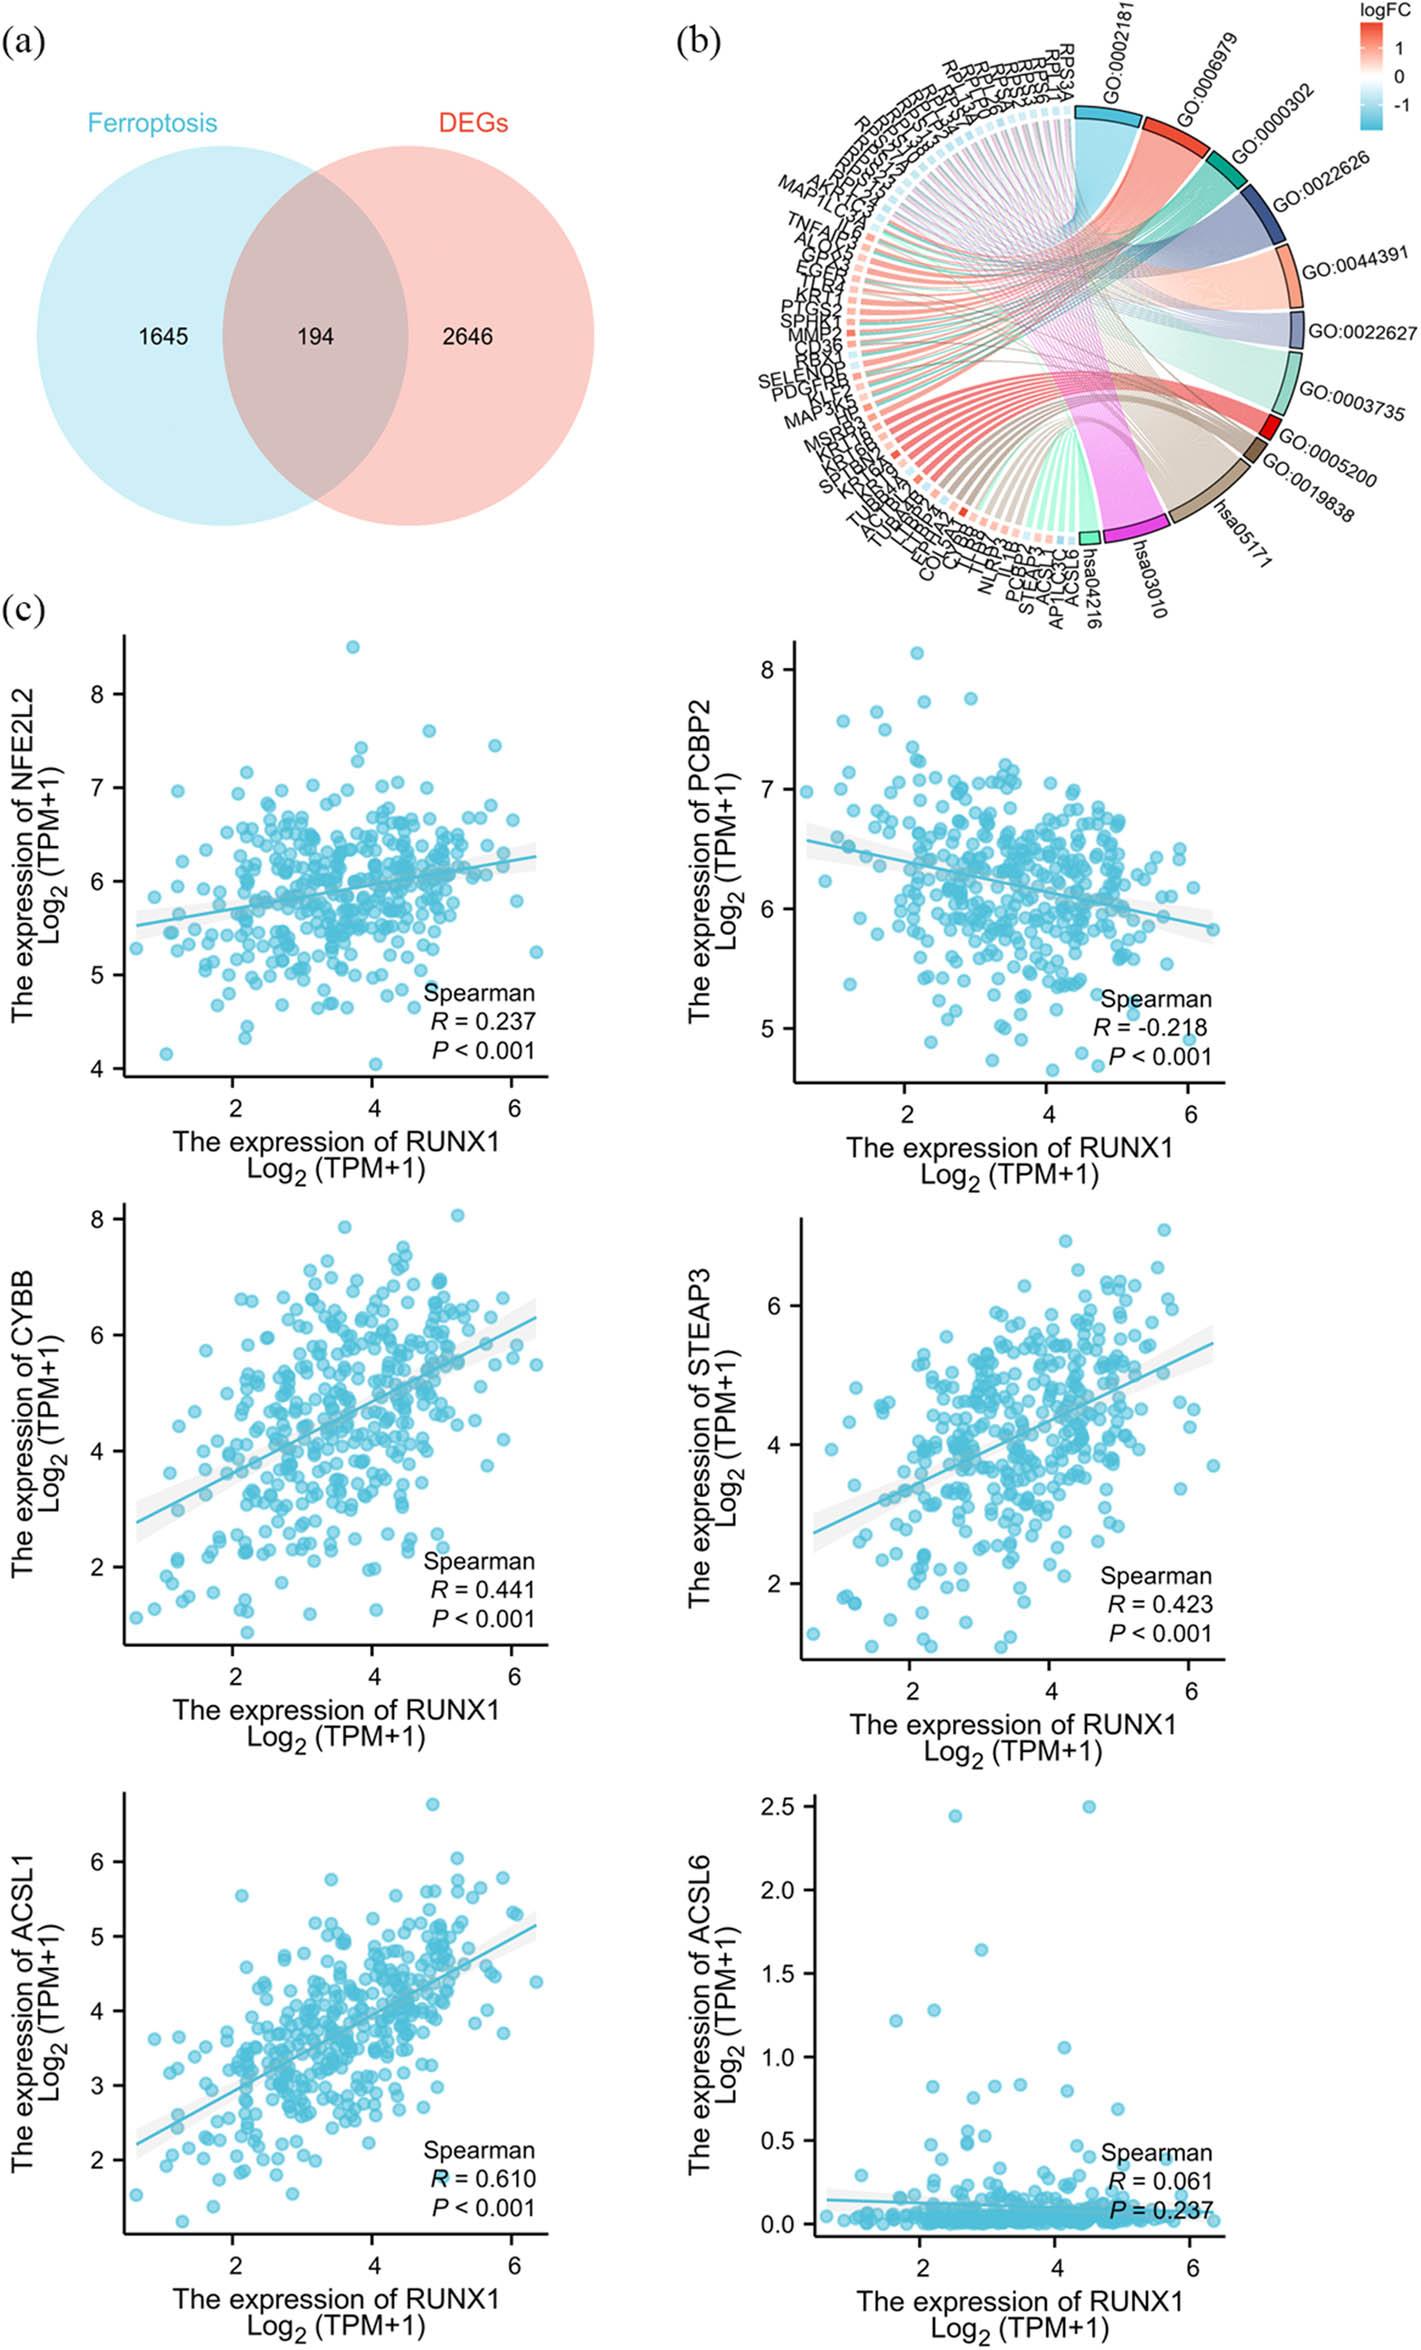
RUNX1 is potentially involved in regulating ferroptosis in OSC cells. (a) Venn diagram. Differential analysis was performed using DESeq2 package [42,43] on raw counts matrices from public datasets. Protein-coding genes meeting |log2FoldChange| >0.5 and adjusted p < 0.05 were filtered. Intersection was obtained with ferroptosis-related gene sets from GeneCards database. (b) GO/KEGG enrichment analysis combined with FC criteria for the 194 intersecting genes. Visualization was implemented using ggplot2 package to generate Chord diagram. (c) Correlation analysis of ferroptosis-related genes and RUNX1. RNA-seq data in TPM format processed via STAR workflow and clinical data from TCGA-OV project (n = 381). Data processing method: log2 (value + 1). Spearman analysis was performed
GO and KEGG analyses incorporating fold-change criteria
| Ontology | ID | Description | Gene ratio | Bg Ratio | p value | p. adjust | z score |
|---|---|---|---|---|---|---|---|
| BP | GO:0002181 | Cytoplasmic translation | 20/189 | 146/18,800 | 2.72 × 10⁻¹⁷ | 9.34 × 10⁻¹⁴ | −4.4721 |
| BP | GO:0006979 | Response to oxidative stress | 21/189 | 433/18,800 | 2.83 × 10⁻⁹ | 4.86 × 10⁻⁶ | 2.4004 |
| BP | GO:0000302 | Response to reactive oxygen species | 14/189 | 203/18,800 | 1.85 × 10⁻⁸ | 2.12 × 10⁻⁵ | 1.6036 |
| BP | GO:0042060 | Wound healing | 19/189 | 429/18,800 | 7.1 × 10⁻⁸ | 6.09 × 10⁻⁵ | 2.5236 |
| BP | GO:0034614 | Cellular response to reactive oxygen species | 11/189 | 147/18,800 | 2.86 × 10⁻⁷ | 0.0002 | 1.5076 |
| CC | GO:0022626 | Cytosolic ribosome | 20/193 | 102/19,594 | 1.12 × 10⁻²⁰ | 3.65 × 10⁻¹⁸ | −4.4721 |
| CC | GO:0044391 | Ribosomal subunit | 20/193 | 178/19,594 | 9.76 × 10⁻¹⁶ | 1.59 × 10⁻¹³ | −4.4721 |
| CC | GO:0022627 | Cytosolic small ribosomal subunit | 12/193 | 43/19,594 | 6.94 × 10⁻¹⁵ | 7.54 × 10⁻¹³ | −3.4641 |
| CC | GO:0030055 | Cell-substrate junction | 27/193 | 428/19,594 | 1.62 × 10⁻¹⁴ | 1.32 × 10⁻¹² | 0.57735 |
| CC | GO:0005925 | Focal adhesion | 26/193 | 419/19,594 | 7.58 × 10⁻¹⁴ | 4.94 × 10⁻¹² | 0.39223 |
| MF | GO:0003735 | Structural constituent of ribosome | 20/190 | 181/18,410 | 3.18 × 10⁻¹⁵ | 1.41 × 10⁻¹² | −4.4721 |
| MF | GO:0005200 | Structural constituent of cytoskeleton | 8/190 | 104/18,410 | 1.23 × 10⁻⁵ | 0.0027 | 1.4142 |
| MF | GO:0019838 | Growth factor binding | 8/190 | 139/18,410 | 9.88 × 10⁻⁵ | 0.0123 | 1.4142 |
| MF | GO:0038187 | Pattern recognition receptor activity | 4/190 | 26/18,410 | 0.0001 | 0.0123 | 2 |
| MF | GO:0048027 | mRNA 5′-UTR binding | 4/190 | 27/18,410 | 0.0002 | 0.0123 | −2 |
| KEGG | hsa05171 | Coronavirus disease – COVID-19 | 28/115 | 232/8,164 | 5.15 × 10⁻¹⁹ | 1.11 × 10⁻¹⁶ | −2.2678 |
| KEGG | hsa03010 | Ribosome | 20/115 | 158/8,164 | 3.91 × 10⁻¹⁴ | 4.2 × 10⁻¹² | −4.4721 |
| KEGG | hsa04216 | Ferroptosis | 7/115 | 41/8,164 | 1.39 × 10⁻⁶ | 9.93 × 10⁻⁵ | −0.37796 |
| KEGG | hsa05144 | Malaria | 7/115 | 50/8164 | 5.55 × 10⁻⁶ | 0.0003 | 2.6458 |
| KEGG | hsa04066 | HIF-1 signaling pathway | 8/115 | 109/8,164 | 0.0001 | 0.0061 | 0 |
Thereafter, RNA-seq data via the STAR pipeline along with clinical records were curated from TCGA-OV project in TCGA. The data processing method was as follows: log₂(value + 1). Spearman correlation analysis showed the following relationships with r value between RUNX1 and ferroptosis regulators: NFE2L2 (0.237, p < 0.001); PCBP2 (−0.218, p < 0.001); CYBB (r = 0.441, p < 0.001); STEAP3 (0.423, p < 0.001); and ACSL1 (0.610, p < 0.001). These results demonstrate statistically significant positive correlations of RUNX1 with NFE2L2, CYBB, STEAP3, and ACSL1, along with a negative correlation with PCBP2 in OSC patients (Figure 4c).
MTT assays revealed significantly reduced cell viability in RUNX1-knockdown groups vs NC shRNA controls (p < 0.01; Figure 2a), thereby indicating that RUNX1 depletion suppresses OSC cell proliferation. Consistently, EdU assays demonstrated markedly fewer EdU-positive cells in RUNX1-knockdown groups compared to controls (Figure 2b). Furthermore, clonogenic assays showed significant reduction in colony formation following RUNX1 knockdown vs NC shRNA-transfected cells (Figure 2c). These findings confirm that RUNX1 impairment diminishes clonogenic potential in SHIN-3 and OVCAR-3 cells. Collectively, RUNX1 knockdown inhibits OSC cell proliferation, thereby establishing its crucial role in regulating OSC cell growth and potential as a therapeutic target (Figure 5).
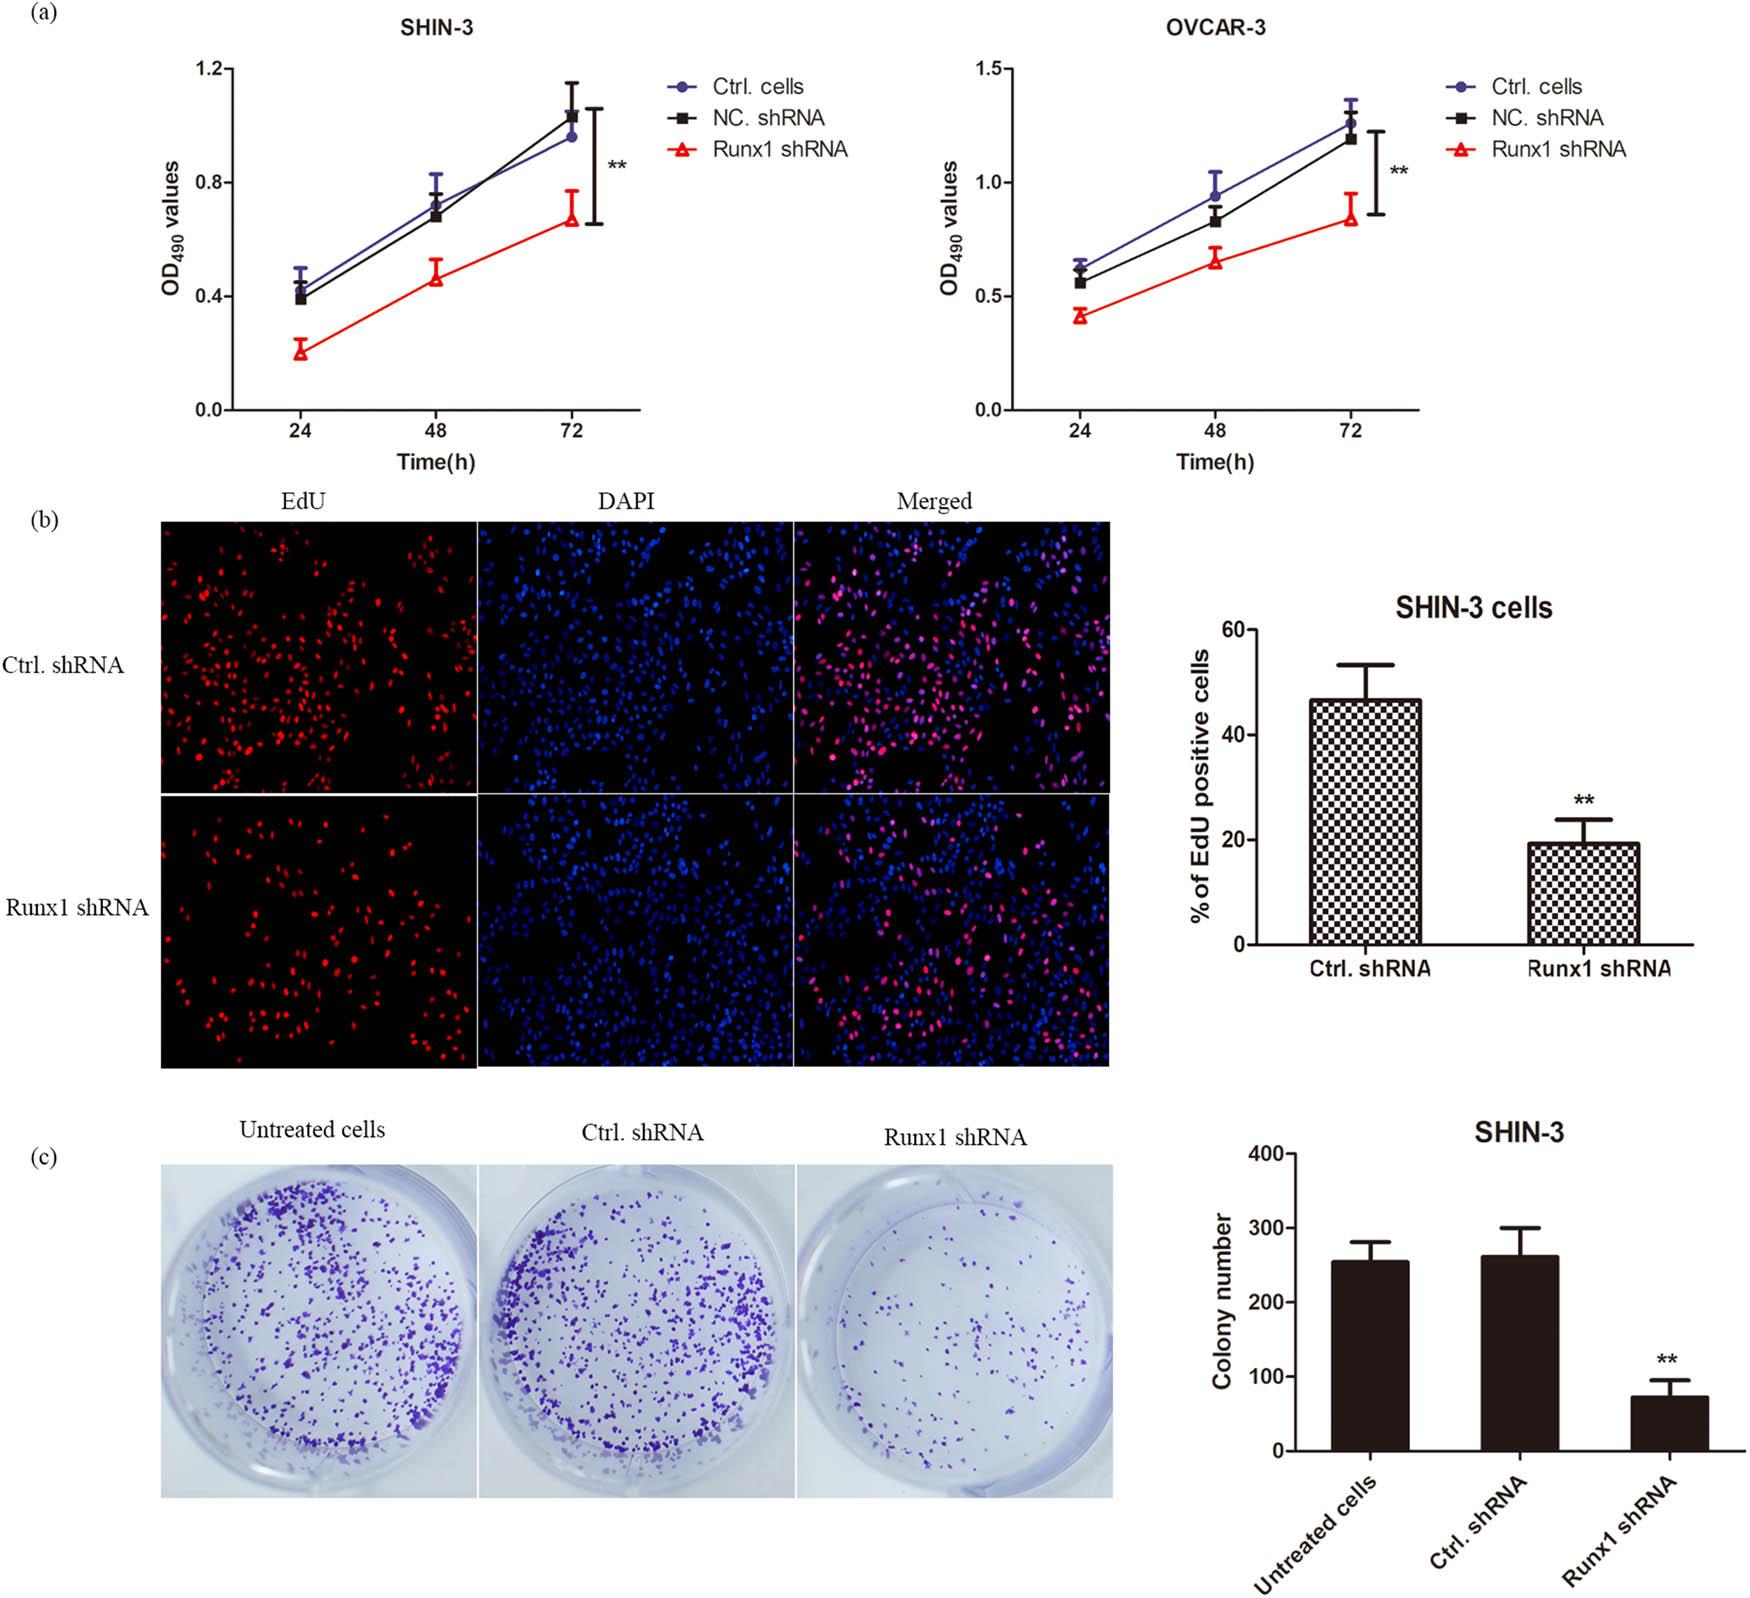
Knockdown of RUNX1 inhibits cell proliferation in SHIN-3 and OVCAR-3. (a) SHIN-3 and OVCAR-3 cells were infected with lentiviruses carrying RUNX1 shRNA or NC shRNA and assessed at 24, 48, and 72 h post-infection. Cell viability was measured by MTT assay following RUNX1 knockdown. Data are presented as mean value ± SD of at least three independent biological replicates, each with three replicates. Two-way analysis of variance (ANOVA) followed by Tukey s multiple comparisons test was used to compare the RUNX1 shRNA group with the NC shRNA group at each time point. **p < 0.01 vs NC shRNA group at each time point. (b) EdU incorporation assay with immunofluorescence staining. SHIN-3 cells infected with RUNX1 shRNA or NC shRNA lentiviruses were photographed to visualize EdU-positive cells at 48 h. Data are mean value ± SD from five randomly selected fields per well across three independent experiments. **p < 0.01. (c) Colony formation assay in RUNX1-knockdown SHIN-3 cells. Cells infected with RUNX1 shRNA or control shRNA lentiviruses were cultured for 2 weeks, with colonies (≥ 50 cells) counted and displayed. Data are mean value ± SD from three independent experiments, each performed in triplicates. **p < 0.01
MTT assays revealed that RUNX1 interference significantly promoted erastin-induced cell death compared to Ctrl.shRNA controls (**p < 0.01; Figure 6a). Additionally, SHIN-3 and OVCAR-3 cells treated with 2 or 10 µM erastin for 24 h demonstrated significantly reduced GSH levels following RUNX1 knockdown vs Ctrl.shRNA groups (**p < 0.01; Figure 6b). Consistently, MDA levels were markedly elevated in RUNX1-interfered cells relative to controls (Figure 6c). These results collectively revealed that RUNX1 knockdown potentiates erastin-induced ferroptosis in OSC cells.
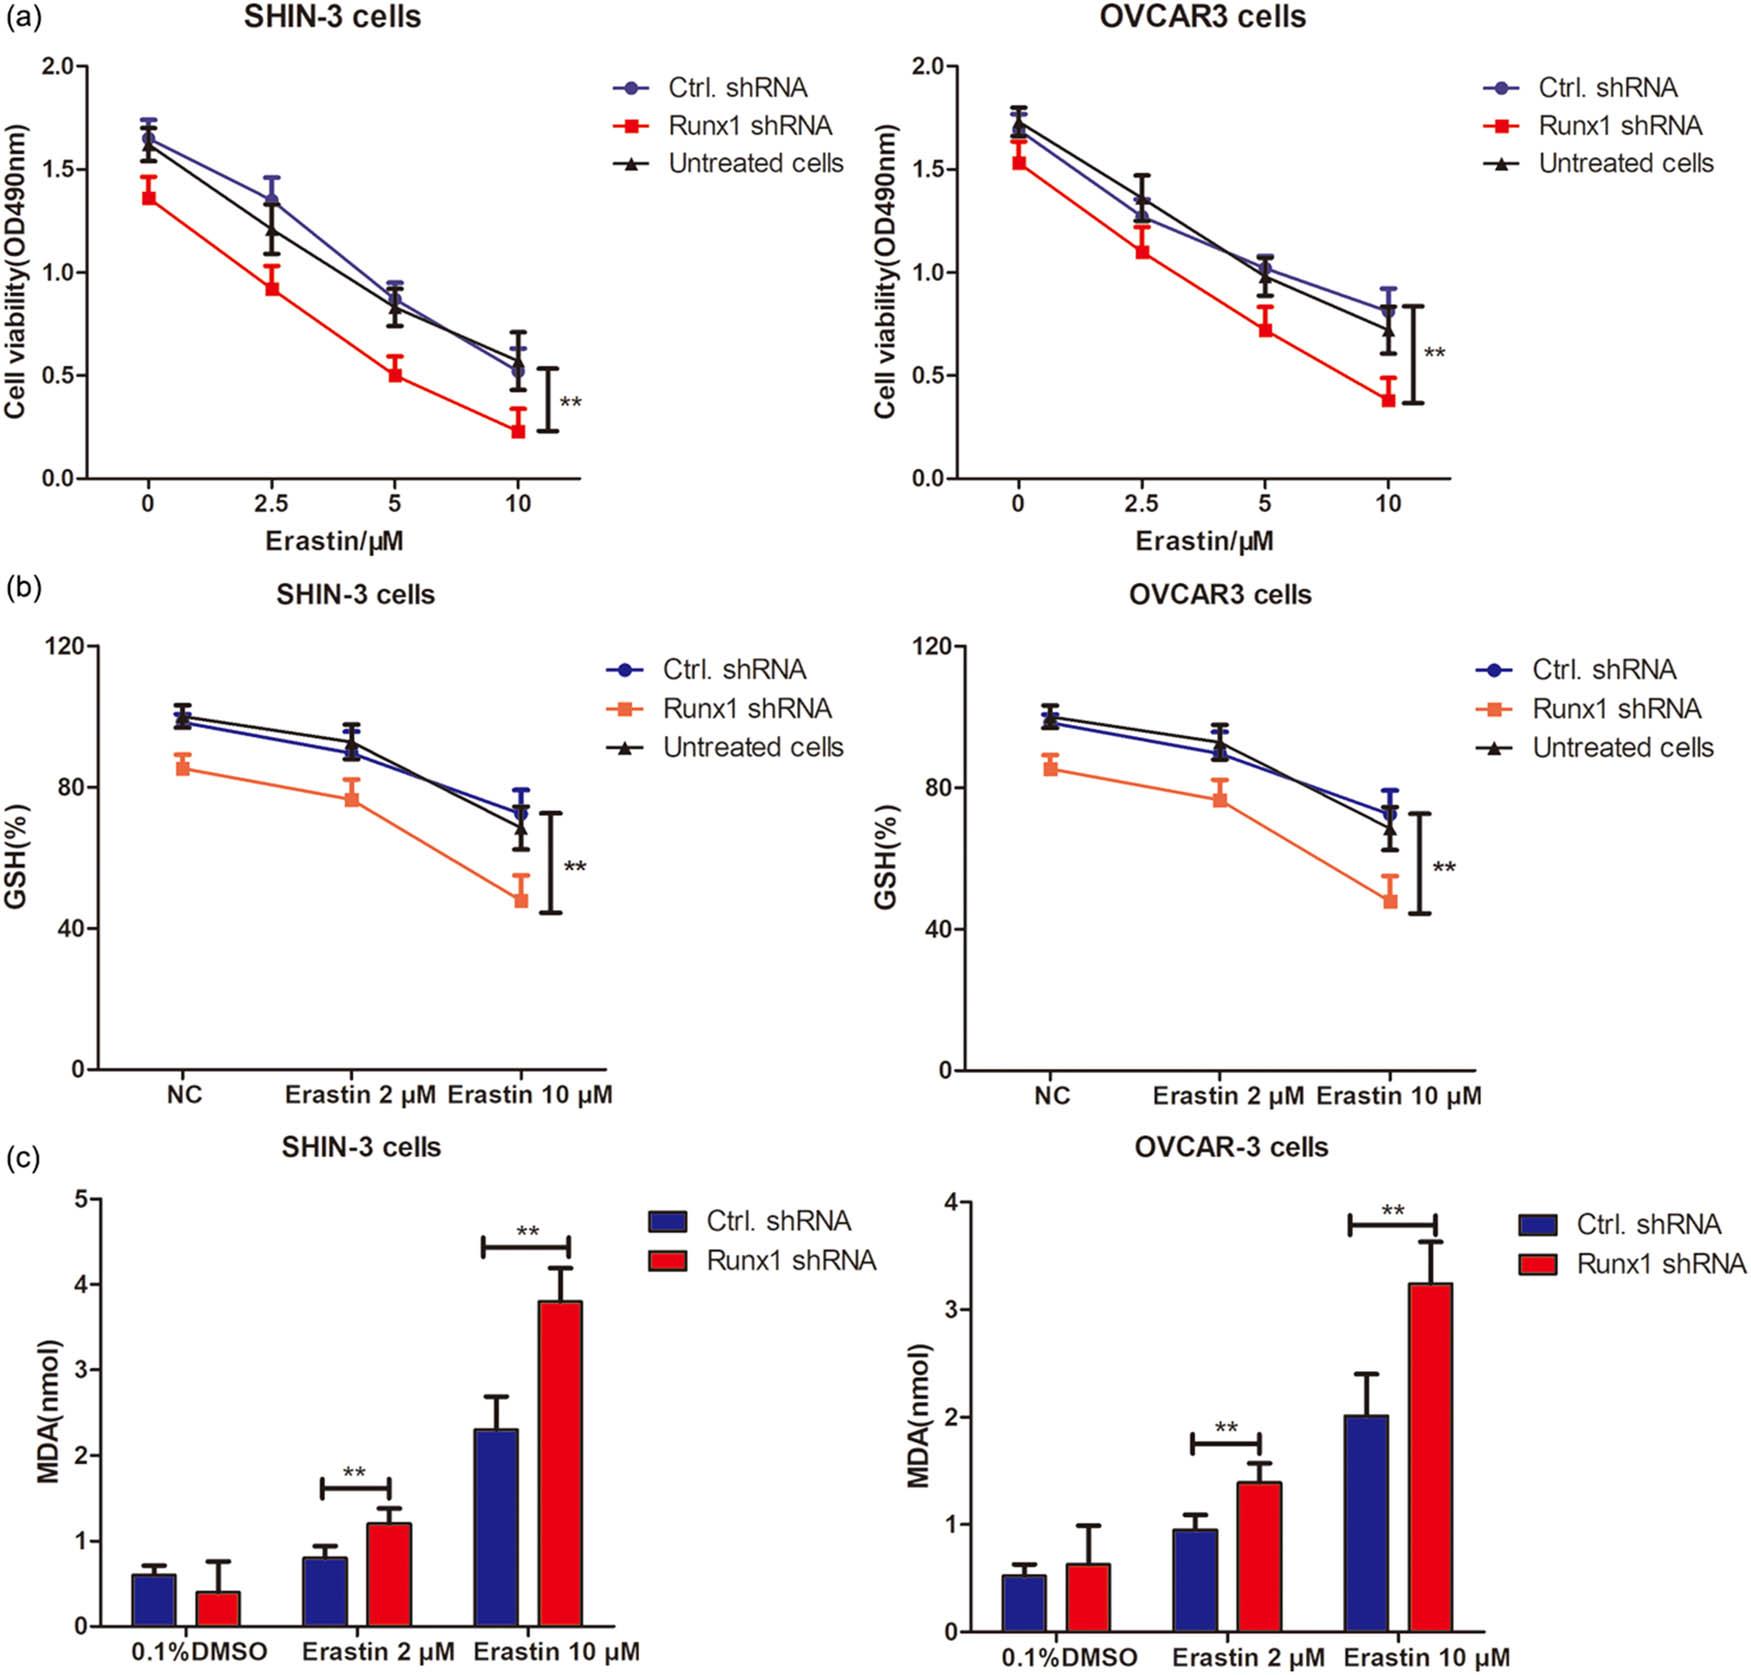
Knockdown of RUNX1 enhances erastin-induced ferroptosis in SHIN-3 and OVCAR-3 cells. (a) MTT assay. RUNX1 expression was knocked down by infection with RUNX1-specific shRNA lentiviral particles and treated with increasing erastin concentrations for 48 h. Viability was determined in RUNX1 shRNA or Ctrl.shRNA lentivirus-infected SHIN-3 and OVCAR-3 cells using MTT assay. Data are mean value ± SD of three independent experiments. **p < 0.01 vs Ctrl.shRNA group. (b) GSH production. RUNX1-specific shRNA or Ctrl.shRNA lentivirus-infected SHIN-3 and OVCAR-3 cells were treated with 2 or 10 μM erastin for 24 h. GSH production was measured as mentioned in Section 2. **p < 0.01 vs Ctrl.shRNA group. (c) MDA production. RUNX1-specific shRNA or Ctrl.shRNA lentivirus-infected SHIN-3 and OVCAR-3 cells were treated with 10 μM erastin for 24 h. **p < 0.01 vs Ctrl.shRNA group
OSC remains a lethal malignancy, due to the absence of reliable prognostic biomarkers [25,26]. Here we identified RUNX1 to be a key player in OSC pathogenesis. Our principal findings demonstrate that: (1) RUNX1 is significantly overexpressed in OSC tissues and serves as an independent prognostic factor predictive of poor OS; (2) RUNX1 knockdown potently inhibits cell proliferation and clonogenic ability; and (3) RUNX1 mechanistically confers resistance to ferroptosis – a recently characterized form of regulated cell death – likely through modulation of the Nrf2 signaling pathway (Figure 7).
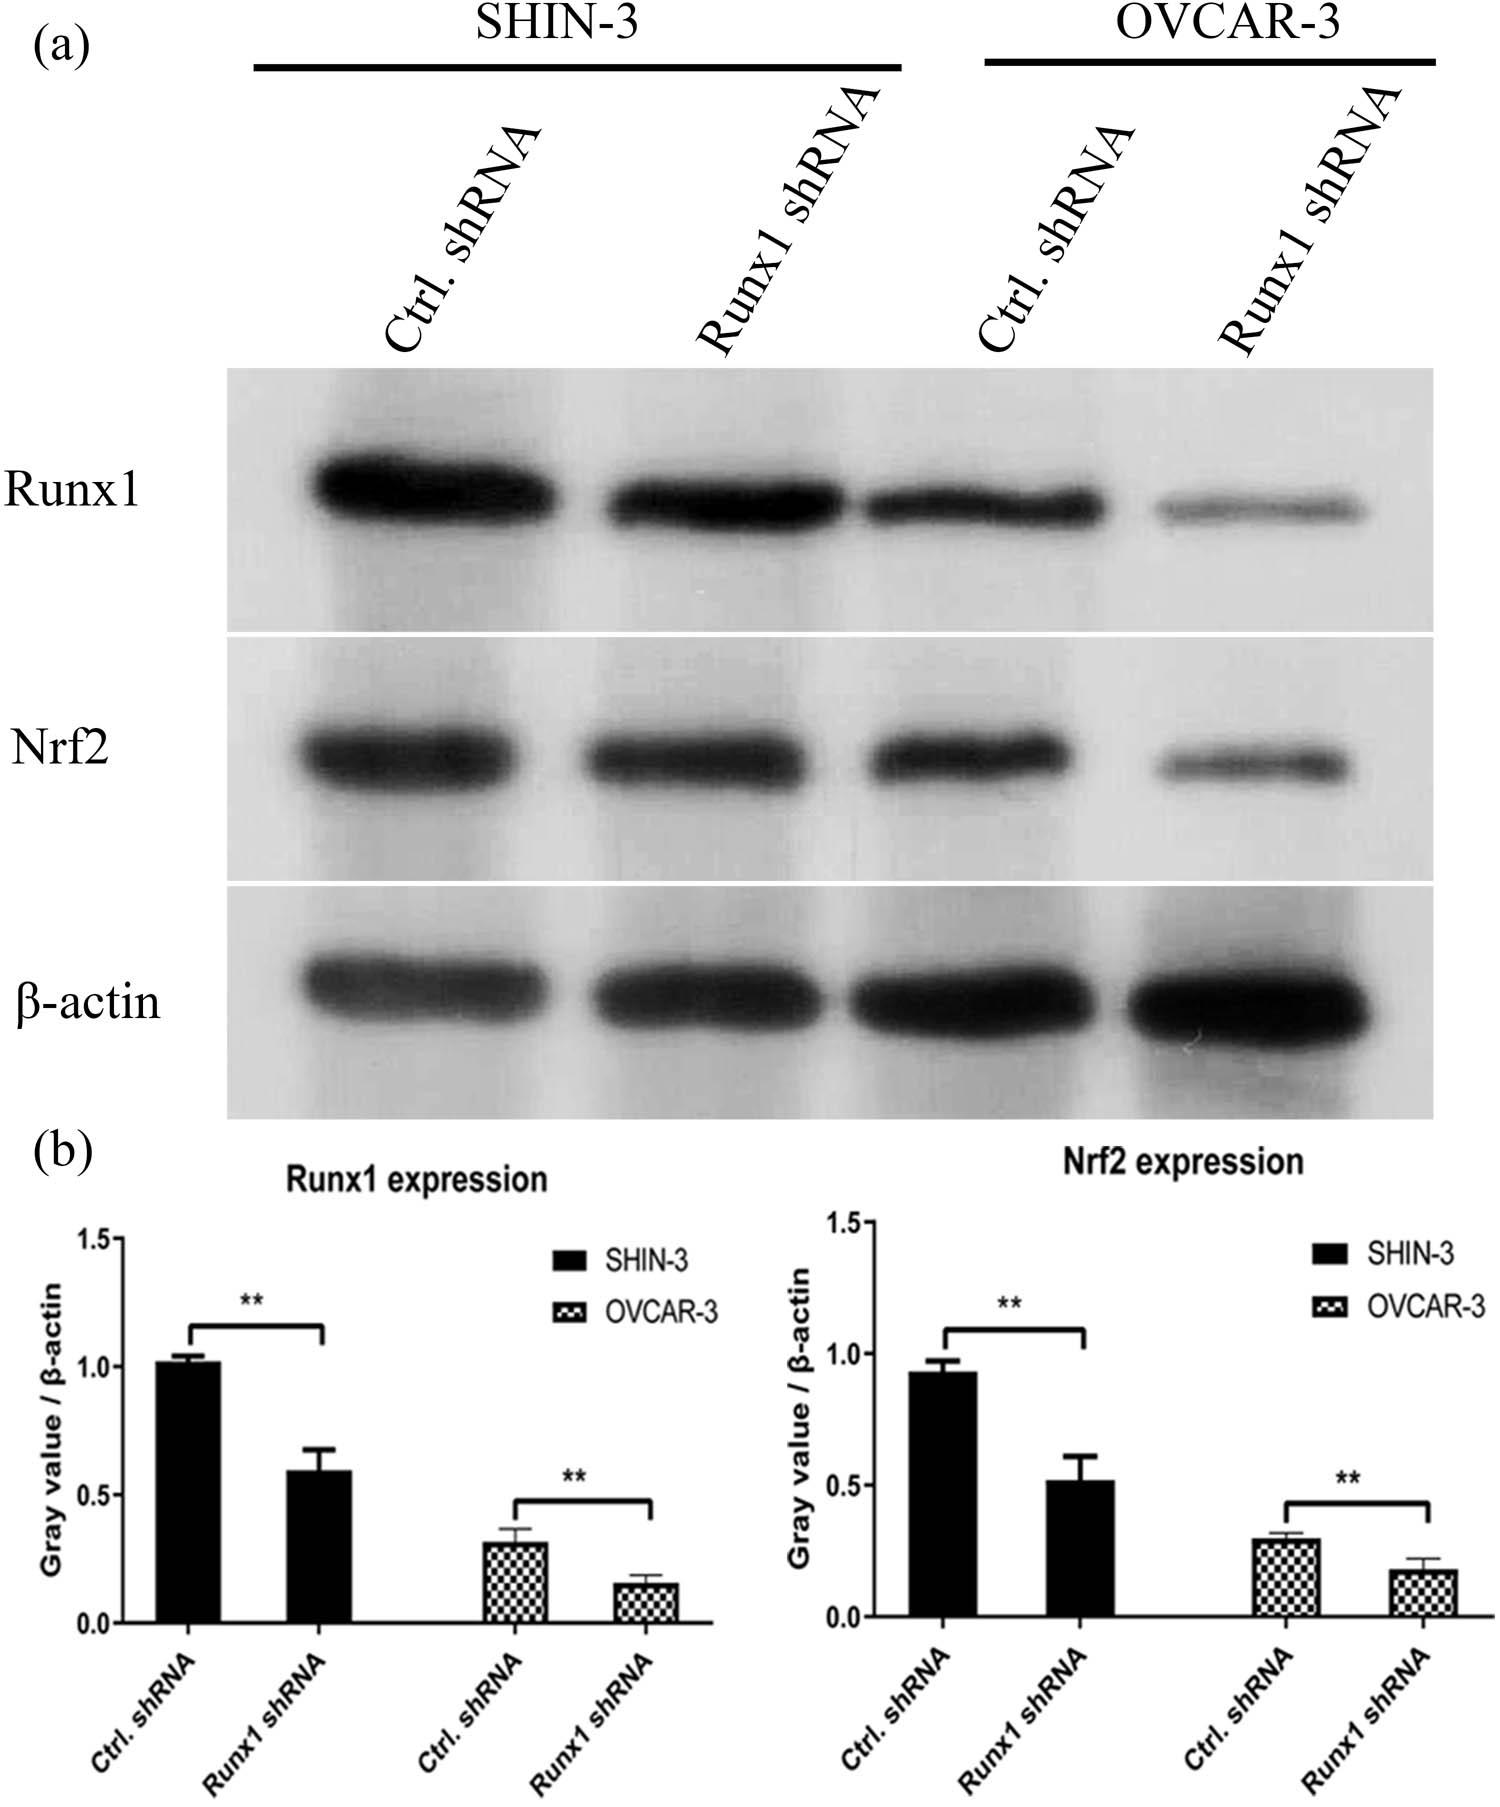
Western blotting analysis. (a) SHIN-3 cells were infected with RUNX1 shRNA or control shRNA lentiviruses for 24 h. (b) The relative expression of RUNX1 was shown in histogram. **p < 0.01, compared with NC ShRNA
The role of RUNX1 as an oncogene has been documented in various malignancies [27,28,29,30,31]. However, it is noteworthy that RUNX1 exhibits context-dependent roles in cancer biology, while acting as a tumor suppressor in certain contexts [32,33], such as some subtypes of breast cancer [34] and gastric cancer [35]. This duality underscores the complexity of its function and highlights that its role is likely dictated by cellular context, genetic background, and tumor microenvironment. Our data consistently point to an oncogenic function for RUNX1 in OSC. Till now, its function in OSC – particularly its link to ferroptosis – has been largely unexplored. Our discovery that RUNX1 expression negatively correlates with ferroptosis sensitivity extends the known oncogenic functions of RUNX1 and positions it as a central regulator of cell death mechanisms in ovarian cancer. This finding aligns with emerging evidence that transcription factors can dictate cancer cell fate by modulating ferroptosis sensitivity [36,37]. Specifically, our observation that RUNX1 depletion reduces GSH levels, increases lipid peroxidation (MDA), and attenuates Nrf2 protein expression provides a plausible mechanistic link. The transcription factor Nrf2 is a master regulator of the antioxidant response, and its activation is a well-established mechanism for ferroptosis resistance in many cancers [38,39,40]. Our data suggest that RUNX1 may act upstream of Nrf2, potentially regulating its stability or transcription, though the exact molecular interplay requires further elucidation. This hypothesis is strengthened by the positive correlation between RUNX1 and NFE2L2 (Nrf2) expression in the TCGA-OV cohort.
First, the robust association between high RUNX1 expression and adverse prognosis highlights its potential clinical utility as a biomarker to stratify patients into high-risk groups who might benefit from more aggressive or novel therapeutic strategies. Second, and perhaps more importantly, our results unveil a therapeutic vulnerability. By demonstrating that RUNX1 knockdown sensitizes OSC cells to erastin-induced ferroptosis, we provide a strong rationale for targeting RUNX1 to overcome chemoresistance. This strategy could be particularly effective for tumors exhibiting high RUNX1 expression, and potentially offer a new path for treating recalcitrant or recurrent disease.
In conclusion, our study integrates bioinformatic analysis with functional experiments to establish RUNX1 as a novel prognostic biomarker and a critical regulator of ferroptosis in OSC. We propose a model whereby RUNX1 overexpression promotes tumor progression by enhancing proliferative capacity and conferring resistance to ferroptotic cell death, potentially via the Nrf2 pathway. Therefore, targeting the RUNX1-ferroptosis axis may represent a promising new therapeutic strategy for a cancer that is in urgent need of innovative treatment options.
Despite these compelling findings, our study has several limitations that must be acknowledged. First, the mechanistic link between RUNX1 and Nrf2, while strongly supported by our correlative data and western blot analysis, remains inferential. Future studies employing ChIP assays are necessary to determine whether RUNX1 directly transcriptionally regulates NFE2L2 or interacts with the Nrf2 protein. Second, the dependency on erastin warrants investigation with other ferroptosis inducers (e.g., RSL3, FIN56) to confirm that the observed effect is a generalizable ferroptotic phenomenon and not specific to system Xc- inhibition. Finally, the in vivo relevance of RUNX1-mediated ferroptosis suppression remains to be validated in animal models, which would be a critical step toward therapeutic development.
While this study employed rigorous bioinformatic and experimental validation, several methodological considerations related to statistical analysis warrant acknowledgment. First, our statistical strategy for biomarker discovery involved a two-stage process. The initial genome-wide screening employed univariate Cox regression without multiple testing correction to minimize the risk of Type II errors (false negatives) during hypothesis generation. While this is a common practice in exploratory genomics, it inherently increases the probability of false positives, which we aimed to mitigate through subsequent rigorous validation in multivariate models. Second, our initial survival analyses dichotomized RUNX1 expression using the median value, which is a standard and reproducible approach for intuitive visualization and comparative analysis. Nonetheless, we recognize that dichotomization can lead to information loss. To ensure the robustness of our findings against this choice, we conducted supplementary analyses using a data-driven optimal cut-point (maximally selected rank statistics) and modeled RUNX1 as a continuous variable. The consistent, statistically significant association between elevated RUNX1 expression and poor survival across all methods confirms that our central conclusion is not an artifact of the dichotomization threshold. Future prospective studies with predefined clinical assays would benefit from further optimization and validation of a standardized cut-off point in independent cohorts.
Chengju Zhang designed the experimental assay, did the statistical analysis, and wrote the manuscript draft. Deng He and Yu Zhou performed the bioinformation analysis and western blotting analysis. Tiantian Feng, Shangqi Ni, and Hu Wang did the transfection assay and tested the GSH and MDA levels. Nenghuan Tang and Xi Wang helped to perform bioinformation analysis and wrote the manuscript.
Chengju Zhang https://orcid.org/0009-0000-2849-5816
Deng He https://orcid.org/0009-0002-9090-5382
Yu Zhou https://orcid.org/0009-0001-2646-3172
Tiantian Feng https://orcid.org/0009-0003-4929-3932
Nenghuan Tang https://orcid.org/0009-0005-1745-0205
Hu Wang https://orcid.org/0009-0000-4699-5523
Shangqi Ni https://orcid.org/0009-0003-4929-3932
The authors have no potential conflicts of interest to declare.