
Figure 1
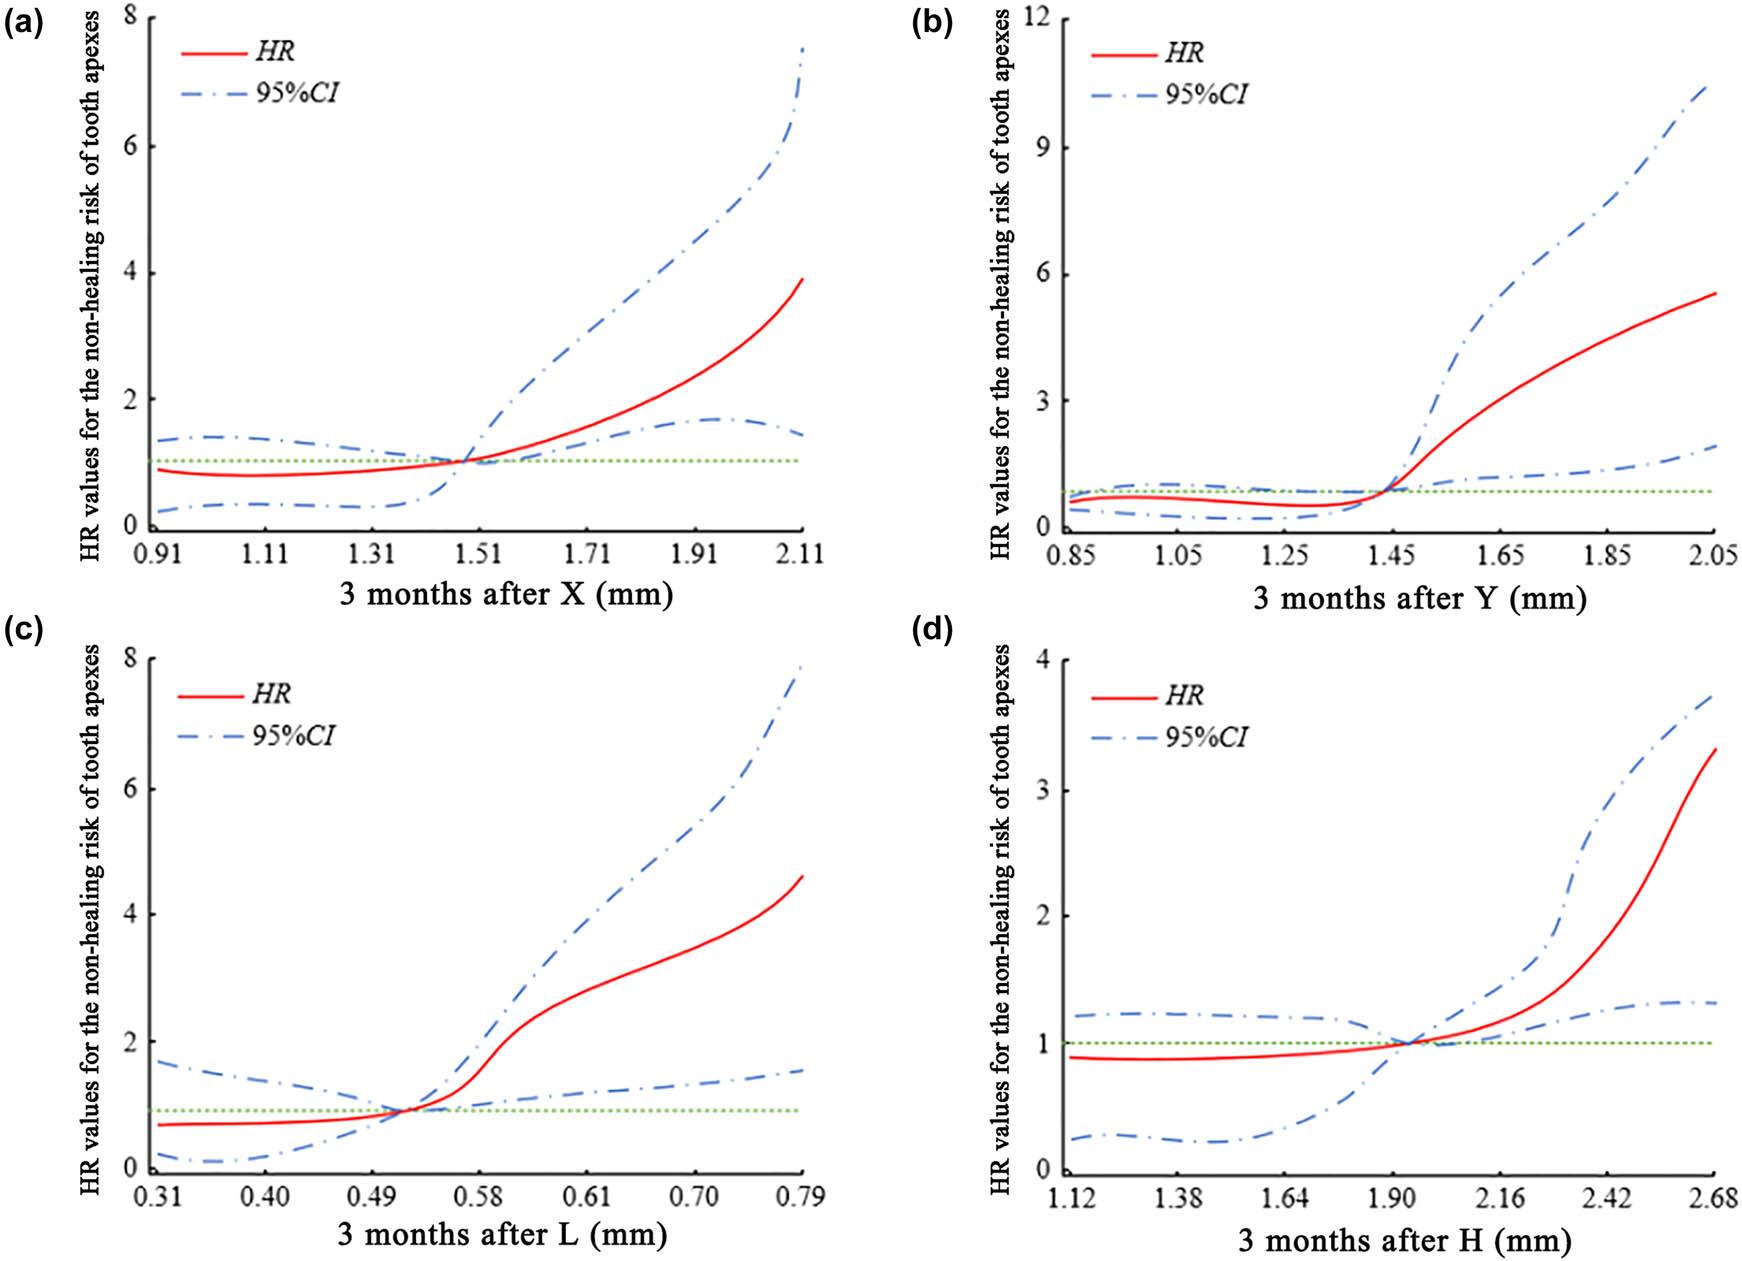
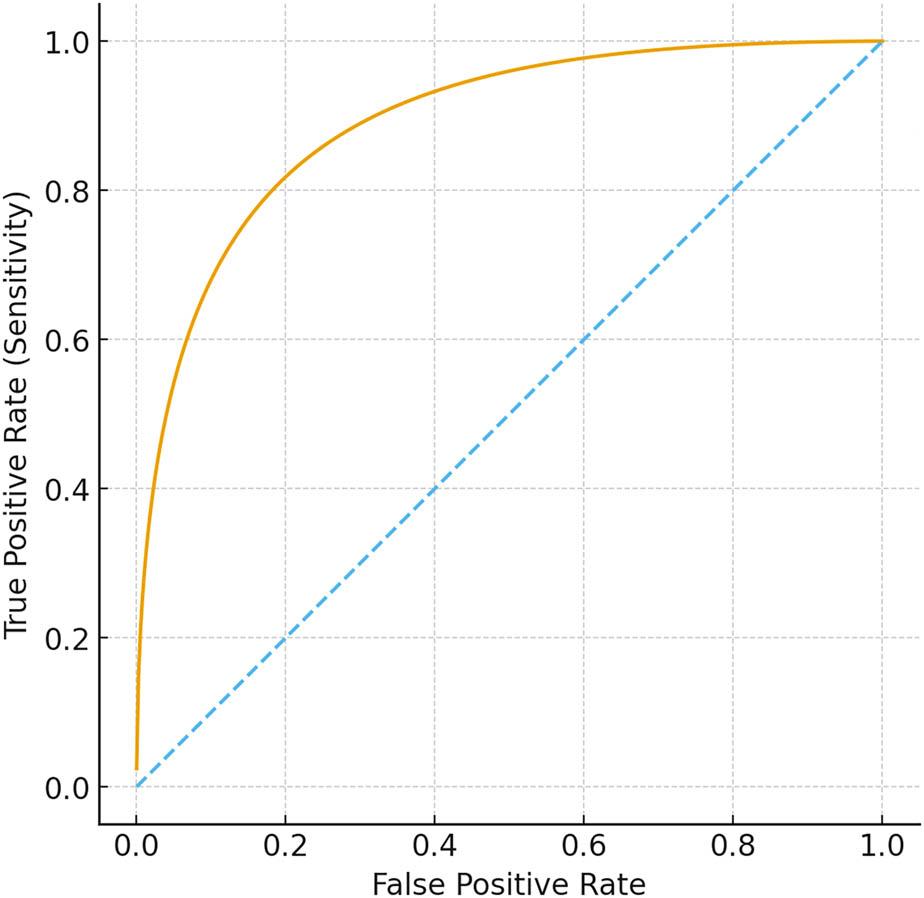
Figure 2
Clinical data of the two groups of patients
| Group | Healed (n = 74) | Unhealed (n = 26) | t/χ 2 | p |
|---|---|---|---|---|
| Gender, n (%) | 0.041 | 0.84 | ||
| Male | 41 (55.41) | 15 (57.69) | ||
| Female | 33 (44.59) | 11 (42.31) | ||
| Age (year) | 42.58 ± 6.82 | 43.02 ± 7.11 | 0.28 | 0.78 |
| Body mass index (kg/m2) | 22.86 ± 2.02 | 23.18 ± 1.14 | 0.764 | 0.446 |
| Course of disease (month) | 5.62 ± 1.13 | 5.81 ± 1.22 | 0.722 | 0.472 |
| Jaw position, n (%) | 0.094 | 0.76 | ||
| Upper jaw | 43 (58.11) | 16 (61.54) | ||
| Lower jaw | 31 (41.89) | 10 (38.46) | ||
| Tooth position, n (%) | 1.385 | 0.5 | ||
| Anterior tooth | 27 (36.49) | 8 (30.77) | ||
| Premolar | 25 (33.78) | 7 (26.92) | ||
| Molar | 22 (29.73) | 11 (42.31) | ||
| PAI grade, n (%) | 4.168 | 0.124 | ||
| Grade 3 | 22 (29.73) | 5 (19.23) | ||
| Grade 4 | 38 (51.35) | 11 (42.31) | ||
| Grade 5 | 14 (18.92) | 10 (38.46) | ||
| Plaque index (point) | 1.65 ± 0.48 | 1.81 ± 0.55 | 1.407 | 0.163 |
| Gingival index (point) | 2.24 ± 0.79 | 2.41 ± 0.86 | 0.922 | 0.359 |
| Number of root canals, n (%) | 3.015 | 0.221 | ||
| Single | 28 (37.84) | 5 (19.23) | ||
| Double | 20 (27.03) | 9 (34.62) | ||
| Multiple | 26 (35.14) | 12 (46.15) | ||
| Coronal restoration materials, n (%) | 4.582 | 0.032 | ||
| Resin | 49 (66.22) | 11 (42.31) | ||
| Inlay | 25 (33.78) | 15 (57.69) | ||
| Root canal filling time (s) | 81.42 ± 13.56 | 82.78 ± 12.95 | 0.445 | 0.657 |
| Root canal filling status, n (%) | 0.001a | |||
| ≤2 mm | 65 (87.84) | 15 (57.69) | ||
| >2 mm | 8 (10.81) | 7 (26.92) | ||
| Overfilling | 1 (1.35) | 4 (15.38) | ||
| Repair status, n (%) | 0.434a | |||
| Nonrepair | 16 (21.62) | 8 (30.77) | ||
| Postrepair | 23 (31.08) | 4 (15.38) | ||
| Porcelain crown | 17 (22.97) | 6 (23.08) | ||
| Composite crown | 18 (24.32) | 8 (30.77) | ||
| Coronal microleakage, n (%) | 9.591 | 0.002 | ||
| No | 46 (62.16) | 7 (26.92) | ||
| Yes | 28 (37.84) | 19 (73.08) | ||
| Secondary caries, n (%) | 1.206 | 0.272 | ||
| No | 66 (89.19) | 21 (80.77) | ||
| Yes | 8 (10.81) | 5 (19.23) | ||
| Instrument fracture, n (%) | 10.534 | 0.001 | ||
| No | 59 (79.73) | 12 (46.15) | ||
| Yes | 15 (20.27) | 14 (53.85) | ||
| Retreatment during follow-up, n (%) | 4.476 | 0.034 | ||
| No | 46 (62.16) | 9 (34.62) | ||
| Yes | 28 (37.84) | 15 (57.69) |
Performance of prediction model at different probability levels on non-healing of tooth apexes after root canal treatment
| Probability | Accuracy (%) | Sensitivity (%) | Specificity (%) | False positive rate (%) | False negative rate (%) | Youden index |
|---|---|---|---|---|---|---|
| 0.95 | 78.1 | 90.0 | 75.7 | 24.3 | 10.0 | 0.657 |
| 0.9 | 84.5 | 88.5 | 83.8 | 16.2 | 11.5 | 0.723 |
| 0.85 | 87.3 | 85.9 | 88.4 | 11.6 | 14.1 | 0.734 |
| 0.8 | 88.9 | 81.5 | 91.2 | 8.8 | 18.5 | 0.727 |
| 0.75 | 90.0 | 78.1 | 93.2 | 6.8 | 21.9 | 0.714 |
| 0.7 | 90.4 | 76.9 | 94.0 | 6.0 | 23.1 | 0.709 |
| 0.65 | 90.6 | 75.0 | 94.9 | 5.1 | 25.0 | 0.700 |
| 0.6 | 90.1 | 72.0 | 95.3 | 4.7 | 28.0 | 0.673 |
| 0.55 | 90.5 | 69.2 | 96.0 | 4.0 | 30.8 | 0.653 |
| 0.5 | 90.0 | 65.4 | 96.6 | 3.4 | 34.6 | 0.620 |
| 0.45 | 89.7 | 62.5 | 96.8 | 3.2 | 37.5 | 0.593 |
| 0.4 | 89.0 | 60.0 | 97.0 | 3.0 | 40.0 | 0.570 |
| 0.35 | 88.5 | 57.7 | 97.3 | 2.7 | 42.3 | 0.550 |
| 0.3 | 87.8 | 55.0 | 97.5 | 2.5 | 45.0 | 0.525 |
| 0.25 | 87.0 | 52.0 | 97.8 | 2.2 | 48.0 | 0.498 |
| 0.2 | 85.6 | 48.0 | 98.1 | 1.9 | 52.0 | 0.460 |
| 0.15 | 83.2 | 42.0 | 98.6 | 1.4 | 58.0 | 0.406 |
| 0.1 | 81.0 | 30.0 | 99.1 | 0.9 | 70.0 | 0.291 |
| 0.05 | 78.6 | 10.0 | 99.6 | 0.4 | 90.0 | 0.106 |
Periapical radiograph signs before and after treatment (x ± s, mm)
| Group | n | X | |||
|---|---|---|---|---|---|
| Before treatment | 3 months after treatment | 6 months after treatment | 12 months after treatment | ||
| Healed | 74 | 2.65 ± 0.74 | 1.31 ± 0.41* | 0.89 ± 0.33*# | 0.37 ± 0.11*#△ |
| Unhealed | 26 | 2.72 ± 0.81 | 1.62 ± 0.49* | 1.24 ± 0.42*# | 0.66 ± 0.24*#△ |
| t | 0.405 | 3.149 | 4.323 | 8.262 | |
| P | 0.686 | 0.002 | <0.001 | <0.001 | |
Multicollinearity test results
| Indicator | Tolerance | Variance inflation factor |
|---|---|---|
| Coronal restoration materials | 0.216 | 4.63 |
| Root filling status | 0.384 | 2.604 |
| Coronal microleakage | 0.275 | 3.636 |
| Instrument fracture | 0.421 | 2.375 |
| Retreatment | 0.506 | 1.976 |
| X at 3 months after treatment | 0.372 | 2.688 |
| Y at 3 months after treatment | 0.481 | 2.079 |
| L at 3 months after treatment | 0.515 | 1.942 |
| H at 3 months after treatment | 0.602 | 1.661 |
Factors contributing to non-healing of tooth apexes in patients analyzed using multivariate logistic regression model
| Indicator | β | SE | Wald χ 2 | p | OR (95%CI) |
|---|---|---|---|---|---|
| Coronal restoration materials | |||||
| Resin (reference) | 1 | ||||
| Inlay | 1.123 | 0.536 | 4.387 | 0.011 | 3.074 (1.075–8.790) |
| Root filling status | <0.001 | ||||
| ≤2 mm (reference) | 1 | ||||
| >2 mm | 1.328 | 0.472 | 7.911 | <0.001 | 3.773 (1.496–9.517) |
| Overfilling | 1.363 | 0.501 | 7.396 | <0.001 | 3.908 (1.464–10.433) |
| Coronal microleakage | |||||
| No (reference) | 1 | ||||
| Yes | 1.437 | 0.425 | 11.425 | <0.001 | 4.208 (1.829–9.679) |
| Instrument fracture | |||||
| No (reference) | 1 | ||||
| Yes | 0.936 | 0.611 | 2.345 | 0.032 | 2.550 (0.770–8.445) |
| Retreatment | |||||
| No (reference) | 1 | ||||
| Yes | −0.875 | 0.624 | 1.965 | 0.039 | 0.417 (0.123–1.416) |
| X at 3 months after treatment | 1.048 | 0.563 | 3.465 | 0.017 | 2.852 (0.946–8.598) |
| Y at 3 months after treatment | 1.266 | 0.528 | 5.747 | 0.002 | 3.547 (1.260–9.983) |
| Lat 3 months after treatment | 0.97 | 0.582 | 2.778 | 0.025 | 2.638 (0.843–8.254) |
| Hat 3 months after treatment | 0.685 | 0.657 | 1.086 | 0.046 | 1.984 (0.547–7.190) |
Validation of stability of prediction model through crossing method
| Accuracy (%) | Sensitivity (%) | Specificity (%) | False positive rate (%) | False negative rate (%) | |
|---|---|---|---|---|---|
| Model (cut-off = 0.85) | 87.3 | 85.9 | 88.4 | 11.6 | 14.1 |
| Bootstrap internal validation (1,000 resamples) | 86.8 | 84.9 | 88.0 | 12.0 | 15.1 |