
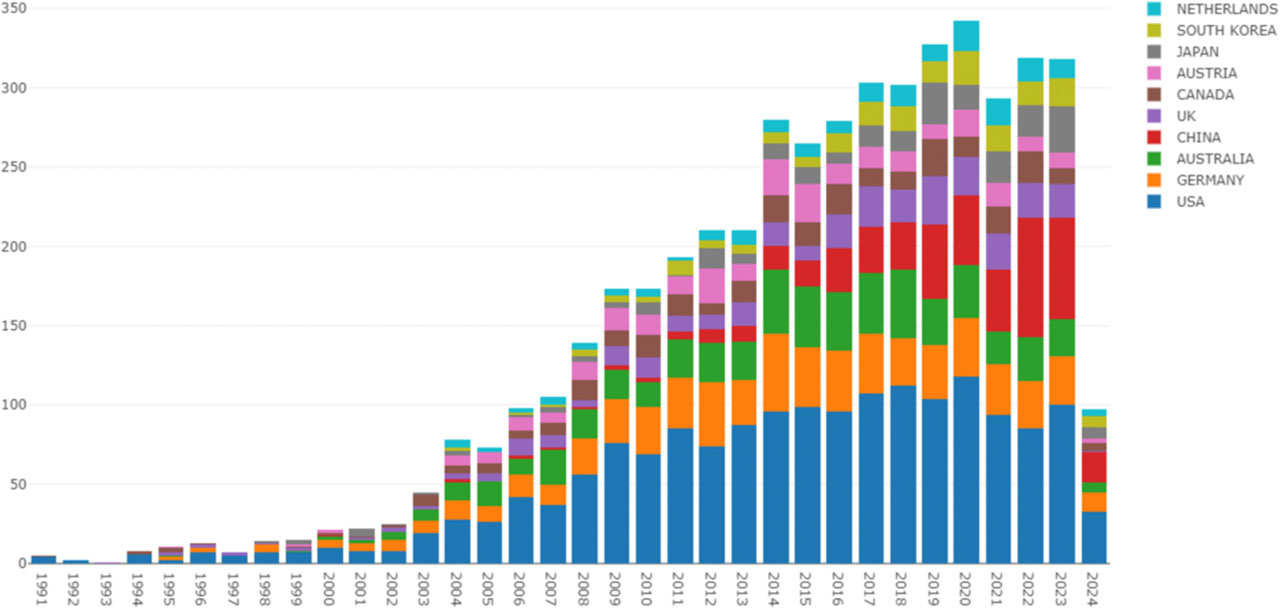
Figure 1.
Total number of communications by country
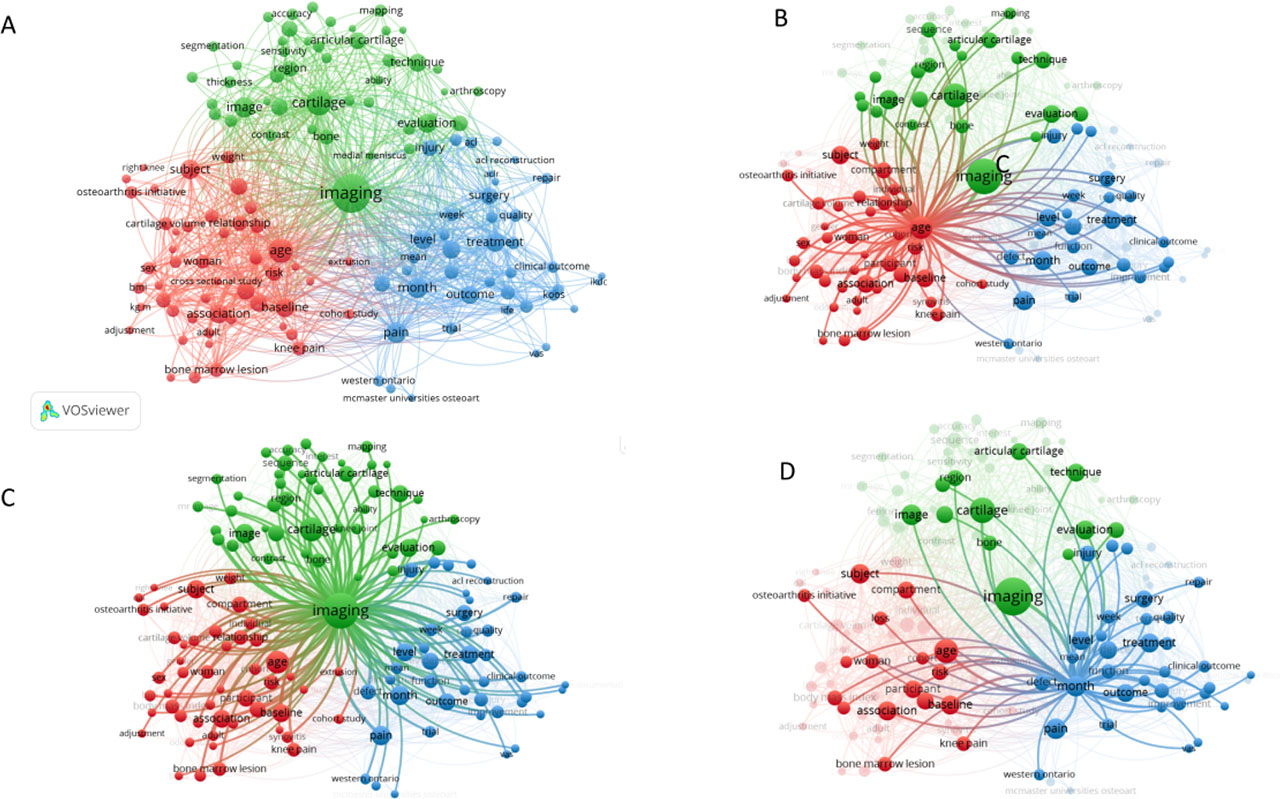
Figure 2.
Cluster analysis of all items (A. total clustering results; B. item situation of cluster1; C. item situation of cluster2; D. item situation of cluster3)
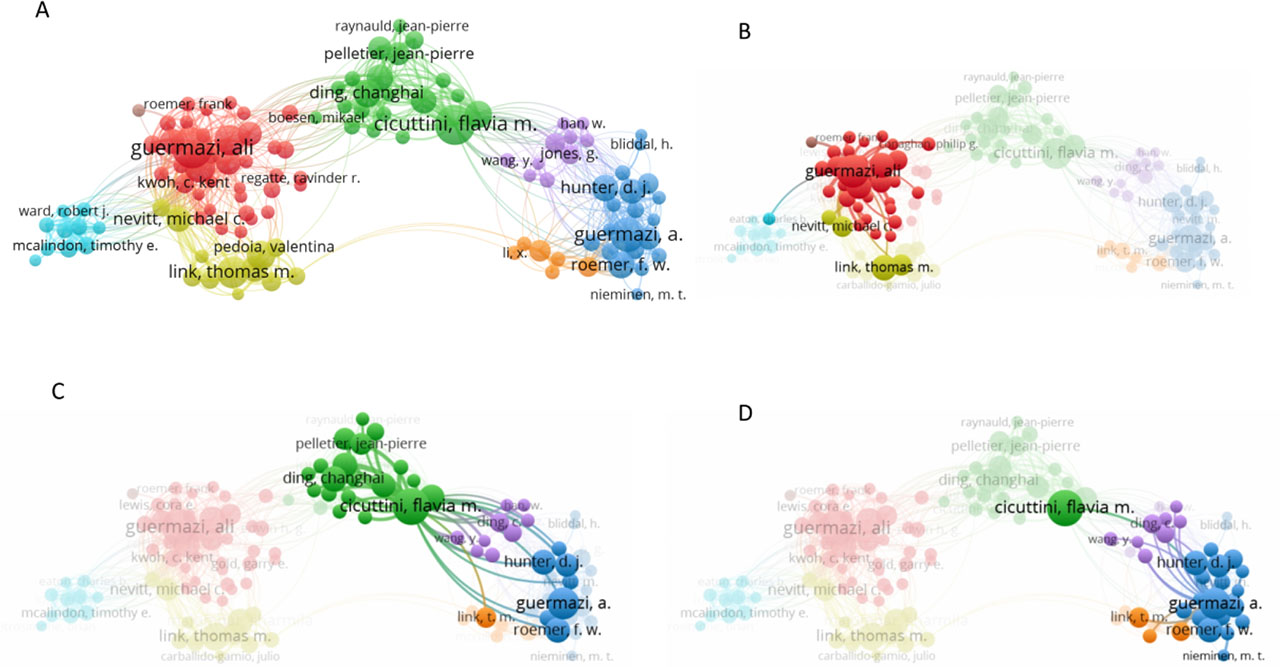
Figure 3.
Results of the Co-authorship analysis-author(A. Cluster analysis results of Co-authorship analysis; B. Co-authorship in Cluster1; C. Co-authorship in Cluster2; D. Co-authorship in Cluster3)
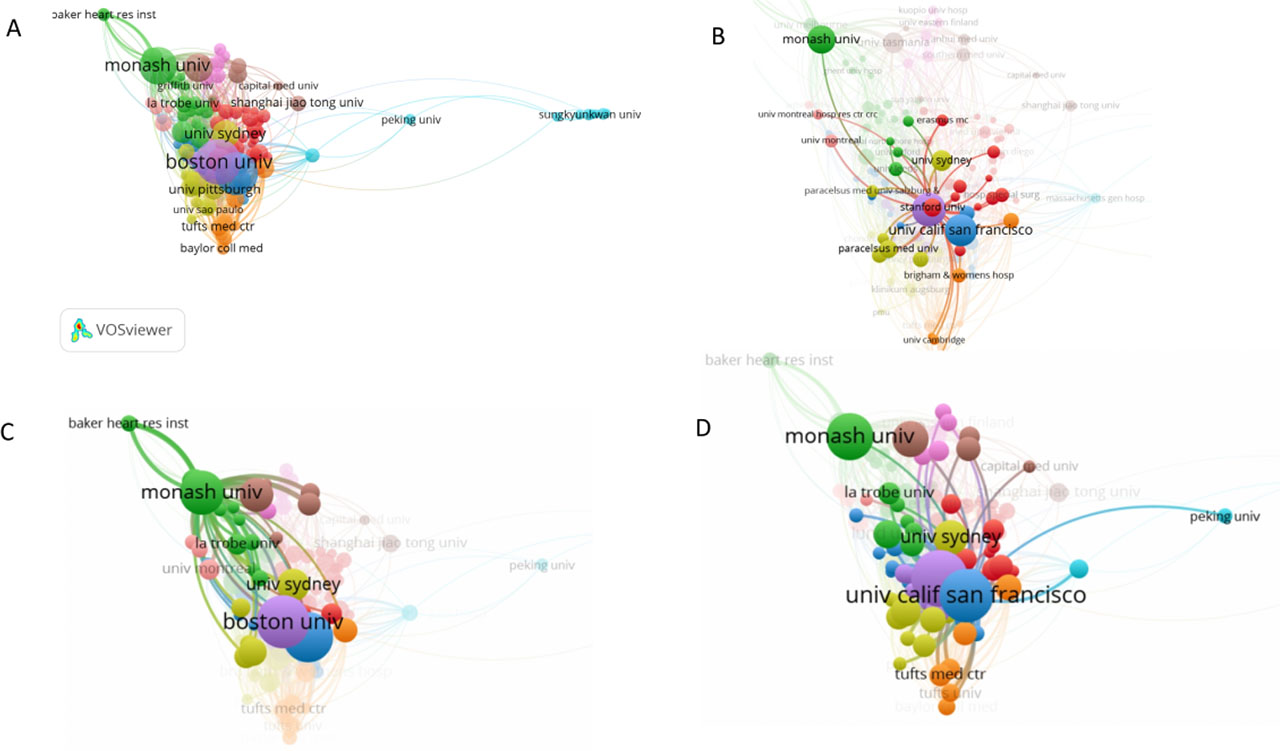
Figure 4.
Results of Co-authorship analysis-organizations (A. A visualization of the 10 clusters; B. Cluster 1: Stanford University (Documents = 110, Links = 62, Total Link Strength = 158); C. Cluster 2: Monash University (Documents = 265, Links = 51, Total Link Strength = 526); D. Cluster 3: University of California, San Francisco (Documents = 347, Links = 87, Total Link Strength = 738)
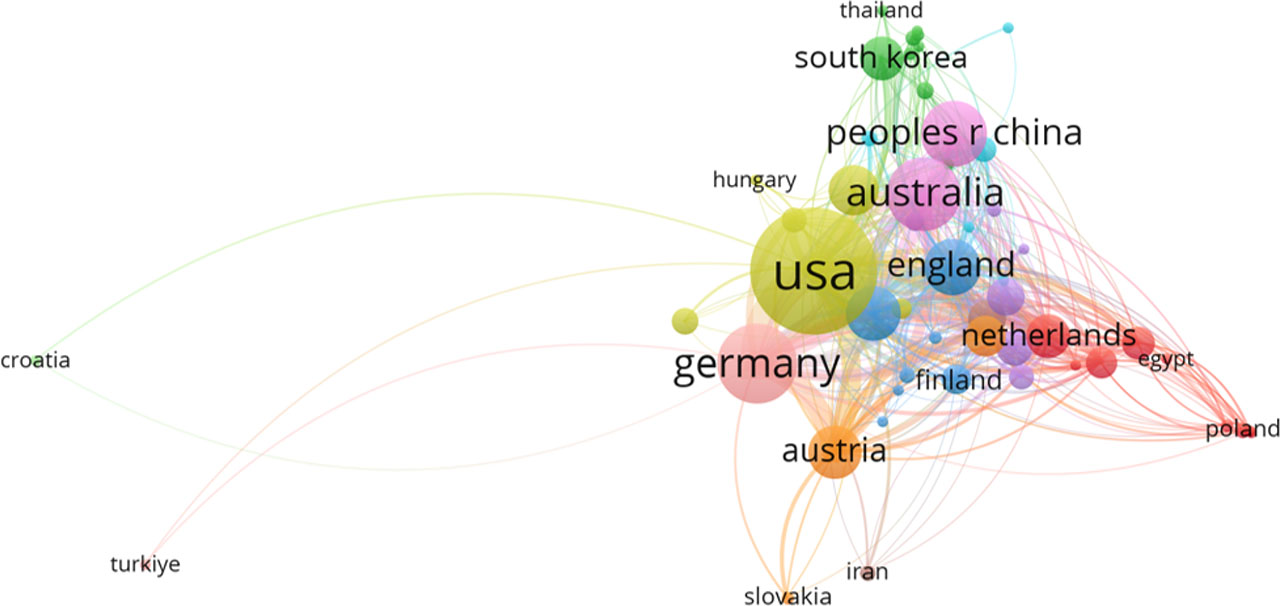
Figure 5.
Results of Co-authorship analysis-countries
Table 1.
Results of Co-occurrence analysis based on all keywords
| label | cluster | Weight Occurrences | Score Avg. citations |
|---|---|---|---|
| osteoarthritis | 3 | 2129 | 30.99 |
| knee | 2 | 1186 | 28.38 |
| mri | 3 | 1107 | 31.23 |
| articular-cartilage | 3 | 1014 | 38.10 |
| magnetic resonance imaging | 1 | 958 | 26.49 |
| cartilage | 3 | 847 | 31.98 |
| knee osteoarthritis | 1 | 800 | 28.88 |
| pain | 1 | 456 | 31.20 |
| joint | 4 | 442 | 42.33 |
| progression | 1 | 434 | 36.00 |
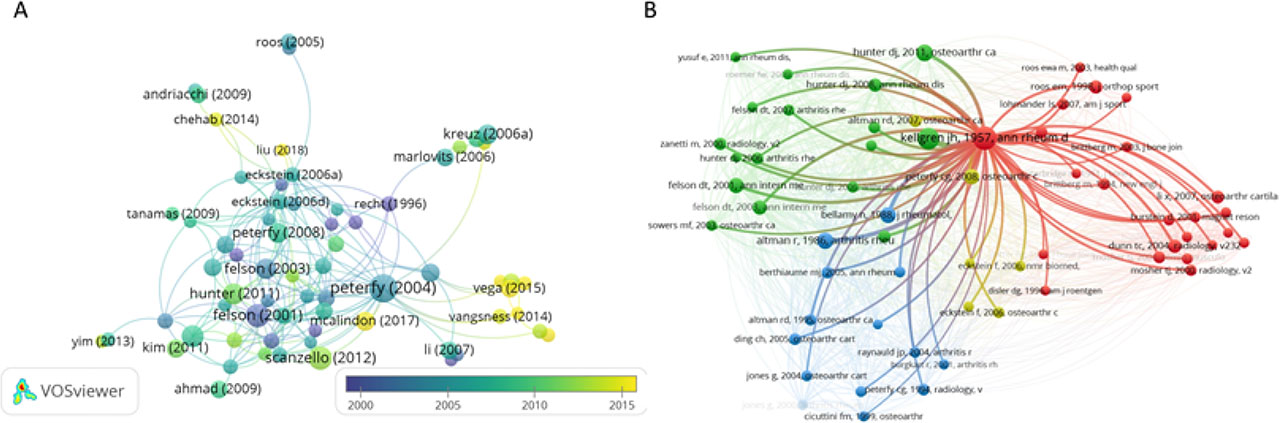
Figure 6.
Results of citation analysis (A. Projects citing each other; B. Projects co-cited)