
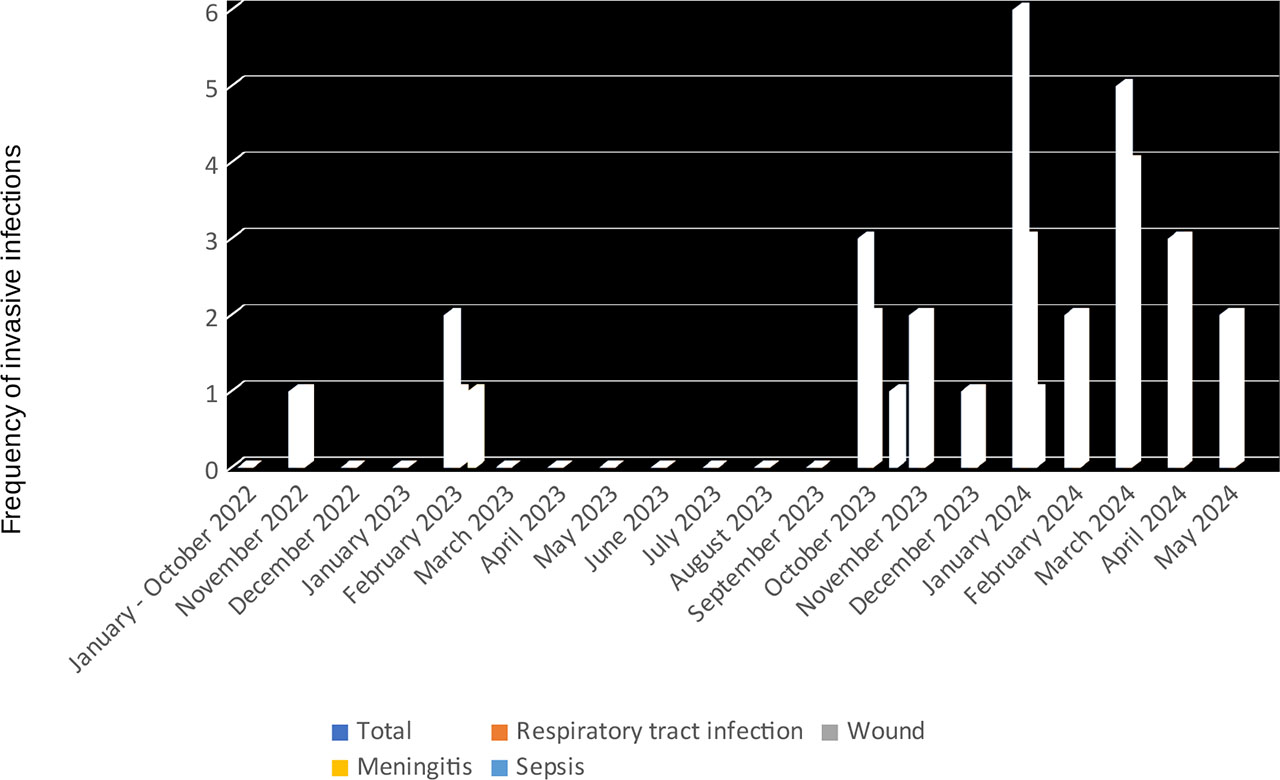
Figure 1.
Frequency of invasive Hemophilus influenzae infections in individual months from January 2022 to May 2024, with consideration of the type of infection. The Y-axis shows the number of cases
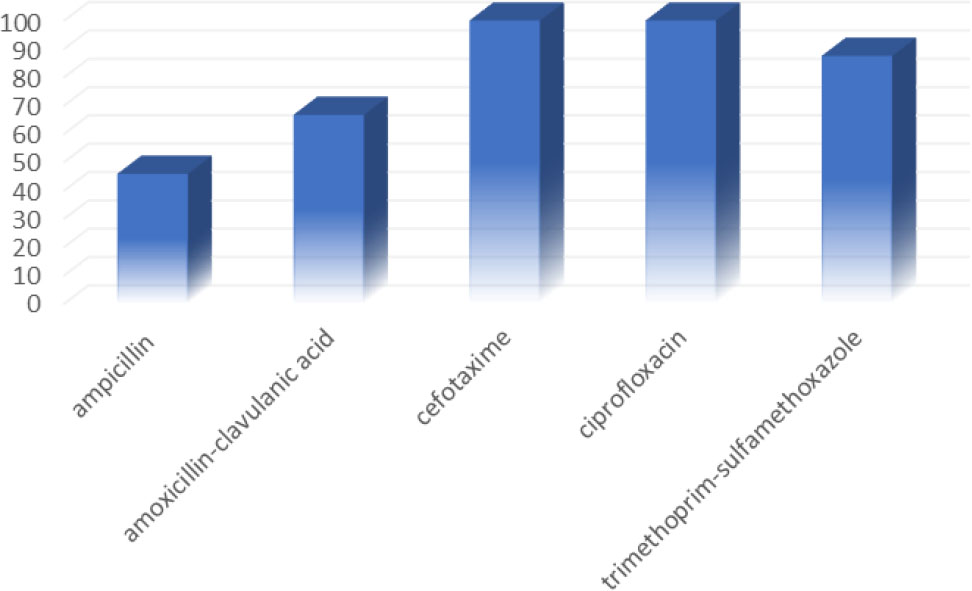
Figure 2.
Antibiotic susceptibility of the tested strains of Hemophilus influenzae (n=24). The Y-axis shows the percentage of sensitivity to specific antibiotics (X-axis) determined for all tested strains during the period from October 1, 2023 to May 31, 2024