
End-stage heart failure (HF) refractory to medical therapy is an indication of mechanical circulatory support (MCS) next to orthotopic heart transplantation. Due to the growing number of patients with HF and few organ donors, MCS is a vital option as the bridge to transplantation or as a destination therapy. Currently, there is a trend towards increasing [1] number of left ventricular assist devices (LVAD) implantations and a growing number of destination therapy implantations. According to the 2020 Interagency Registry for Mechanically Assisted Circulatory Support (INTERMACS) Annual Report, destination therapy comprised 73% of patients in 2019. The target group of patients receiving MCS is also expanding. Given that patients with multiple comorbidities, elderly and frail patients, and patients with congenital heart defects (2) undergo LVAD implantation, avoiding complications of long-term MCS is important.
There are two types of LVAD therapy-related complications: [1] complications occurring directly in the pump structure, like driveline or pump malfunction and outflow graft occlusion and [2] complications occurring as a consequence of patient-pump interaction, such as pump thrombosis, gastrointestinal bleeding (GIB), intracranial hemorrhage (ICH), stroke, arrhythmia, right HF, and infections.
GIB is the most common cause of rehospitalization in patients with LVAD. The complication is observed during the whole course of long-term LVAD therapy and is characterized by frequent recurrence. The need for anticoagulation and antiplatelet therapy complicates the course of treatment in this entity [3].
Cerebrovascular accidents are reported at different types of continuous flow-LVAD (cf-LVAD) devices. Proper blood pressure management and anticoagulation monitoring play a pivotal role in the prevention of these events. The risk of stroke decreases but is still as high as 13% at one year after implantation [1]. Ischemic stroke is more frequent than ICH, but the latter is more likely to cause disability or death. Despite the progress in continuous flow long-term MCS technologies, cerebrovascular complications still adversely affect the survival and quality of life in these patients [2,4]. Efforts are made to reduce major adverse events, and the quest is on for identifying predictive factors of poor outcome.
There is growing evidence that fibrin clot properties, including the formation of more compact clots highly resistant to lysis, are linked to thromboembolic complications. The main role of fibrinolysis is to degrade fibrin clots in order to counteract thromboembolic complications and obtain appropriate homeostasis. Until now, it was shown that the clot lysis time (CLT) was prolonged in prothrombotic conditions [5,6]. Conditions such as coronary artery disease, inflammation, and diabetes mellitus contribute to impaired fibrinolysis [7,8]. Such factors are frequently present in patients with advanced heart failure, especially those scheduled for advanced heart failure therapies. In contrast, excessive fibrinolysis is related to bleeding complications [9]. Pump thrombosis, despite its reduction by MagLev technology and artificial pulse, is still responsible for treatment failure.
Commercially available tests describe only part of the complex hemostasis system. Clot lysis time is the test reflecting the global fibrinolytic activity of the plasma [9]. This method assesses the influence of all clotting activators and inhibitors present in the plasma. Patients with thromboembolic events might have changed CLT, and we suppose that the changes may antecede adverse events. In our study we aim to assess the global fibrinolytic capacity of the plasma and their changes during long-term LVAD therapy.
Due to the paucity of data on fibrinolysis in this clinical setting we investigated whether the changes in plasma fibrinolytic activity during the LVAD therapy may be linked with thromboembolic and bleeding events.
We enrolled 85 consecutive end-stage HF patients scheduled for cf-LVAD implantation. The implantation proceeded as a bridge to transplantation or a bridge to candidacy. The study was carried out in a single high-volume heart transplantation center between May 10, 2017 and September 10, 2021. All of the patients were assessed prior to implantation by an experienced Transplant Heart Team.
We used the following inclusion criteria: end-stage HF, and fulfilled criteria for LVAD implantation according to the current International Society for Heart and Lung Transplantation and European Society of Cardiology guidelines [2,10,11,12], age of 18 years or older, and no current pregnancy. Exclusion criteria were: psychosocial instability, end-stage renal failure, thrombophilia, active infection, contraindication to long-term anticoagulation, severe ventricular arrhythmias, INTERMACS 1 at the time of enrollment, and lack or withdrawal of consent for participation in the study and participation in any other clinical investigation.
The clot lysis time in LVAD patients was compared with results obtained in healthy people described elsewhere, as there is no reference value for this investigation [13].
The study conforms to the declaration of Helsinki and was approved by the Medical University of Silesia Bioethics Committee (PCN/CBN/0022/KB1/144/21/22).
Two commercially available cf-LVADs (Heart Ware, Medtronic or Heart Mate 3, Abbot) were used. The inflow cannula of the pump was surgically inserted into the left ventricle apex. The device consists of inflow cannula connected to the continuous flow centrifugal pump located in the chest, mainly located in pericardial space. The magnetically levitating rotor of the pump unloads the left ventricle and transports the blood from left ventricle via outflow graft to the ascending aorta. The pump is connected with its driveline tunneled in abdominal tissues and exiting on the skin surface. Driveline connects the pump with external system controller and batteries. The flow in the pump can be managed by changing the rotation speed [14].
The patients were followed at scheduled visits: directly prior to LVAD implantation, 3–4 months after implantation, 6–12 months after implantation, and every 6 months after the first year (no longer than 5-year follow-up). We analyzed the last available blood sample (median 21 months; IQR:10–29 months). The second collection of blood samples proceeded after 3 months following implantation, as other studies showed similar results seven days and three months after implantation [15]. In the further CLT analyses, only patients who had completed four observations were enrolled. The flowchart of the study is presented in Fig. 1.
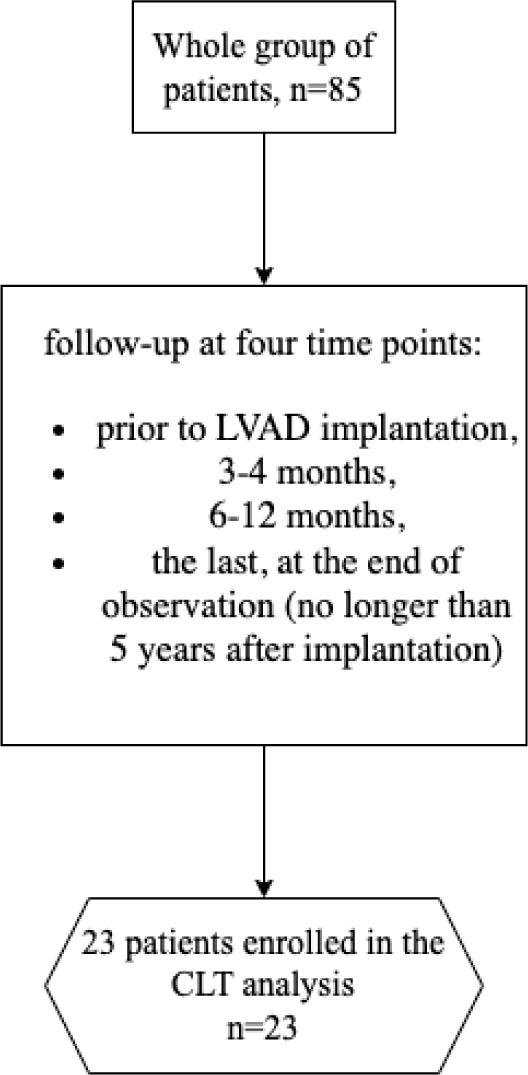
Flowchart of the study
All the patients received vitamin K antagonist (warfarin) in order to achieve an international normalized ratio (INR) in the target range of 2–3 and acetylsalicylic acid 75 mg daily as an antiplatelet drug of the first choice. If the ASPI test was below 745AU × min, we maintained the dose; if the ASPI test exceeded 745, we up-titrated the dose to 150 mg daily; and if the ASPI test was still over 745, we switched the antiplatelet drug to clopidogrel 75mg/day. If ADP test was 534 AU × min, we maintained the dose. In the case of an ADP test exceeding 534 AU × min, we doubled the dose. If other indications occurred, such as neurological and cardiovascular indications, the patient received clopidogrel and acetylsalicylic acid. Detailed information about antithrombotic and anticoagulant therapy was described previously [16]. Due to daily home INR self-testing supported with caregiver advice according to vitamin K antagonist dosage, the time in the therapeutic range was high (>70%), but data was not shown.
Clinical outcomes included major adverse cardiac and cerebrovascular events (MACCE), which encompasses all-cause mortality, ischemic stroke, transient ischemic attack peripheral embolism, pulmonary embolism, and pump thrombosis. We captured all symptoms identified during follow-up and ambulatory visits. Bleeding complications were defined as major bleeding by the International Society on Thrombosis and Hemostasis’s criteria [17]. Net adverse clinical events (NACE) were a composite of MACCE and bleeding complications.
We assessed basic clinical and laboratory parameters at four different time points: directly prior to LVAD implantation, 3–4 months after implantation, 6–12 months after implantation and the last available blood sample. Fasting blood samples were collected via venipuncture between 7:30 and 09:00 AM. Basic biochemical parameters and complete blood count were assessed using routine laboratory tests.
Samples of citrated venous blood were collected to S—Monovettes: Citrate 9NC/2.9 mL (9NC:0.106 mol/L) for assessment of Prothrombin Time, Activated Partial Thromboplastin Time, Fibrinogen, D-dimer, Antithrombin, Thrombin Time, Factor VIII, and von Willebrand Factor.
Prothrombin time, PT and INR we assessed with STA Neoptimal reagent, Diagnostica Stago, Canada. Reference range was 70–120 %. Activated Partial Thromboplastin Time (APTT) was assessed with STA Cephascreen reagent, Diagnostica Stago, Canada; normal range was 24–35 s. Thrombin Time (TT) was assessed with the application of STA Thrombin, Diagnostica Stago, Canada, with a reference range of 14–21 s. Fibrinogen was assessed with the application of STA Liquid Fib reagent, Diagnostica Stago, Canada. Normal range for this method was 200–400 mg/dL. For assessment of D-dimer, the immunoturbidimetric method was used with a reference range of 0–0.5 μg/mL FEU – TA Liatest D-DI Plus reagent, Diagnostica Stago, Canada was applied. Antithrombin time (AT) was assessed using the colorimetric method with the use of chromogenic substrate for antithrombin (STA Stachrom AT III reagent, Diagnostica Stago, Canada). The reference range for this method was 80–120%. Factor VIII was assessed with the application of STA Immunodef VIII, Diagnostica Stago, Canada, and the reference range for this reagent was 60–150%. Von Willebrand factor was assessed with the immunoturbidimetric method (STA Liatest VWF: Ag reagent, Diagnostica Stago, Canada). The normal range was 50–160%.
Platelet function assessment (S—Monovettes: Hirudyn/1.6 mL) was performed in a Multiplate analyzer (Roche Diagnostics, Mannheim, Germany). To assess platelet reaction to acetylsalicylic acid, we applied impedance aggregation (ASPI test, Roche) with the reference range from 745 to 1361 AU × min.
Platelet function assessment (S—Monovettes: Hirudyn/1.6 mL) was performed in a Multiplate analyzer (Roche, Diagnostics, Mannheim, Germany). For clopidogrel, we used impedance aggregation (ADP test, Roche) with the reference range from 534 to 1220 AU × min.
Clot lysis time (CLT) was used to determine plasma lysis potential. CLT was performed as described previously [18]. After clotting of the citrated plasma with the addition of 15 mM calcium chloride, 0.5 human thrombin (Merck), in the presence of 18 ng/mL rtPA (Boehringer Ingelheim, Ingelheim, Germany), and 15 µM phospholipid vesicles (Rossix, Mölndal, Sweden). The mixture was transferred to a microtiter plate, and its turbidity was measured at 405 nm at 37°C. CLT was defined as the time from the midpoint of the clear-to-maximum-turbid transition (clot formation) to the midpoint of the maximum-turbid-to-clear transition (clot lysis) on the turbidity curve. Normal values of plasma CLT in this method for age-matched (55.9±27.4 years) healthy controls were defined previously by others [13] and was 84.8 [75.0–98.5] min.
Continuous variables were presented as means and standard deviations for normally distributed data or medians with lower and upper quartiles (IQR: 25th to 75th) for data with a distribution other than normal. Categorical variables were presented as counts and percentages. The Shapiro-Wilk test was used to verify the normal distribution.
In the case of laboratory parameters presented in Table 2, the Friedman test was used to assess differences of continuous parameters over time, and a correction for false discovery rate due to multiple hypotheses testing was applied; moreover, the effect size measure was estimated as follows: for each laboratory parameter, three quartiles shown in Table 2 were treated as parameters of a triangular distribution, in which the median (second quartile) was the mode of the distribution. Based on the distributions observed at four time points (baseline, 3–4 months, 6–12 months, last sample), the variability between time points B and the variability within time points W were calculated. The effect size was estimated as the proportion B ⁄ (B+W)∙100%. Greater variability between time points compared to variability within time points, a larger effect was observed.
We performed three orthogonal comparisons of the CLT at baseline with the rest time points pooled together, CLT at 3–4 months with the rest time points pooled together, and CLT at 6–12 months with the last sample, using the Wilcoxon signed-rank test.
We also made paired comparisons between each time point with the use of the Wilcoxon signed-rank test with Holm-Bonferroni correction for multiple comparisons. Finally, we calculated differences over time in two subgroups (Yes/No: MACCE, bleedings, NACE) with the use of the Friedman test, and between groups (Yes/No) for each time point with the use of the Wilcoxon-Mann-Whitney test; therefore, we applied the Holm-Bonferroni correction for testing six simultaneous hypotheses (Figures 3a, 3b and 3c). A P value < 0.05 was considered statistically significant. All analyses were performed using SAS 9.4 (SAS Institute Inc., Cary, NC, USA) and R version 4.3.3 (R Foundation for Statistical Computing).
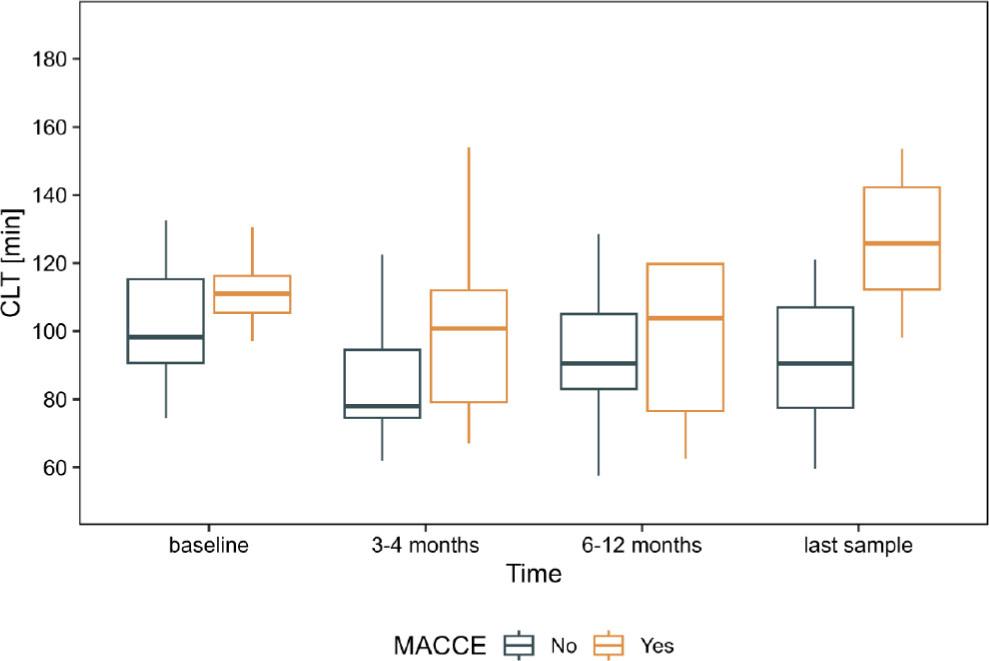
Comparison between patients with and without MACCE in the subgroup of patients who completed four observations (n=23). Whiskers presents range, box presents interquartile range (IQR) and the bar within the box displays median.
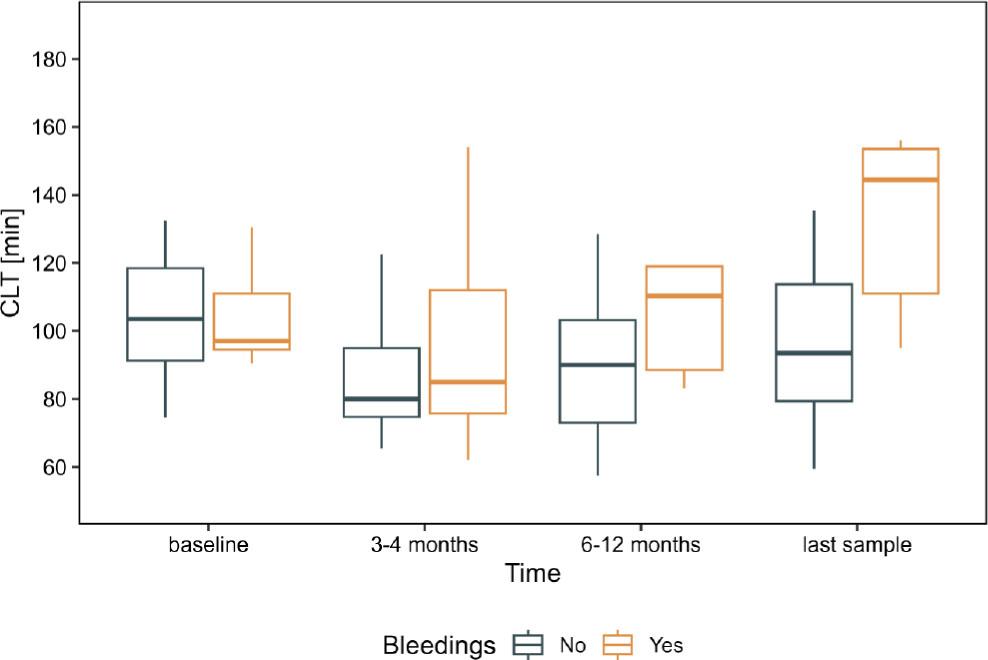
Comparison between patients with and without bleeding in the subgroup of patients who completed four observations (n=23). Whiskers present range, the box presents interquartile range (IQR), and the bar within the box displays median
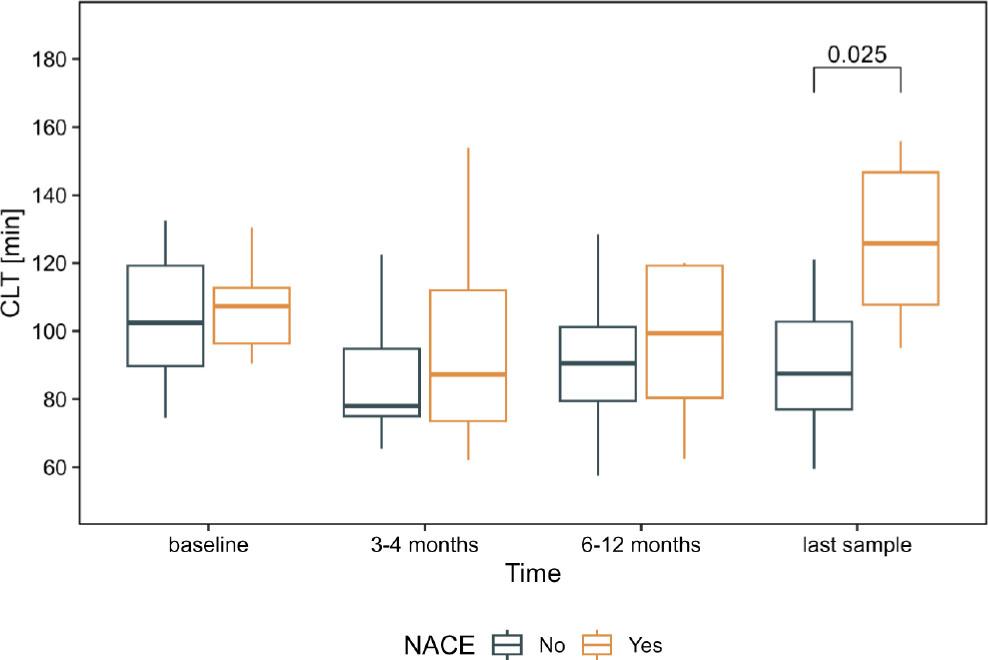
Comparison between patients with and without NACE in the subgroup of patients who completed four observations (n=23). Whiskers presents range, box presents interquartile range (IQR) and the bar within the box displays median. The square bracket (top-right) shows statistically significant difference between groups with the p-value after Holm-Bonferroni correction
As shown in Table 1, there were 85 patients at a mean age of 54.9±11.9 years (median age: 58.2 years, range: 48.6–63.8), 77 patients (90.6%) were men. Ischemic etiology of heart failure (HF) was most common, found in 49 (57.6) patients. Heart Ware was implanted in 15.3% (13 pts.), Heart Mate 3 in 86.7% (72 pts.).
Baseline characteristics of LVAD patients (prior to LVAD implantation), 85 patients
| Variable | |
| Age at the time of implantation, years | 58.2 [48.6–63.8] |
| NYHA class | 4[3.5–4] |
| INTERMACS | 3[2–4] |
| LVEF, % | 15[11–17] |
| LVEDD, mm | 75[70–82] |
| Prior stroke | 13 (17.6) |
| Hypertension | 38 (44.7) |
| Diabetes mellitus | 35 (41.2) |
| eGFR< 60ml/min/1.73m2, | 37 (45.1) |
| Medications, n (%) | |
| Beta blockers | 65 (76.5) |
| ACEI | 44 (51.8) |
| ARB | 12 (14.1) |
| Aldosterone antagonists | 74 (87.1) |
| Aspirin | 24 (28.2) |
| Clopidogrel | 5(5.9) |
| Statin | 51 (60) |
| Vitamin K antagonists | 38 (44.7) |
Data are shown as numbers (%), mean±standard deviation or median [interquartile range]. ACEI, angiotensin-converting enzyme inhibitors; ARB, angiotensin II receptor blockers, LVEDD left ventricle end diastolic dimension, LVED left ventricular ejection fraction, INTERMACS Interagency Registry for Mechanically Assisted Circulatory Support, NYHA New York Heart Association class
Table 2 presents our laboratory investigations.
Laboratory investigations in LVAD patients who completed the whole study, n=23. Patients who died prior to the end of observation and incomplete observations were excluded from the further analyses
| Laboratory parameters | baseline, N = 23 | 3–4 months, N = 23 | 6–12 months, N = 23 | last sample, N = 23 | p-value1 | q-value2 | Effect size | Effect size (without baseline) |
|---|---|---|---|---|---|---|---|---|
| White blood cell count, 103/µL | 9.93 (7.52–11.05) | 7.70 (6.28–9.17) | 7.31 (5.88–8.76) | 7.80 (6.89–9.41) | 0.066 | 0.078 | 64.3% | 21.1% |
| Hemoglobin, mmol/L | 7.70 (7.15–9.00) | 8.10 (7.30–8.45) | 8.30 (7.50–8.90) | 8.80 (7.85–9.45) | 0.015 | 0.022 | 48.5% | 53.6% |
| Platelet count, 103/µL | 194 (146–254) | 245 (199–261) | 211 (171–257) | 185 (172–228) | 0.003 | 0.008 | 47.4% | 56.2% |
| Bilirubin, µmol/L | 18 (8–33) | 8 (7–11) | 11 (9–13) | 11 (8–15) | <0.001 | 0.004 | 70.0% | 55.1% |
| Albumin, g/L | 40.0 (35.0–42.0) | 44.0 (41.5–47.5) | 45.0 (43.0–49.0) | 46.0 (42.0–47.5) | <0.001 | <0.001 | 81.2% | 17.0% |
| Creatinine, µmol/L | 125 (110–184) | 100 (81–125) | 110 (93–131) | 111 (95–154) | 0.001 | 0.005 | 58.4% | 35.3% |
| hsCRP, mg/L | 8 (4–25) | 8 (3–18) | 6 (4–10) | 4 (2–13) | 0.2 | 0.2 | 38.7% | 28.4% |
| NT-proBNP, pg/mL | 11259 (5521–20366) | 2244 (1230–3273) | 1854 (895–2995) | 1992 (1138–3005) | <0.001 | <0.001 | 89.0% | 10.1% |
| Fibrinogen, g/L | 479 (380–542) | 424 (359–476) | 394 (346–428) | 368 (321–453) | 0.010 | 0.017 | 62.7% | 34.4% |
| D-dimer, ng/mL | 1.66 (1.00–3.46) | 1.79 (1.43–2.46) | 1.25 (0.97–1.66) | 1.11 (0.69–1.53) | 0.001 | 0.005 | 62.7% | 77.9% |
| CLT, min | 104 (93–125) | 82 (75–104) | 91 (79–113) | 98 (86–117) | 0.022 | 0.027 | 56.6% | 41.0% |
| Von Willebrand Factor, % | 290 (210–368) | 168 (140–215) | 177 (139–212) | 174 (131–288) | 0.009 | 0.017 | 77.3% | 17.9% |
| Factor VIII, % | 281 (232–349) | 200 (171–229) | 197 (131–226) | 174 (114–226) | 0.007 | 0.015 | 83.4% | 28.0% |
| Antitrombin, % | 87 (73–94) | 93 (87–99) | 97 (92–104) | 104 (90–108) | 0.013 | 0.020 | 76.0% | 52.6% |
| International Normalized Ratio, % | 1.53 (1.21–1.89) | 2.29 (2.06–2.37) | 2.24 (2.01–2.65) | 2.31 (2.17–2.57) | <0.001 | <0.001 | 90.0% | 17.4% |
| Thrombin Time, s | 16.90 (15.85–18.05) | 16.00 (15.70–16.60) | 15.80 (15.20–16.38) | 16.60 (15.85–17.30) | 0.017 | 0.023 | 66.7% | 63.7% |
| Activated Partial Thromboplastin Time, s | 43 (33–46) | 45 (40–50) | 41 (37–45) | 38 (36–42) | 0.003 | 0.008 | 56.7% | 71.0% |
| ASPI, AU × min | 590 (362–1,058) | 431 (276–705) | 331 (239–754) | 533 (312–880) | 0.2 | 0.2 | 37.2% | 22.4% |
| ADP, AU × min | 364 (274–658) | 466 (223–621) | 408 (268–655) | 461 (341–653) | 0.10 | 0.11 | 6.9% | 7.3% |
Friedman rank sum test
False discovery rate correction for multiple testing
Data are shown as median (1st quartile–3rd quartile). Abbreviations: CLT, clot lysis time, hsCRP, High-sensitivity C-reactive protein, WBC.
At baseline, the patients with end-stage HF showed longer CLT median [IQR, interquartile range], when compared to reference values in healthy people [13]: 111.25[97–300] vs. 84.8 [75.0–98.5] min, P<0.001.
The changes in the course of time in the analyzed subgroup of patients (n=23 patients) are presented in Figure No.2. We compared CLT at baseline with the rest of the time points pooled together (p = 0.056), CLT at 3–4 months with 6–12 months, last sample pooled together (p = 0.018), and finally CLT at 6–12 months with last sample (p = 0.354).
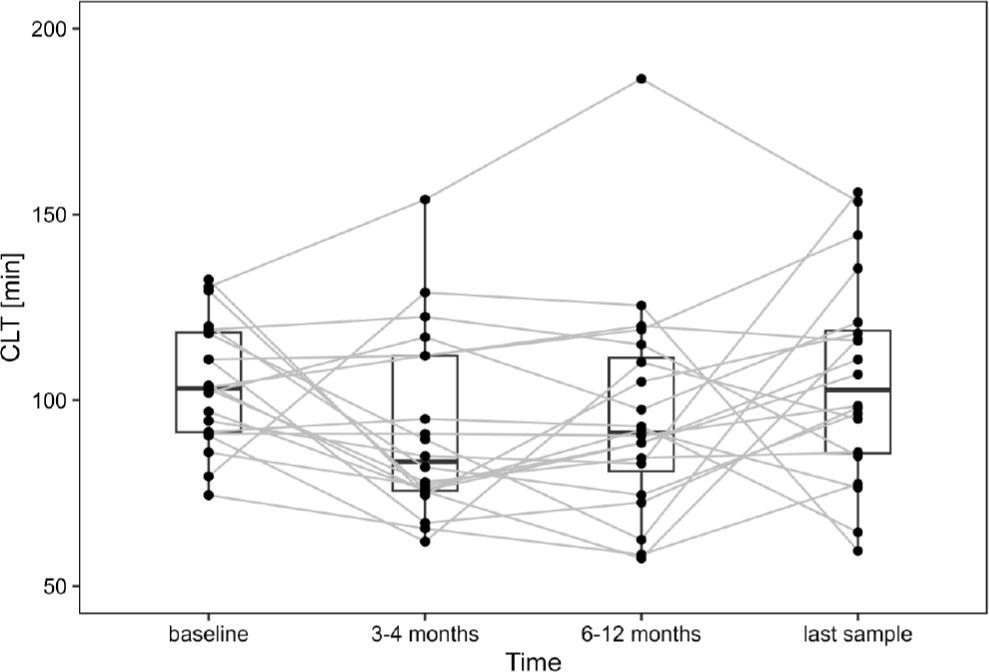
CLT in the subgroup of patients during follow-up, n=23. Dots represent individual patients. The gray line connects the same patient at consecutive time points. The box presents an interquartile range (IQR), and the bar within the box displays the median
During the whole observation period, MACCE occurred in 31 (36.5%) pts, bleeding events in 22 (25.9%) pts, and NACE in 53 (62.4%) pts. Deaths occurred in 27 (31.8%) pts. Major adverse cardiac and cerebrovascular events (MACCE), bleeding events, and Net Adverse Clinical Events (NACE) in the course of time in the subgroup who completed four observations (n=23) are presented in Table 3b–4.
Major adverse cardiac and cerebrovascular events (MACCE), bleeding events and Net Adverse Clinical Events (NACE) in the whole group of patients (n=85)
| 0 to 3 months | 3–4 months | 6–12 months | Last available (median 21 months;IQR:10–29 months) | |
|---|---|---|---|---|
| MACCE, pts. (%) | 11(12.9) | 4(5.1) | 10(12.9) | 9(13.4) |
| Bleeding events, pts. (%) | 3(3.5) | 8(10.3) | 5(6.5) | 6(8.9) |
| NACE, pts (%) | 14(16.5) | 12(15.4) | 14 (18.2) | 15(22.4) |
| Deaths, pts (%) | 7(8.2) | 1(1.3) | 10(12.9) | 9(13.4) |
Comparison of CLT according to Major Adverse Cardiac and Cerebrovascular Events (MACCE) in the course of time, subgroup of patients with completed four observations (n=23). In the analyzed subgroup of patients MACCE occurred in 7 patients
| Clot Lysis Time [min] | baseline | 3–4 months | 6–12 months | Last available |
|---|---|---|---|---|
| Patients with MACCE during the whole observation period, n=6 | 111 (105.4–116.3) | 100.8 (79.2–112) | 103.8 (76.5–119.8) | 125.8 (112.33–142.2) |
| Patients without MACCE during the whole observation period, n=17 | 103 (91–129.5) | 78 (74.5–94.5) | 90.5 (83–105) | 90.5 (77.5–105) |
Comparison of CLT according to bleeding events in the course of time. Subgroup of patients with completed four observations (n=23). In the analyzed subgroup of patients, bleedings occurred in 5 patients
| Clot Lysis Time [min] | baseline | 3–4 months | 6–12 months | Last available |
|---|---|---|---|---|
| Patients with bleedings during the whole observation period, n=5 | 90.5 (94.5–111) | 85 (75.6–112) | 110.3 (88.5–119) | 144.5 (111–153.5) |
| Patients without bleedings during the whole observation period, n=18 | 107.5 (94.1–127.1) | 80 (74.8–94.9) | 110.3 (88.5–119) | 144.5 (111–153.5) |
Comparison of CLT according to Net Adverse Clinical Events (NACE) events in the course of time. Subgroup of patients with completed four observations (n=23). In the analyzed subgroup of patients, NACE occurred in 8 patients
| Clot Lysis Time [min] | baseline | 3–4 months | 6–12 months | Last available |
|---|---|---|---|---|
| Patients with NACE during the whole observation period, n=8 | 107.3 (96.4–112.8) | 87.3 (73.6–112) | 99.4 (80.4–119.3) | 125.8 (107.8–146.7) |
| Patients without NACE during the whole observation period, n=15 | 104 (91.3–131) | 78 (75–94.8) | 90.5 (79.5–101.3) | 87.5 (77–102.8) |
Adverse events in some patients occurred more than once. Percentages of population in brackets bleeding events and Net Adverse Clinical Events (NACE) in analyzed (n=23) group of patients.
After Holm-Bonferroni correction there were no significant differences in CLT values over time within MACCE subgroups, nor between groups (Yes/No) in each time point (Figure 3a).
After Holm-Bonferroni correction there were no significant differences in CLT values over time within bleedings subgroups, nor between groups (Yes/No) in each time point (Figure 3b).
After Holm-Bonferroni correction there were no significant differences in CLT values over time within NACE subgroups, and the only significant difference occurred between NACE Yes/No groups in the last sample time point (Figure 3c).
After the Holm-Bonferroni correction, there was a significant difference in CLT values between the last observation.
Patients with mechanical circulatory support due to the exposition of blood elements to artificial surfaces seem to have an enhanced coagulation process. In this study, we hypothesized that patients with cf-LVAD therapy display a more prothrombotic fibrin clot phenotype, including suppressed fibrinolytic capacity. To the best of our knowledge, there was no available reports on fibrinolytic capacity of the plasma in patients scheduled for long term cf-LVAD.
The clot lysis time (CLT) reflects the global fibrinolytic capacity of plasma. This method uses the citrated plasma obtained by whole blood centrifugation and assesses the influence of all activators and inhibitors present in the plasma. Clotting activation is achieved by the addition of thrombin and calcium, while fibrinolysis is achieved by the addition of plasminogen activator [19].
Due to the fact that there are no clinical studies on CLT reference values in patients with LVAD, we compare the obtained results with clinical studies in healthy people.
We have shown so far that a longer CLT seems to protect against excessive bleeding. Shortened CLT is considered a factor influencing blood loss perioperatively and during cardio-pulmonary bypass [20]. In patients with atrial fibrillation, it was demonstrated that prolonged CLT is connected with a previous thromboembolic event and stroke [21]. Prolonged CLT was also observed in female patients with thromboembolism in the course of hormonal contraception [6]. In our subanalysis of a large clinical trial with ticagrelor, a PLATelet inhibition and patient Outcomes (PLATO) trial substudy showed that every increase of clot lysis time by 50% in patients after acute coronary syndrome independently increased the risk of cardiovascular death and myocardial infarction (HR 1.2, 95% CI 1.01–1.42; P = 0.042). Furthermore, CLT was not associated with major bleeding events. In the summary of their study, they conclude that therapies aiming to enhance clot lysis may improve prognosis after acute coronary syndrome [22].
We observed significantly higher baseline CLT when compared to healthy controls [13]. In our study, we concentrated on CLT values during long-term observation. Due to this, we narrowed the analyses to patients who survived one year and completed the four observations. We observed that patients with lower CLT had fewer NACE. We did not include the CLT values of patients who died during the first year in order to observe long-term trends in CLT values. In this group, which survived one year, we did not observe significant changes over time. Probably, in a higher number of patients, the values would achieve significance. Surprisingly, in the last observation, we saw differences between patients with and without NACE, suggesting the role of CLT in the long-term complications assessment.
Other authors showed impact of multiple clinical factors on clot function. With prolonged lysis time associated were diabetes mellitus, chronic kidney disease, atrial fibrillation and coronary artery disease [23]. Previously, it was shown, that clot structure and function is affected by components of so-called metabolic syndrome [24] and rather environmental than genetic factors are responsible for clot function. We showed, that left ventricular assist devices had no negative impact on plasma lysis potential. Probably, the thromboembolic complications are connected with other circumstances that disturbed plasma lysis potential. The last observed difference may be a consequence of processes that led to the adverse events.
In summary, end-stage heart failure in patients scheduled for cf-LVAD therapy is associated with CLT prolongation. Difference in CLT between patients with and without in the last-long term observation seems to be connected with the adverse events.
A limitation of the study was the small number of patients who subsequently underwent the four assessments at the predefined time points. In order to show long-term CLT changes, we excluded the patients who died during the first year and those with incomplete observations.