
Figure 1.
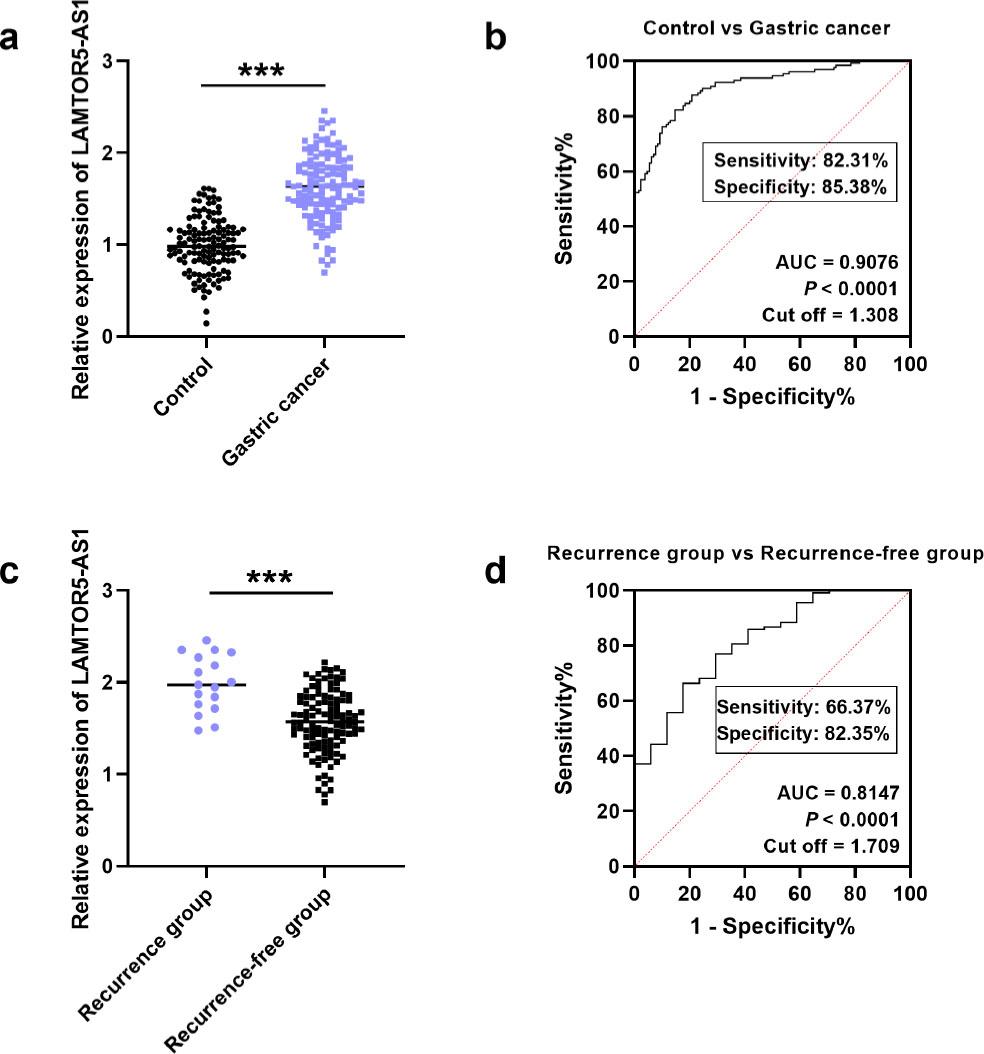
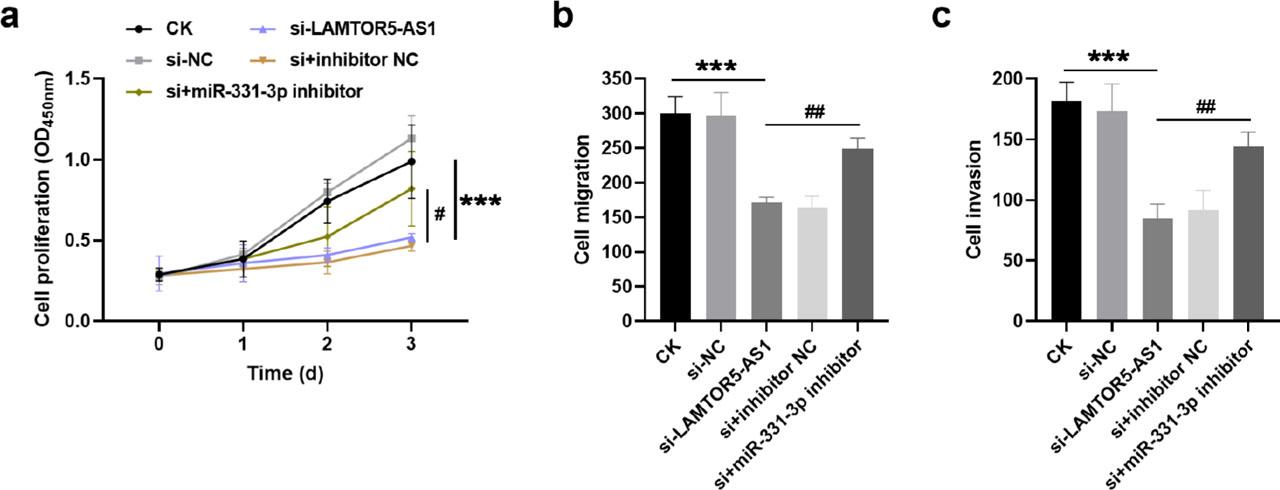
Figure 2.

Figure 3.
Relationship between LAMTOR5-AS1 and clinical indicators in patients with gastric cancer
| Case (n/%) | Low LAMTOR5-AS1 (n = 63) | High LAMTOR5-AS1 (n = 67) | P | |
|---|---|---|---|---|
| Age (years) | 0.852 | |||
| ≤ 55 | 56/43.08 | 28/44.44 | 28/41.79 | |
| > 55 | 74/56.92 | 35/55.56 | 39/58.21 | |
| Sex | 0.660 | |||
| Male | 85/65.38 | 40/63.49 | 45/67.16 | |
| Female | 45/34.62 | 23/36.51 | 22/32.84 | |
| Tumor size (cm) | 0.054 | |||
| ≤ 5 | 65/50.00 | 26/41.27 | 39/58.21 | |
| > 5 | 65/50.00 | 37/58.73 | 28/41.79 | |
| Differentiation | 0.227 | |||
| Well, moderate | 61/46.92 | 33/52.38 | 28/41.79 | |
| Poor | 69/53.08 | 30/47.62 | 39/58.21 | |
| Recurrence | 0.025 | |||
| No | 113/86.92 | 59/93.65 | 54/80.60 | |
| Yes | 17/13.08 | 4/6.35 | 13/19.40 | |
| TNM stage | <0.001 | |||
| T1a | 50/38.46 | 38/60.32 | 12/17.91 | |
| T1b | 80/61.54 | 25/39.68 | 55/82.09 | |
| Lymph node metastasis | 0.008 | |||
| Negative | 65/50.00 | 39/61.90 | 26/38.81 | |
| Positive | 65/50.00 | 24/38.10 | 41/61.19 |
Comparison of the general data of the two groups of patients
| Indicators | Case (n/%) | Recurrence group (n = 17) | Recurrence-free group (n = 113) | P |
|---|---|---|---|---|
| Age (years) | 0.772 | |||
| ≤ 55 | 56/43.08 | 8/47.06 | 48/42.48 | |
| > 55 | 74/56.92 | 9/52.94 | 65/57.52 | |
| Sex | 0.542 | |||
| Male | 85/65.38 | 10/58.82 | 75/66.37 | |
| Female | 45/34.62 | 7/41.18 | 38/33.63 | |
| Tumor size (cm) | 0.069 | |||
| ≤ 5 | 65/50.00 | 5/29.41 | 60/53.10 | |
| > 5 | 65/50.00 | 12/70.59 | 53/46.90 | |
| Differentiation | 0.009 | |||
| Well, moderate | 61/46.92 | 3/17.65 | 58/51.33 | |
| Poor | 69/53.08 | 14/82.35 | 55/48.67 | |
| TNM stage | 0.015 | |||
| T1a | 50/38.46 | 2/11.76 | 48/42.48 | |
| T1b | 80/61.54 | 15/88.24 | 65/57.52 | |
| Lymph node metastasis | 0.019 | |||
| Negative | 65/50.00 | 4/23.53 | 61/53.98 | |
| Positive | 65/50.00 | 13/76.47 | 52/46.02 |
Binary logistic regression analysis of recurrence of early gastric cancer after endoscopic submucosal dissection
| Indicators | OR | 95% CI | P-value |
|---|---|---|---|
| LAMTOR5-AS1 | 0.088 | 0.015 - 0.516 | 0.007 |
| Age (years) | 0.549 | 0.155 - 1.948 | 0.353 |
| Sex (male/female) | 1.085 | 0.297 - 3.969 | 0.902 |
| Tumor size (cm) | 0.169 | 0.042 - 0.677 | 0.012 |
| Differentiation | 0.173 | 0.040 - 0.739 | 0.018 |
| TNM stage | 0.138 | 0.024 - 0.789 | 0.026 |
| Lymph node metastasis | 2.411 | 0.589 - 9.862 | 0.221 |