
Figure 1
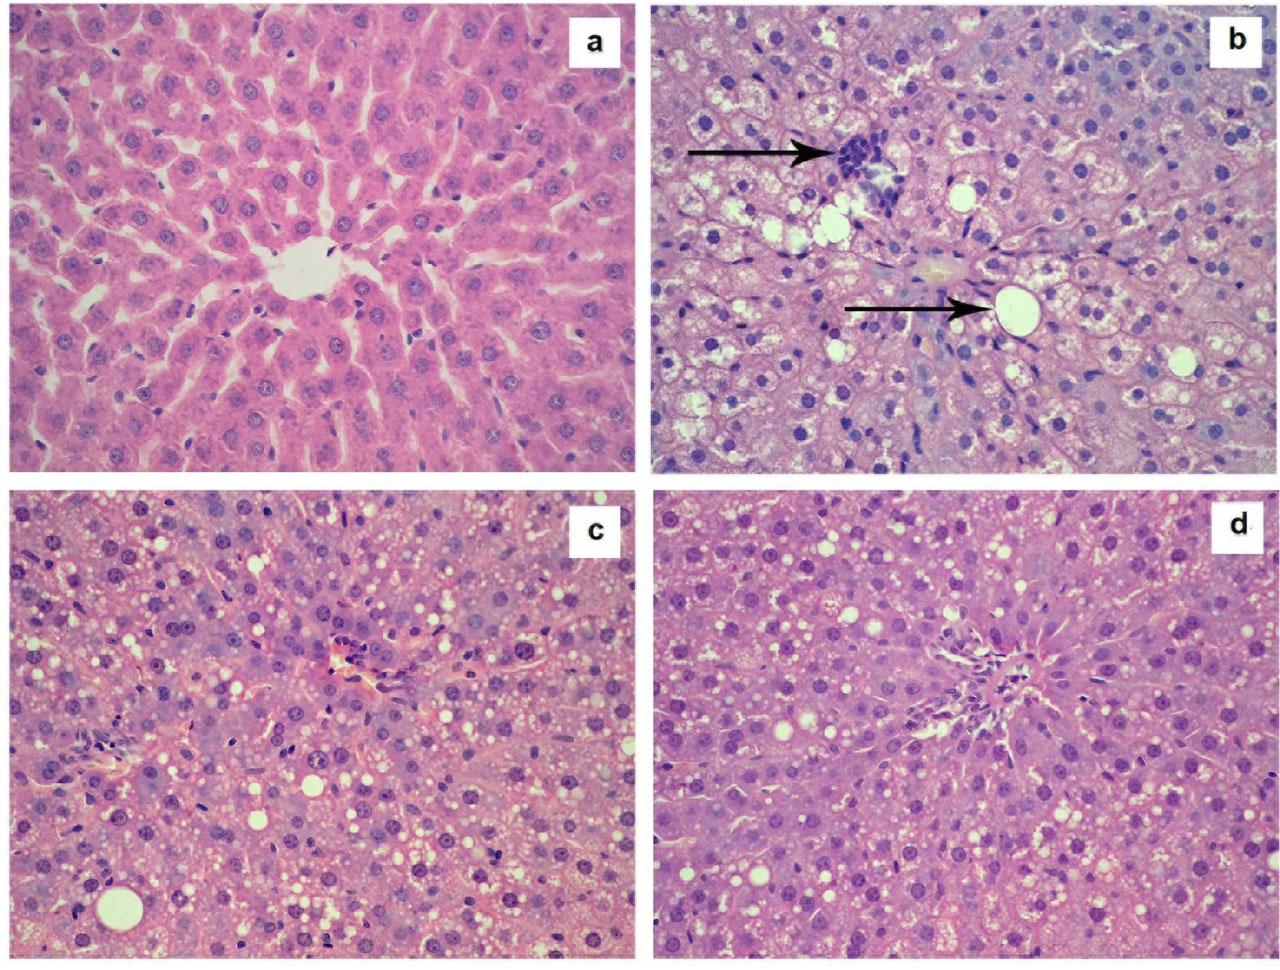
Figure 2
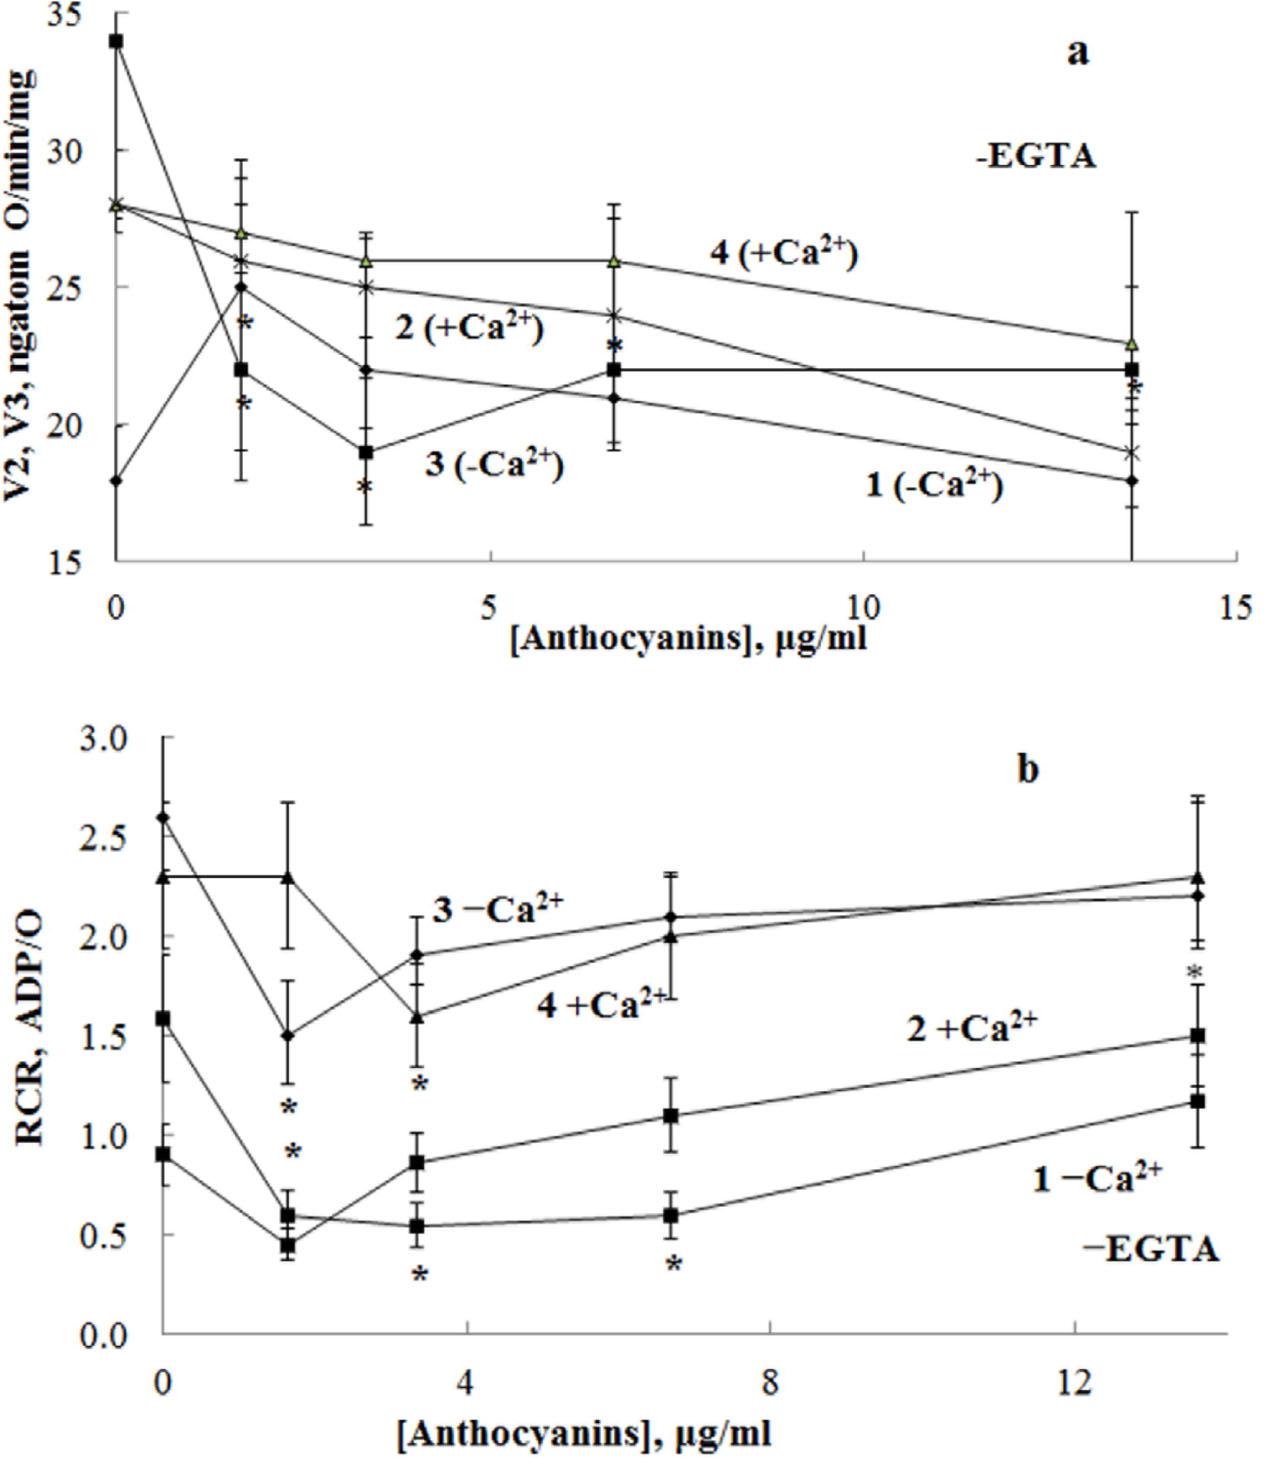
Figure 3
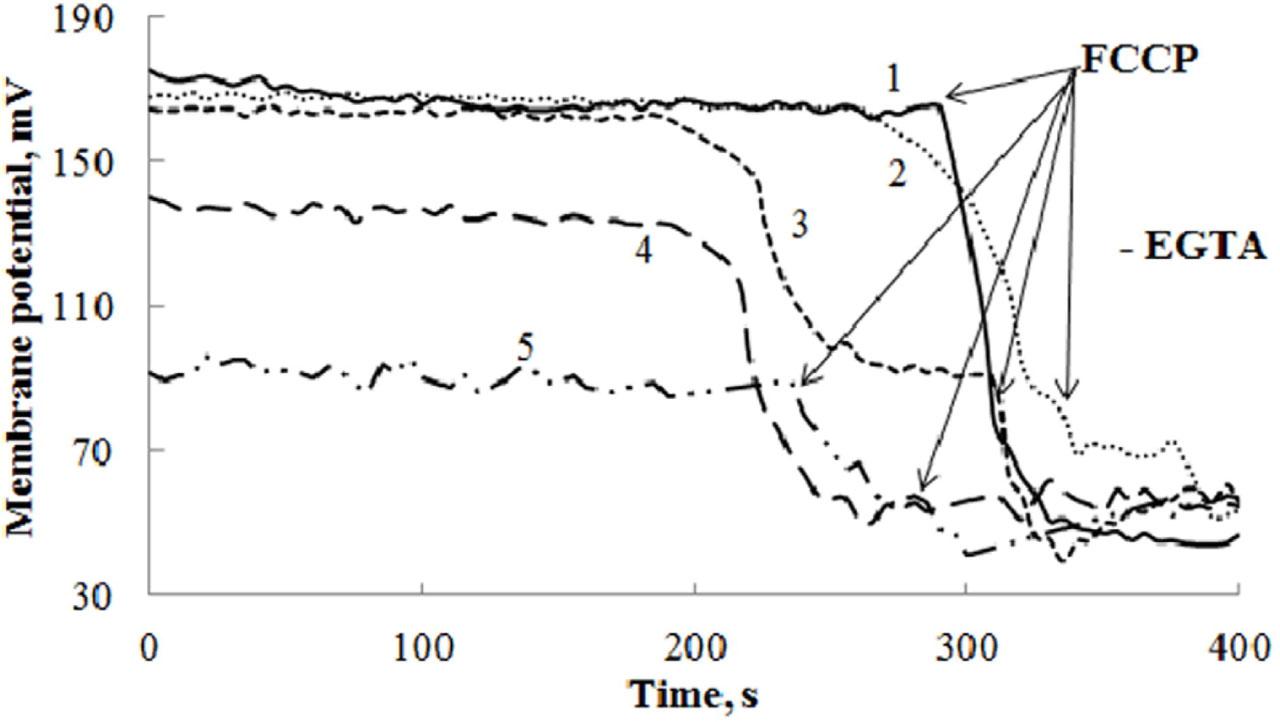
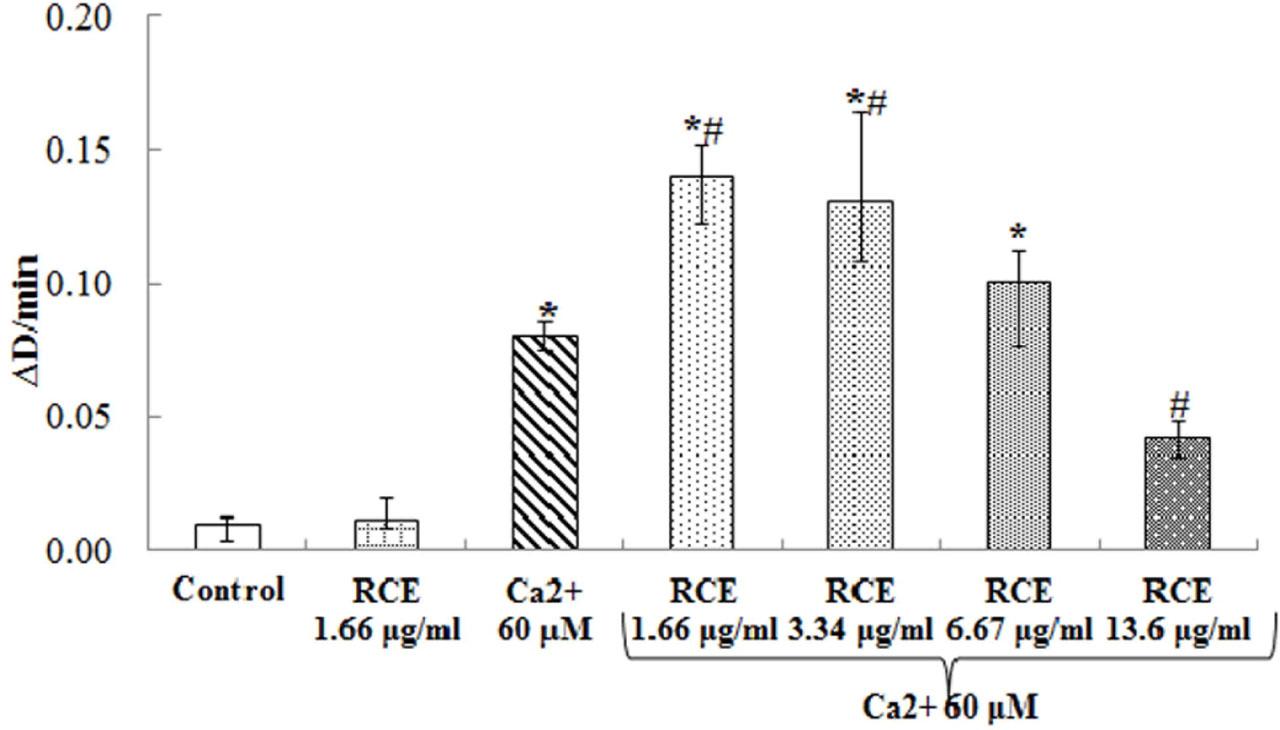
Figure 4
Blood immunological parameters in alcohol-administered rats treated with red cabbage extract (RCE) anthocyanins_
| Parameters | Control | ASH | ASH + 11 mg/kg RCE | ASH + 22 mg/kg RCE |
|---|---|---|---|---|
| Nitro blue tetrazolium test, % | 21.4 ± 1.2 | 7.7 ± 2.4a | 38.3 ± 6.9b | 38.3 ± 6.5b |
| Phagocytic index, % | 55.4 ± 3.5 | 21.1 ± 1.5a | 39.9 ± 3.5b | 37.1 ± 4.6b |
Morphometric evaluation of hepatic damage and blood serum triglycerides, bilirubin levels, alanine aminotransferase (ALT), aspartate aminotransferase (AST), and alkaline phosphatase activities and liver triglycerides content during long-term alcohol administration and red cabbage extract (RCE) anthocyanins treatment_
| Parameters | Control | ASH | ASH + 11 mg/kg RCE | ASH + 22 mg/kg RCE |
|---|---|---|---|---|
| Square of sudanophilic area, % of the slide square | 2.2 ± 0.2 | 16.8 ± 1.8a | 13.8 ± 1.5a | 12.6 ± 1.4ab |
| AST, U/l | 67.0 ± 3.5 | 170.1 ± 2.6a | 165.4 ± 3.5a | 165.1 ± 3.1a |
| ALT, U/l | 53.0 ± 2.2 | 78.8 ± 2.1a | 63.2 ± 3.4ab | 56.4 ± 2.4b |
| Alkaline phosphatase, U/l | 185.9 ± 13.7 | 406.9 ± 41.4a | 300.4 ± 19.2ab | 271.0 ± 14.6ab |
| Bilirubin, total, μmol/l | 4.0 ± 0.2 | 6.0 ± 0.3a | 4.6 ± 0.4b | 4.6 ± 0.3b |
| Bilirubin, bound, μmol/l | 1.9 ± 0.2 | 2.7 ± 0.3a | 1.7 ± 0.2b | 1.6 ± 0.1b |
| Serum triglycerides, mmol/l | 1.8 ± 0.2 | 2.8 ± 0.2a | 2.0 ± 0.1b | 1.9 ± 0.2b |
| Liver triglycerides, mg/g tissue | 16.8 ± 0.9 | 39.1 ± 2.7a | 35.5 ± 1.9ab | 30.3 ± 1.9ab |
Rat blood cytokines tumor necrosis factor α (TNFα), transforming growth factor β (TGFβ), interleukin-6 (IL-6), and leptin levels during alcohol administration and red cabbage extract (RCE) anthocyanins treatment_
| Parameters | Control | ASH | ASH + 11 mg/kg RCE | ASH + 22 mg/kg RCE |
|---|---|---|---|---|
| TNFα, pg/ml | 8.4 ± 0.8 | 49.9 ± 3.8a | 50.8 ± 4.7a | 35.6 ± 3.2ab |
| TGFβ, ng/ml | 57.3 ± 7.6 | 141.9 ± 21.0a | 152.9 ± 36.2a | 125.0 ± 25.3a |
| IL-6, pg/ml | 50.4 ± 4.9 | 147.0 ± 13.2a | 107.3 ± 12.5ab | 80.9 ± 6.2ab |
| Leptin, ng/ml | 1.1 ± 0.1 | 1.9 ± 0.1a | 1.9 ± 0.1a | 1.3 ± 0.2b |
Respiratory parameters of rat liver mitochondria during alcohol administration and red cabbage extract (RCE) anthocyanins treatment_
| Parameters | Control | ASH | ASH + 11 mg/kg RCE | ASH + 22 mg/kg RCE |
|---|---|---|---|---|
| V3, ngatom O/min/mg protein | 94.8 ± 8.9 | 59.7 ± 6.2a | 104.7 ± 9.2b | 110.8 ± 7.2b |
| V4, ngatom O/min/mg protein | 41.4 ± 4.7 | 29.7 ± 4.8a | 45.2 ± 4.1b | 39.5 ± 4.5b |
| Respiratory control ratio (RCR) | 2.3 ± 0.3 | 2.0 ± 0.2 | 2.1 ± 0.3 | 2.2 ± 0.2 |
| ADP/O | 1.6 ± 0.2 | 1.1 ± 0.2a | 1.7 ± 0.3b | 1.8 ± 0.2b |