
Figure 1
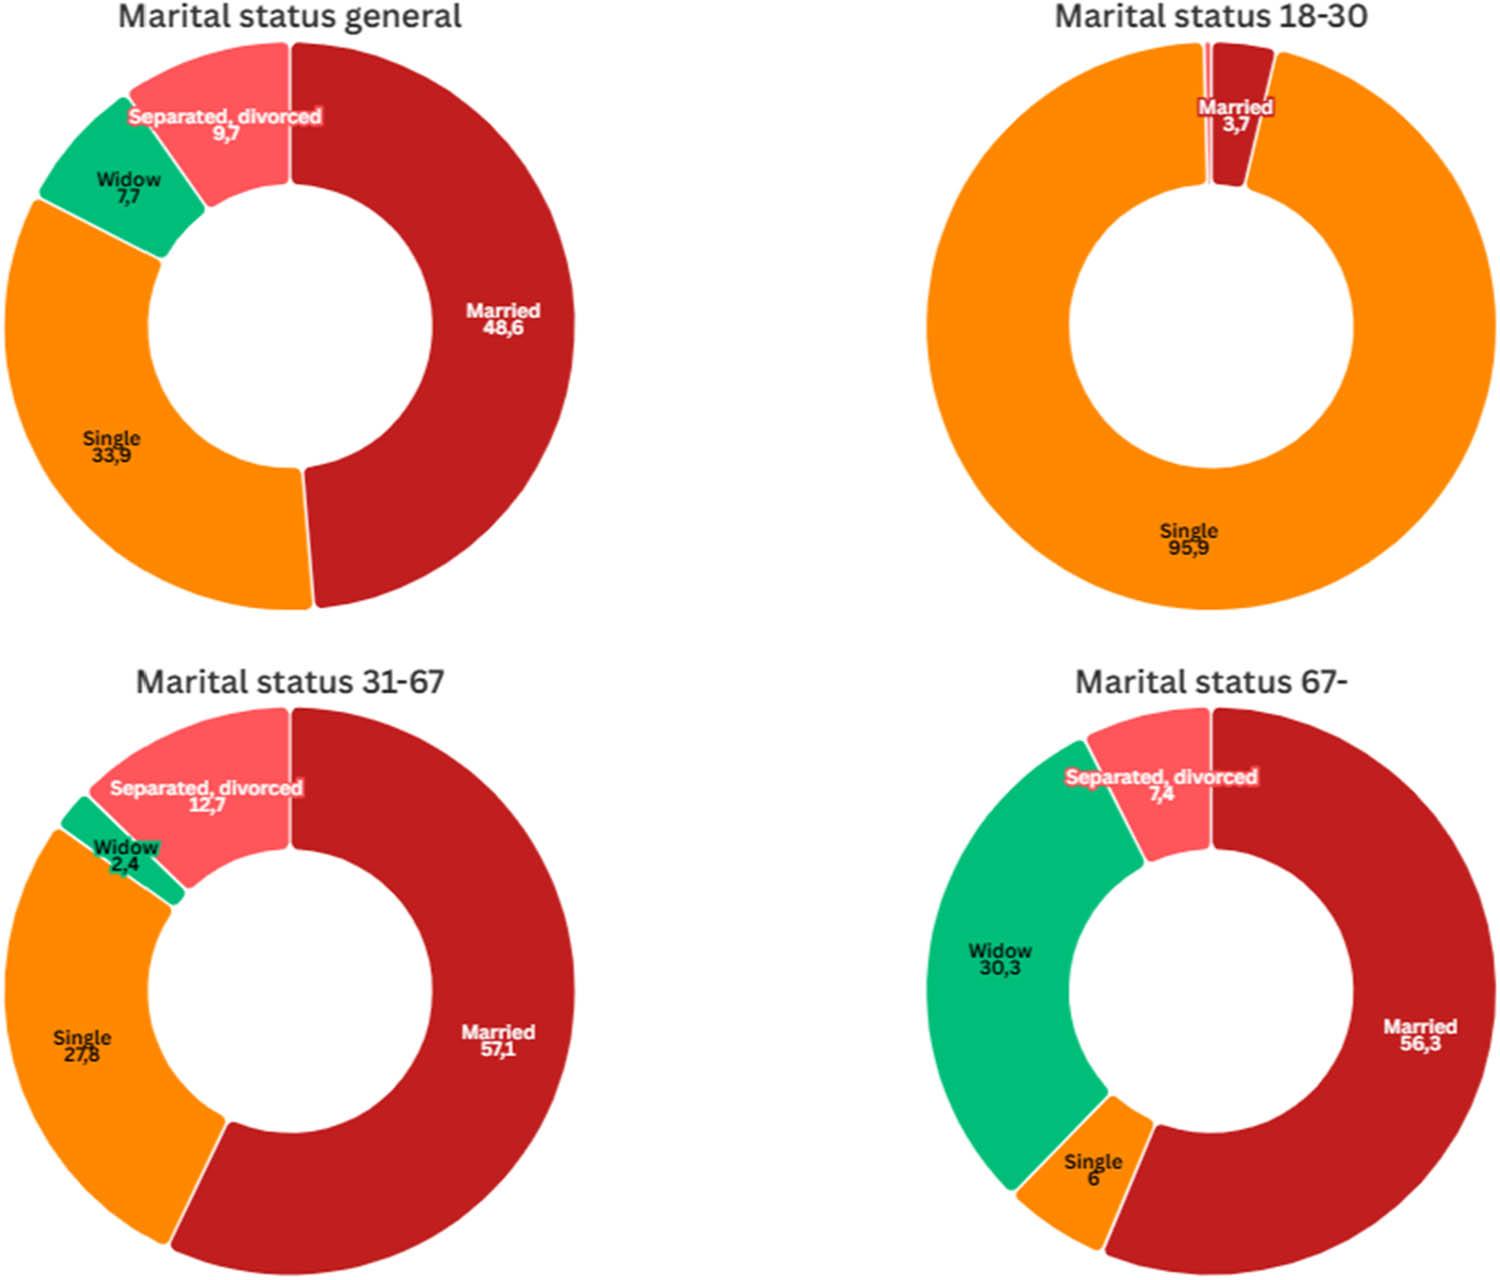
Figure 2
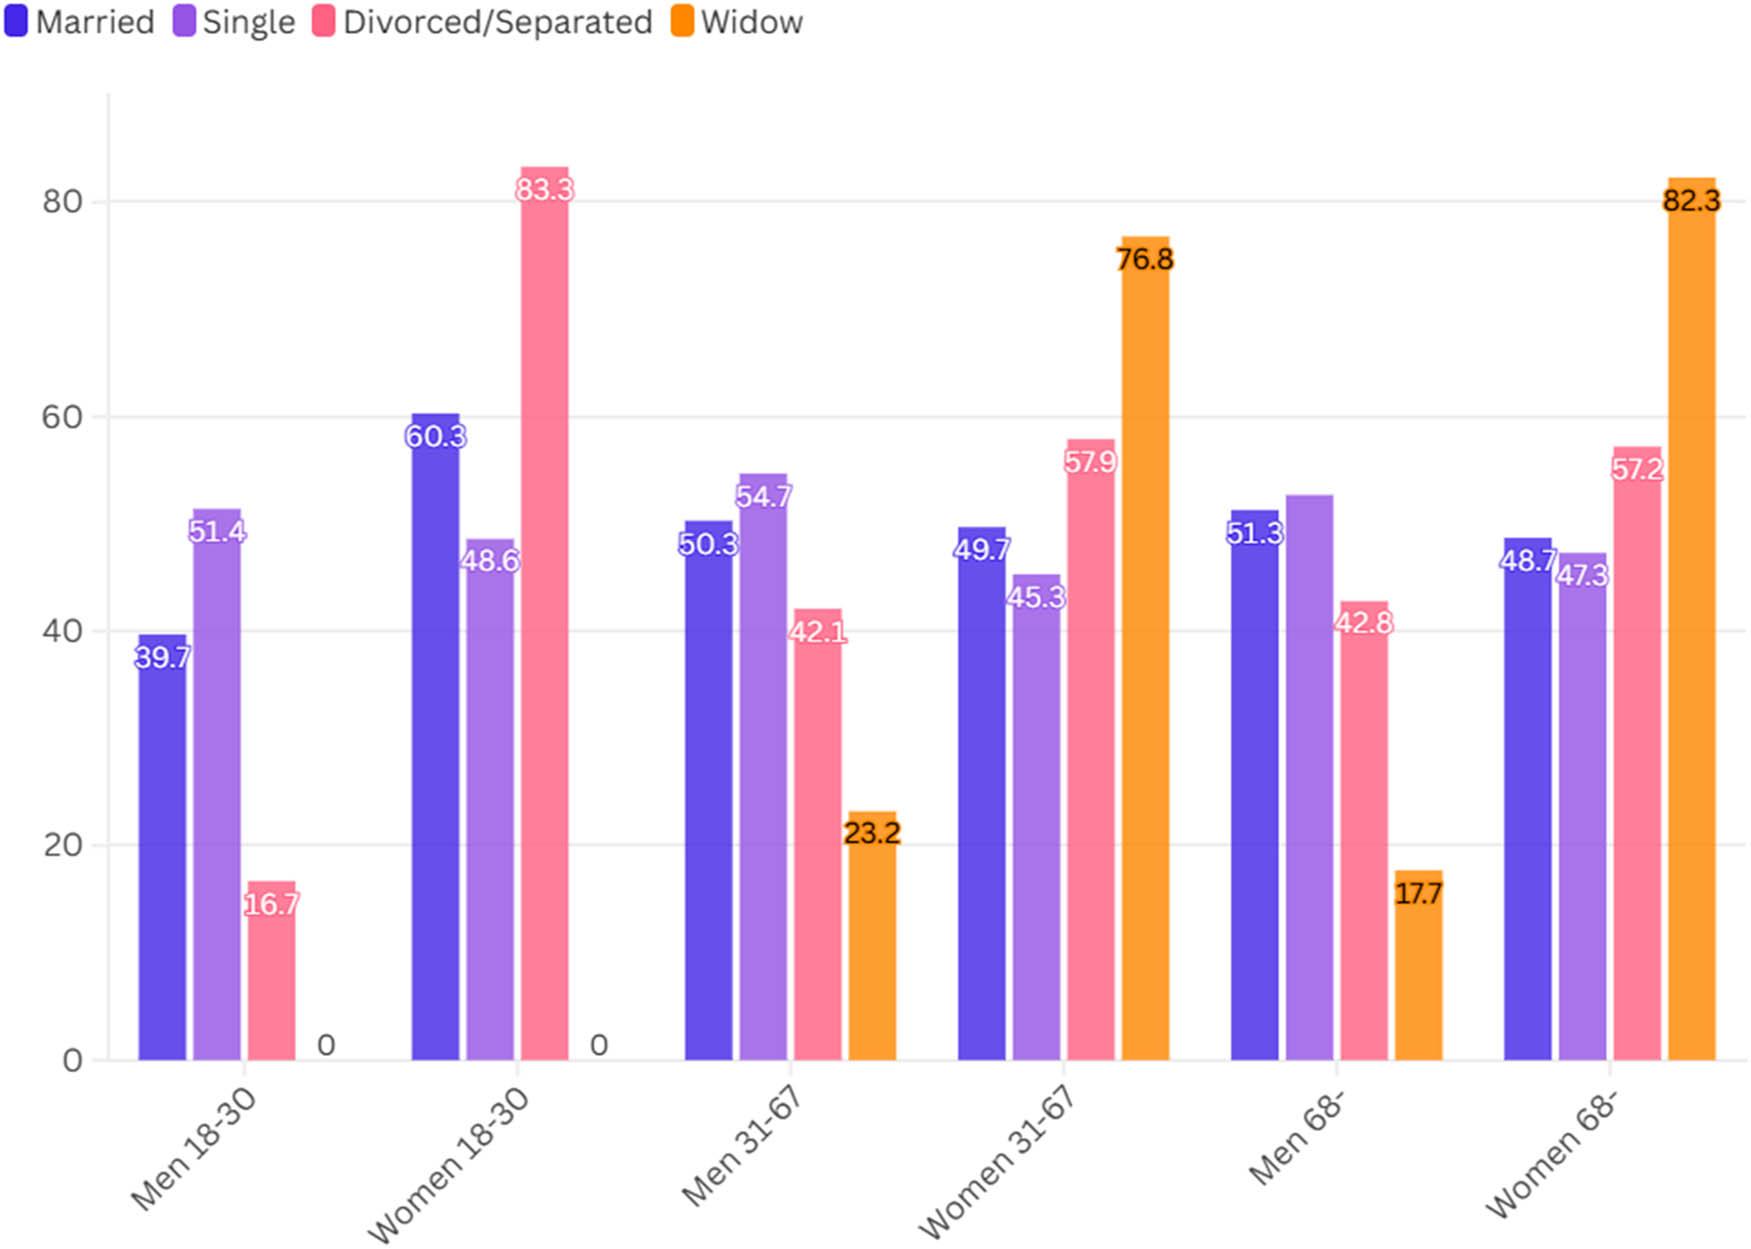
Figure 3
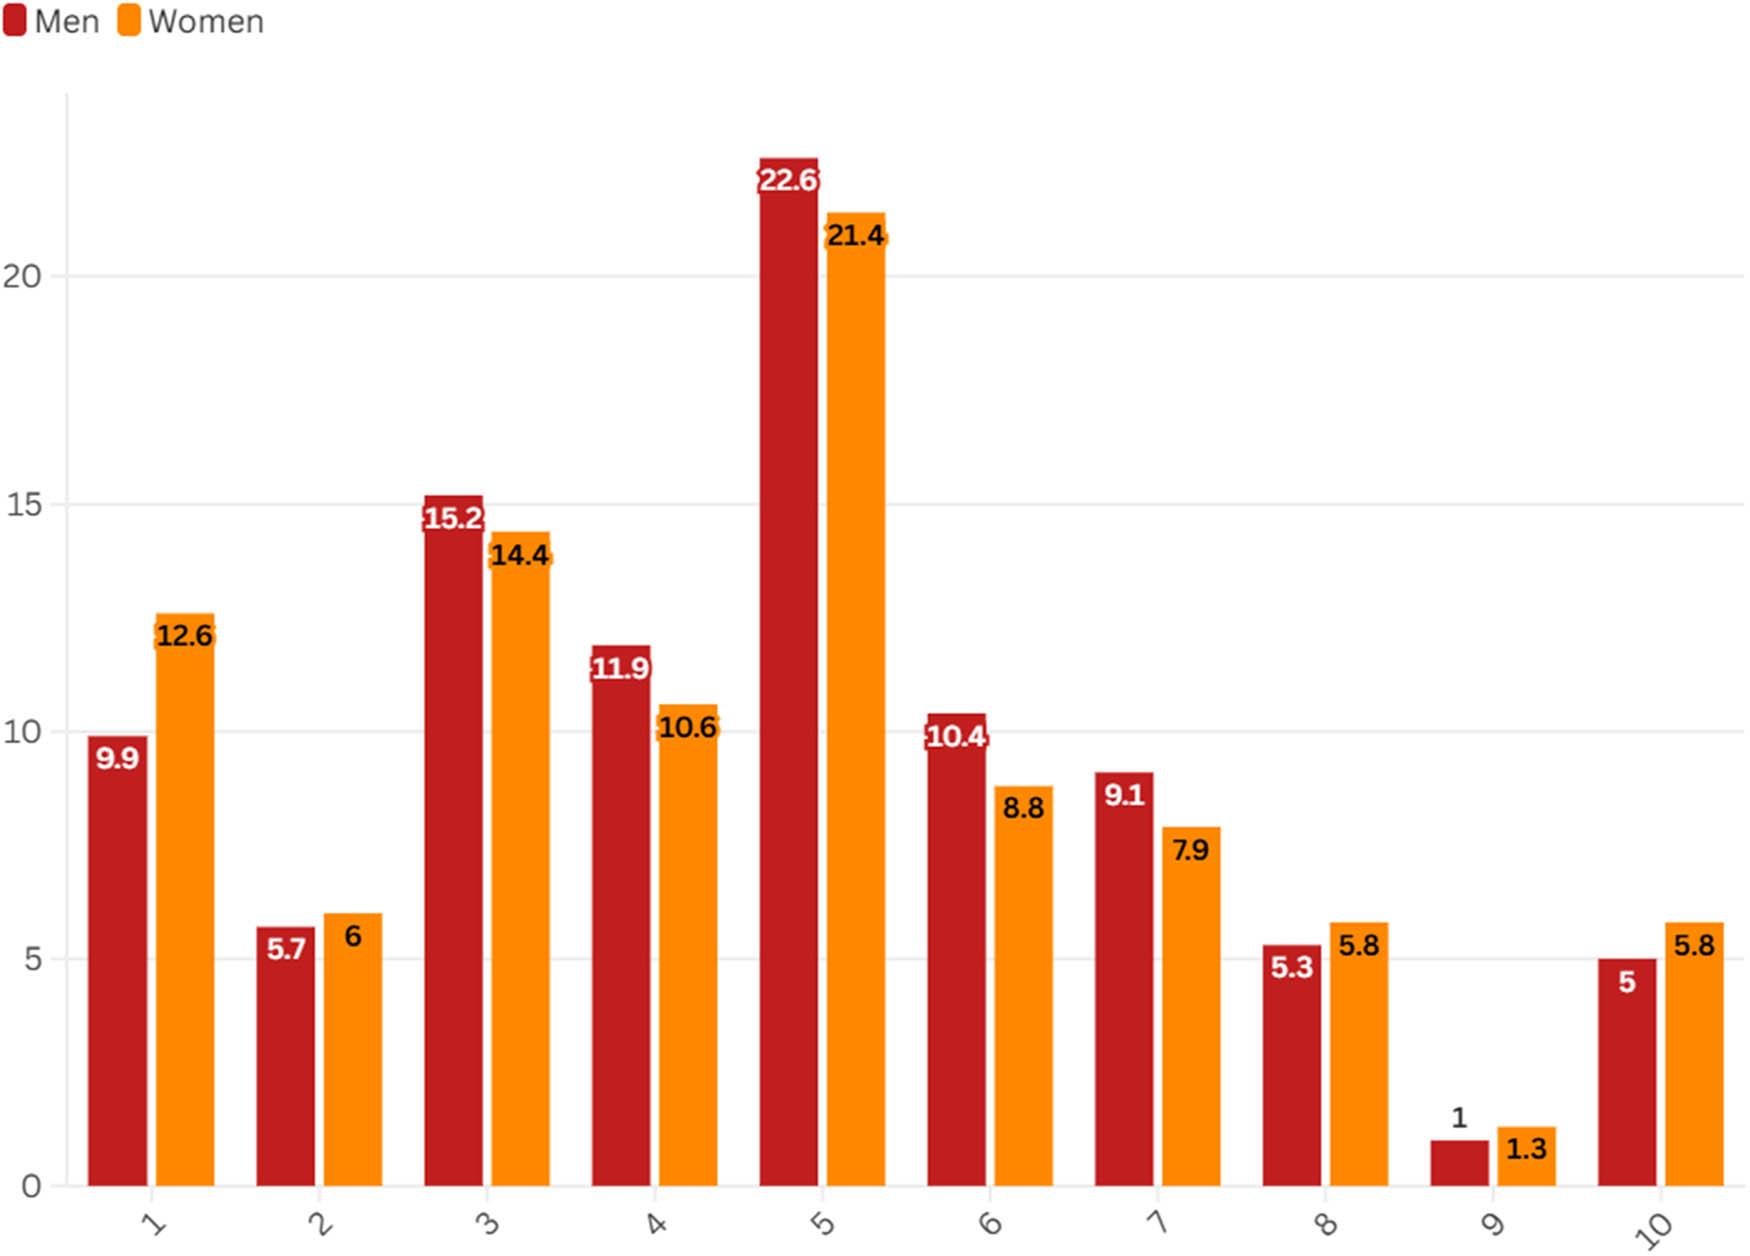
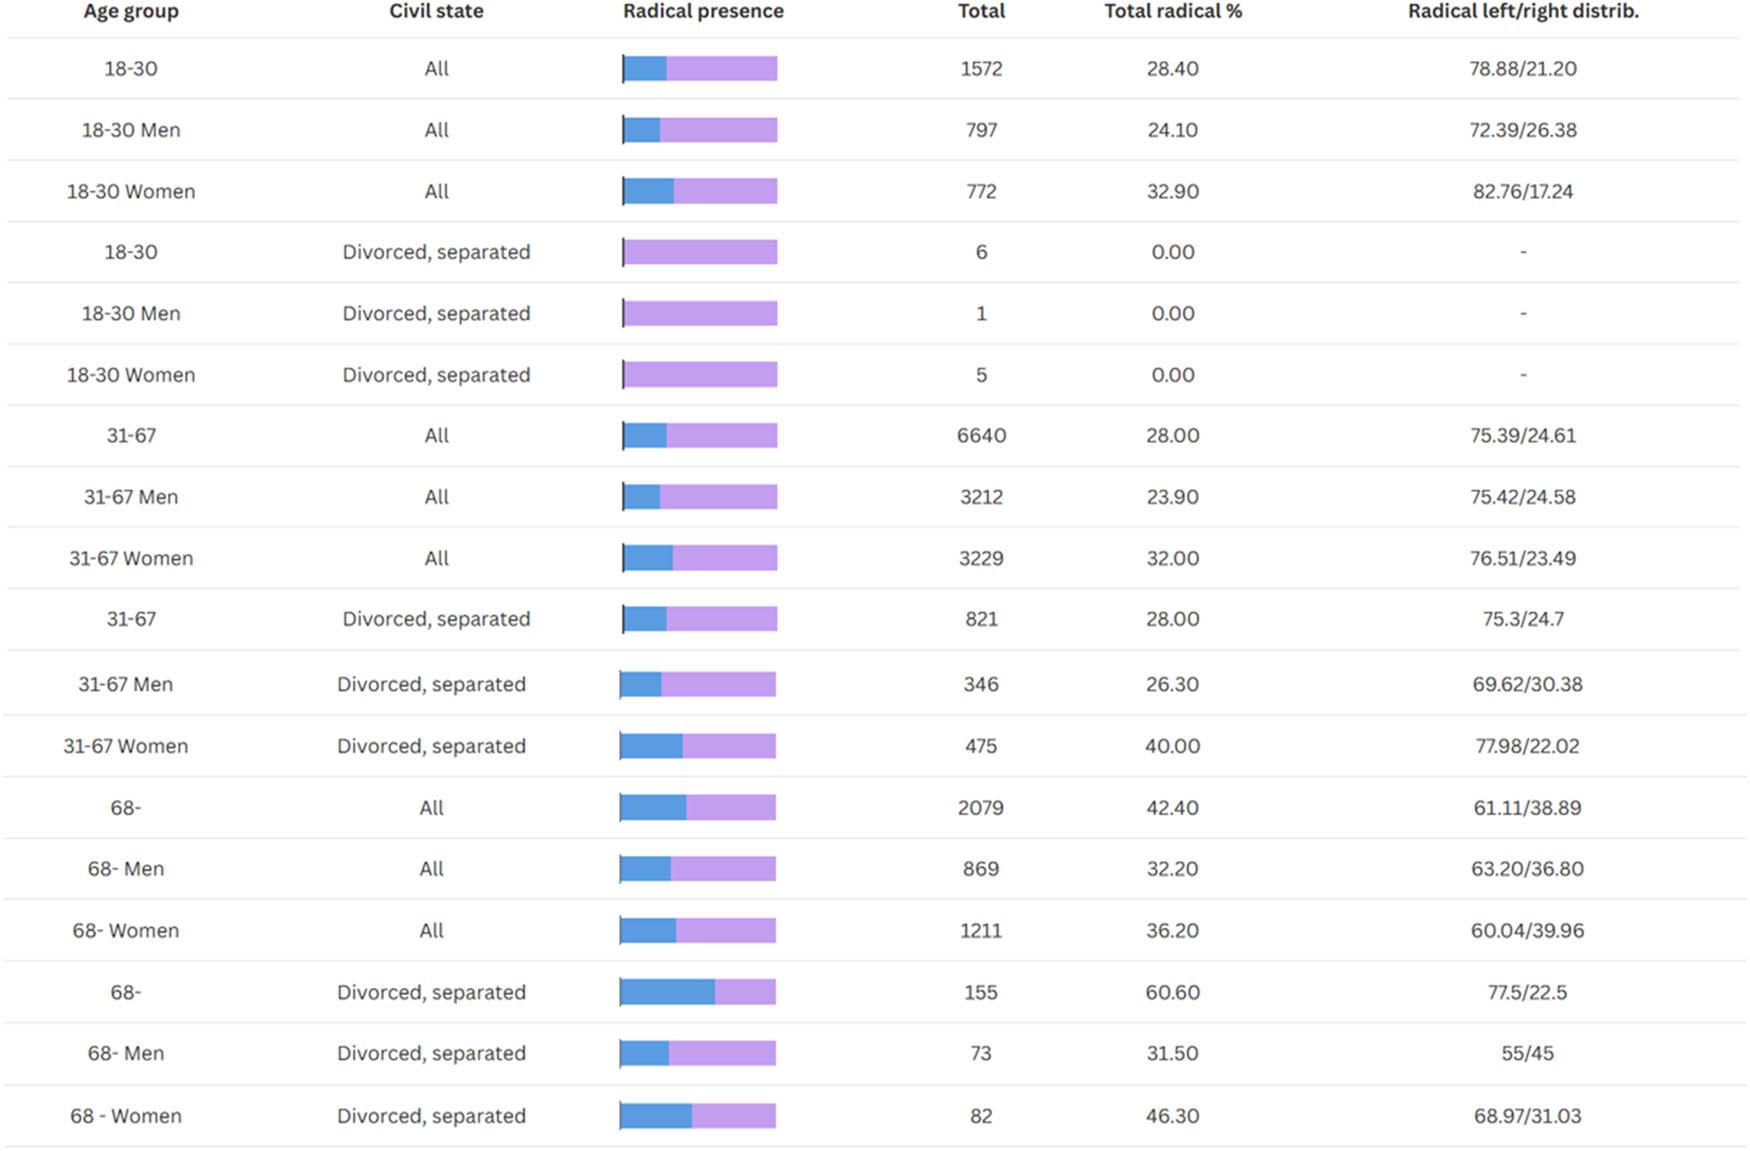
Figure 4
Risk estimate analysis_
| 95% Confidence interval | |||
|---|---|---|---|
| Value | Lower | Upper | |
| OR for marital status | 1.209 | 1.052 | 1.389 |
| For cohort ideological self-location = Non-radical | 1.064 | 1.014 | 1.116 |
| For cohort ideological self-location = Radical | 0.880 | 0.804 | 0.964 |
| No. of valid cases | 10,090 | ||
Chi-square test_
| Value | df | Asymptotic significance (2-sided) | |
|---|---|---|---|
| Pearson chi-square | 3 | <0.001 | |
| Likelihood ratio | 158,620 | 3 | <0.001 |
| Linear-by-linear association | 71,976 | 1 | <0.001 |
| No. of valid cases | 10,090 | ||
Regression model 1_
| B | S.E. | Wald | df | Sig. | Exp(B) | ||
|---|---|---|---|---|---|---|---|
| Step 1ª | Marital status | 0.187 | 0.022 | 71.650 | 1 | <0.001 | 1.205 |
| Constant | −1.139 | 0.046 | 611.754 | 1 | <0.001 | 0.320 | |
Symmetric measures test_
| Value | Approximate significance | ||
|---|---|---|---|
| Nominal by Nominal | Phi | 0.125 | <0.001 |
| Cramer’s V | 0.125 | <0.001 | |
| No. of valid cases | 10,090 | ||
Regression model 2_
| 95% Confidence interval for Exp(B) | |||||||||
|---|---|---|---|---|---|---|---|---|---|
| Ideological self-locationa | B | Std. error | Wald | df | Sig. | Exp(B) | Lower bound | Upper bound | |
| Radical | Intercept | 0.014 | 0.086 | 1 | 0.872 | ||||
| Married | −0.340 | 0.075 | 1 | <0.001 | 0.712 | 0.614 | 0.825 | ||
| Single | −0.053 | 0.084 | 1 | 0.526 | 0.948 | 0.805 | 1.117 | ||
| Widow | 0.157 | 0.107 | 1 | 0.140 | 1.170 | 0.949 | 1.443 | ||
| Divorced/Separated | 0b | . | . | 0 | . | . | . | . | |
| Man | −0.442 | 0.045 | 97.009 | 1 | <0.001 | 0.643 | 0.589 | 0.702 | |
| Woman | 0b | . | . | 0 | . | . | . | . | |
| 18–30 years | −0.660 | 0.091 | 52.096 | 1 | <0.001 | 0.517 | 0.432 | 0.618 | |
| 31–67 years | −0.551 | 0.060 | 85.205 | 1 | <0.001 | 0.576 | 0.513 | 0.648 | |
| 68− | 0b | . | . | 0 | . | . | . | . | |