
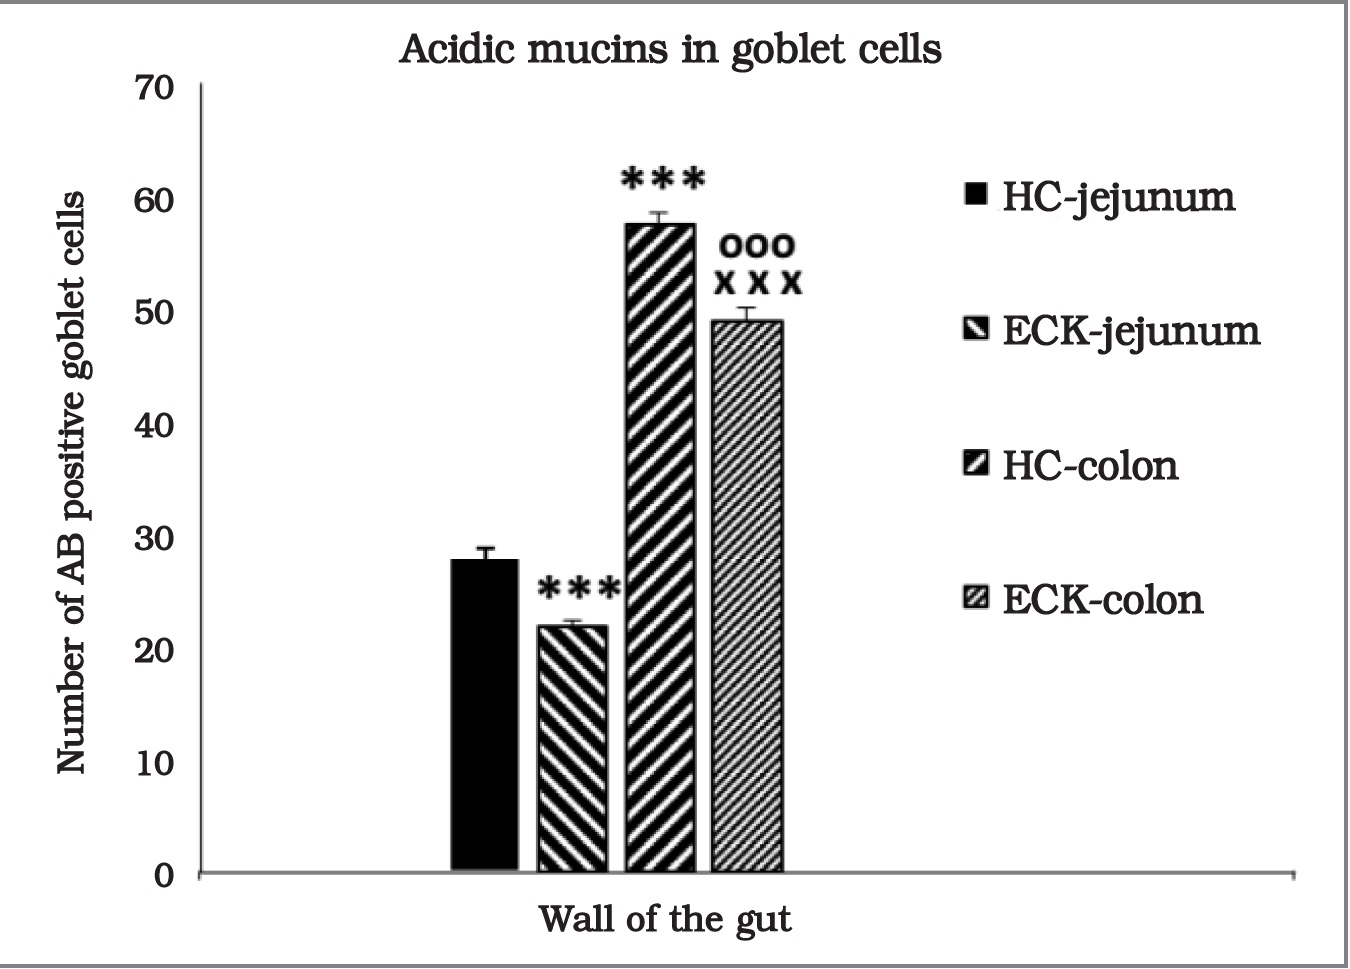
Fig 1
Graph illustrating the average number of alcian blue (AB) positive GCs in gut for each condition. Note that AB positive GCs were decreased in the jejunum of ECK piglets as well as in the colon of ECK piglets (***indicates the values differ significantly from the from the jejunum of HC piglets at p<0.001; xxx indicates the values differ significantly from the colon of HC piglets at p< 0.001). Greater numbers of AB positive GCs were observed in colon of both groups of piglets (***indicates the values differ significantly from the jejunum of HC piglets at p< 0.001; oooindicates the values differ significantly from the jejunum ECK piglets at p< 0.001). Data are expressed as mean ± S.E.M., ANOVA and Tukey–Kramer tests were used.
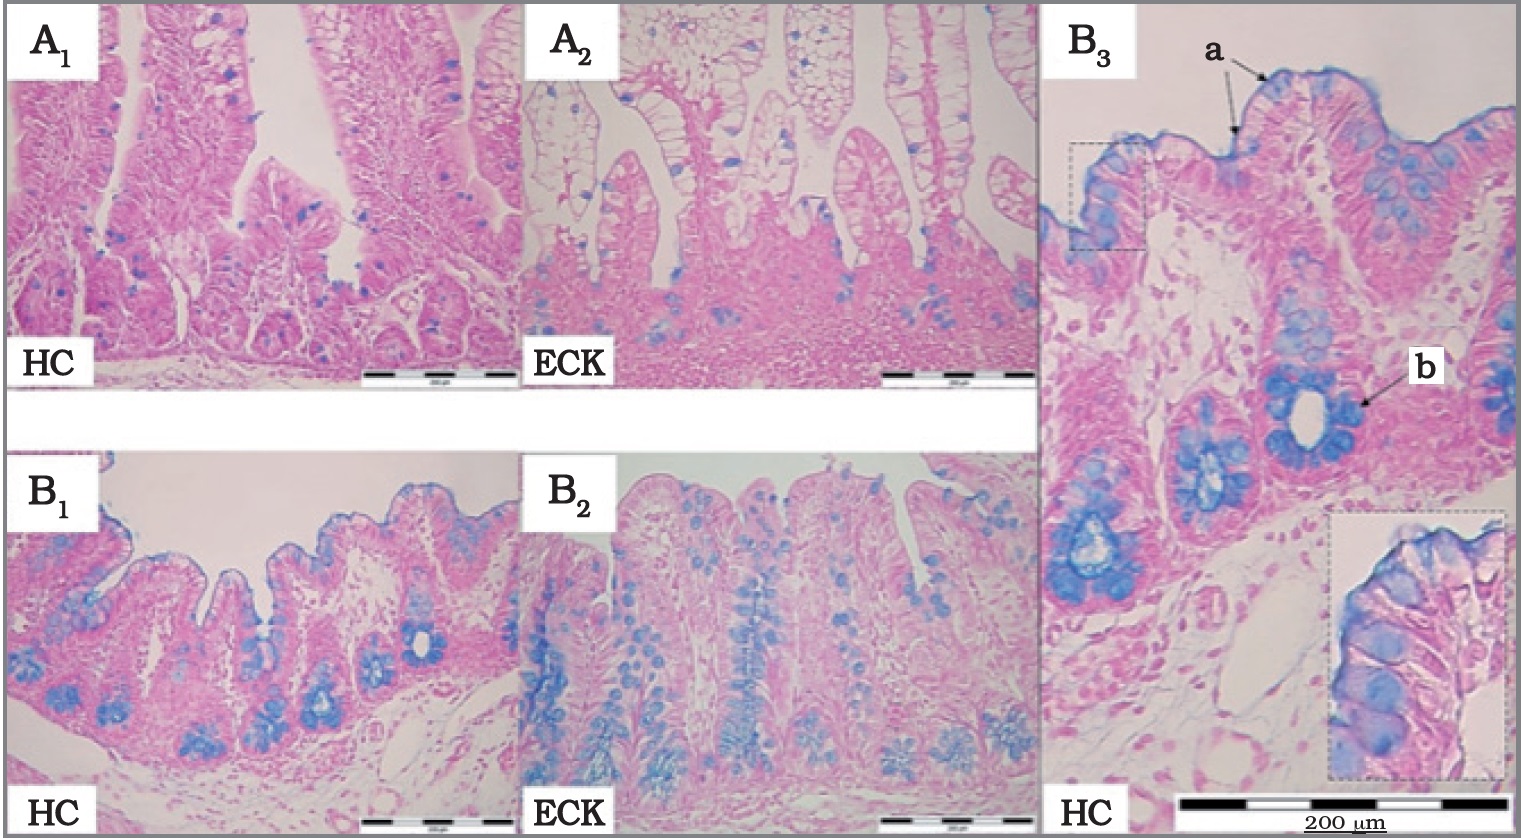
Fig. 2
Representative microphotographs of histochemical analysis of GCs producing acidic mucins by Alcian blue staining in the gut for each condition. (HC – healthy control A1 –jejunum and B1 - colon; ECK – infected experimental group, A2 – jejunum and B2,3 – colon, a – positive thin mucus layer, b – strongly positive cytoplasm of GCs). Scale bar = 200 μm.
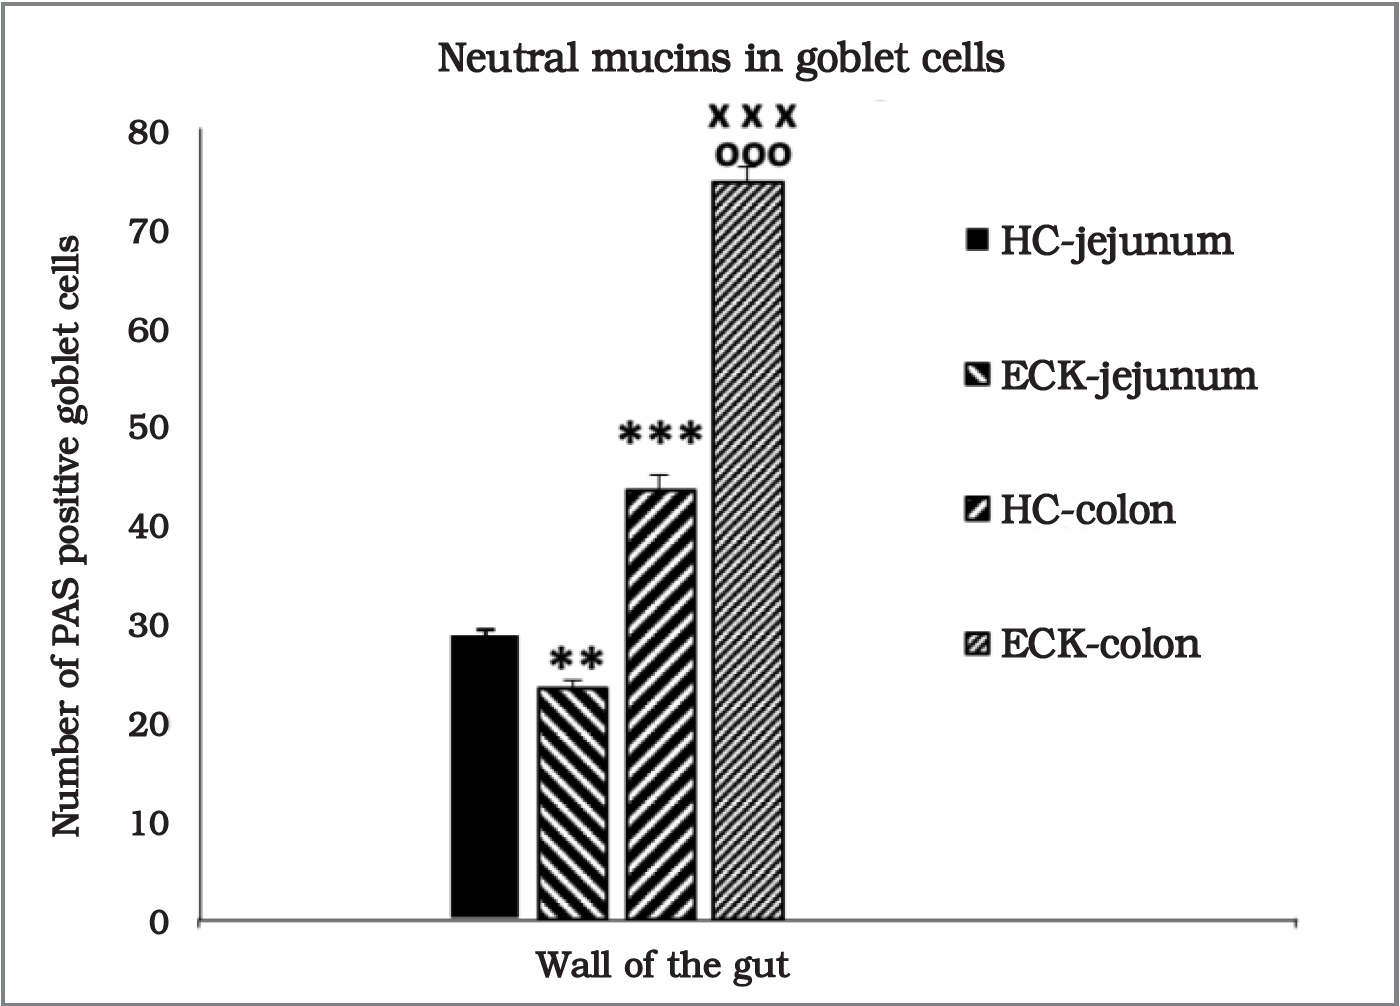
Fig. 3
Graph illustrating the average number of PAS positive GCs in gut for each condition. Note that PAS positive GCs were decreased in the jejunum of ECK piglets (**indicates the values differ significantly from the from the jejunum of HC piglets at p<0.01). Greater numbers of PAS positive GCs were observed in colon of both groups of piglets (***indicates the values differ significantly from the jejunum of HC piglets at p< 0.001; oooindicates the values differ significantly from the jejunum ECK piglets at p<0.001). Significant increase of PAS positive GCs was detected also in colon of ECK piglets in comparison to HC piglets (xxxindicates the values differ significantly from the colon of HC piglets at p<0.001). Data are expressed as mean ± S.E.M., ANOVA and Tukey–Kramer tests were used.
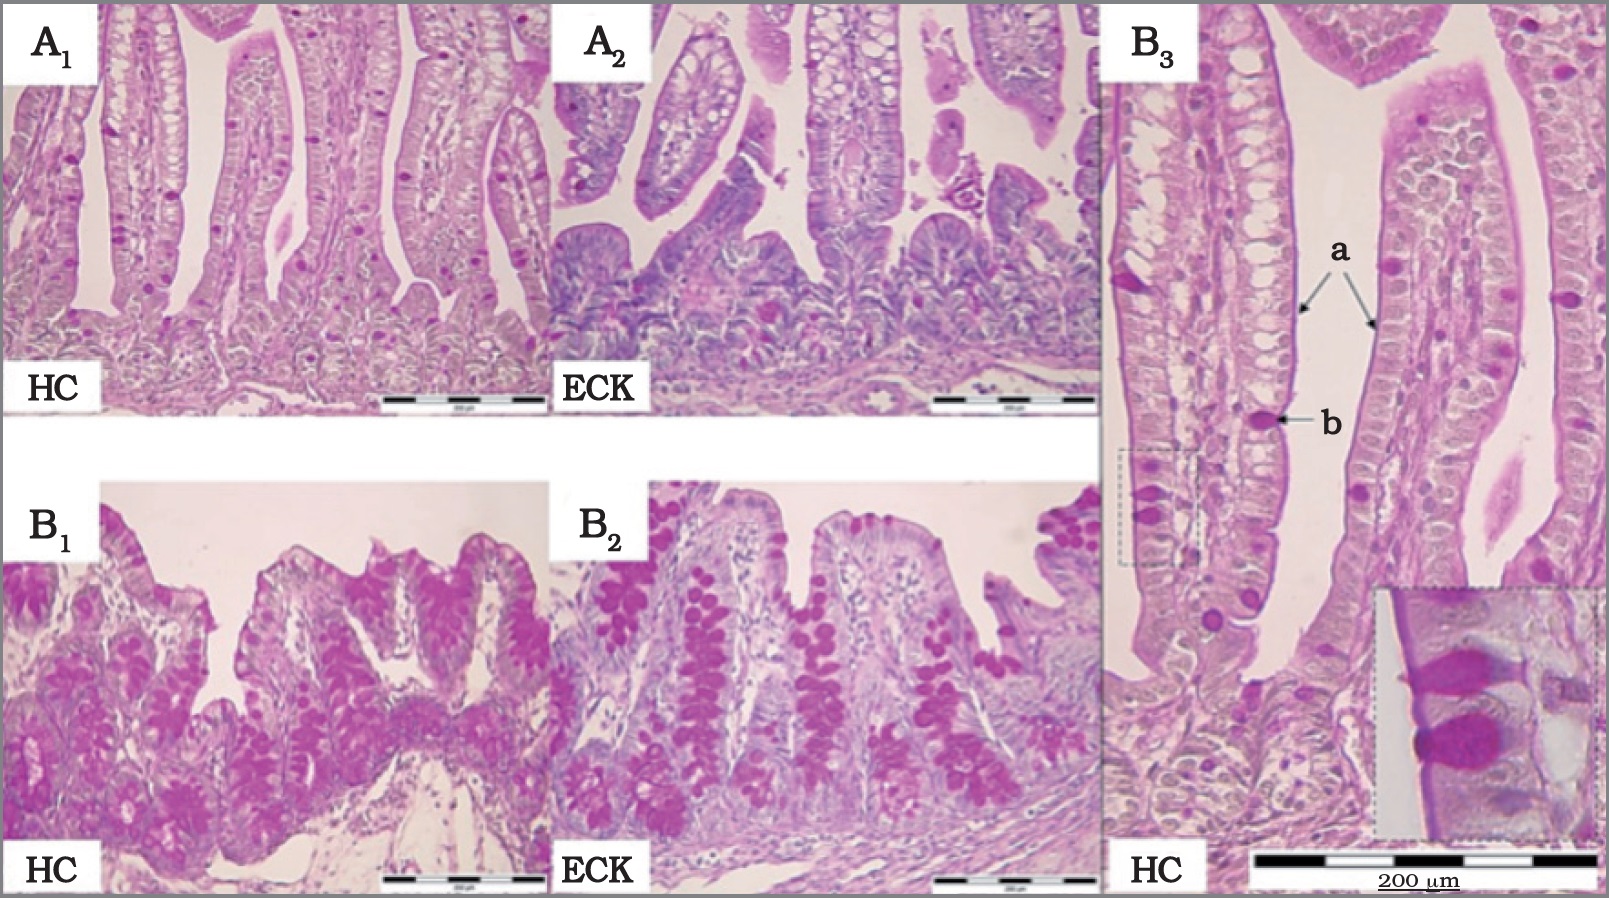
Fig. 4
Representative microphotographs of histochemical analysis of GCs producing neutral mucins by PAS-reaction in the gut for each condition. (HC – healthy control, A1 – jejunum and B1 – colon; ECK – infected experimental group, A2,3 – jejunum and B2 – colon a – positive glycocalyx, b – strongly PAS positive cytoplasm of GCs). Scale bar = 200 μm.