
Table 1
Composition and treatment matrix of traditional and modified bituminous mixtures (per 1,000 g aggregate batch)
| Mix designation | Bitumen content (%) | Traditional sandstone filler (g) | Fuller’s earth modifier (g) | Total filler weight (g) | Replacement level (% by weight of filler) |
|---|---|---|---|---|---|
| Traditional mix (control) | 5.00% | 400 | 0 | 400 | 0% |
| 5% modified mix | 5.00% | 380 | 20 | 400 | 5% |
| 10% modified mix | 5.00% | 360 | 40 | 400 | 10% |
Source: Author’s contribution.
Table 2
Specific gravity of coarse aggregate
| S. No. | Parameter | Weight (g) |
|---|---|---|
| 1 | A1 | 1,875 |
| 2 | A2 | 634 |
| 3 | B | 1,975 |
| 4 | C | 1,964 |
| 5 | A | 1,241 |
Source: Author’s contribution.
A1 = Weight of suspended saturated aggregate in water.
A2 = Weight of suspended basket in water.
A = (A1–A2) = Weight of saturated aggregate submerged in water.
B = Weight of saturated surface dry aggregate in air.
C = Weight of oven-dried aggregate.
The equation used for the calculation of specific gravity is.
.
Table 3
Coarse aggregate gradation
| Sieve # | Size (mm) | Retained weight (g) | % retained | Cumulative % retained | % passing |
|---|---|---|---|---|---|
| 1.5 | 1.5 | 0 | 0 | 0 | 100 |
| 1 | 1 | 0 | 0 | 0 | 100 |
| ¾ | 0.75 | 78 | 3 | 3 | 97 |
| ½ | 0.5 | 1237 | 53 | 56 | 44 |
| 3/8 | 0.375 | 815 | 35 | 91 | 9 |
| #4 | 0.1875 | 185 | 8 | 99 | 1 |
Source: Author’s contribution.
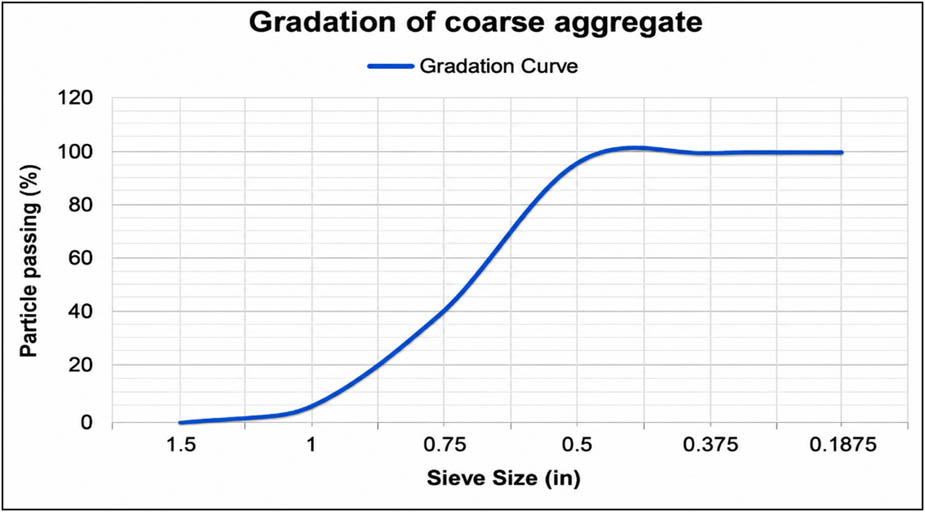
Figure 1
Gradation curve of coarse aggregate.
Source: Author’s contribution.
Table 4
Fine aggregate gradation
| Sieve # | Size (mm) | Retained weight (g) | % retained | Cumulative % retained | % passing |
|---|---|---|---|---|---|
| 5 | 5 | 795 | 1 | 1 | 99 |
| 8 | 144 | 651 | 18 | 9 | 81 |
| 16 | 269 | 382 | 34 | 52 | 48 |
| 30 | 1 | 381 | 0 | 52 | 48 |
| 50 | 213 | 168 | 27 | 79 | 21 |
| 100 | 81 | 87 | 10 | 89 | 11 |
Source: Author’s contribution.
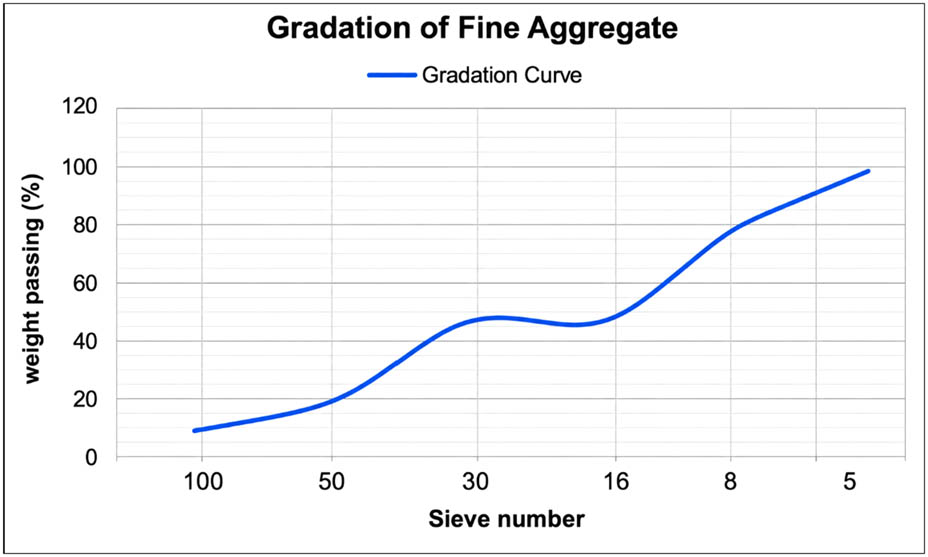
Figure 2
Fine aggregate gradation curve.
Source: Author’s contribution.
Table 5
Penetration test of bitumen
| S. No. | Sample | Needle reading | Value (0.1 mm) | Penetration value (0.1 mm) |
|---|---|---|---|---|
| 1 | 1 | Initial reading | 37 | 8 |
| Final reading | 45 | |||
| 2 | 2 | Initial reading | 38 | 6 |
| Final reading | 44 | |||
| 3 | 3 | Initial reading | 38 | 6 |
| Final reading | 44 | |||
| Mean reading | 6.7 |
Source: Author’s contribution.
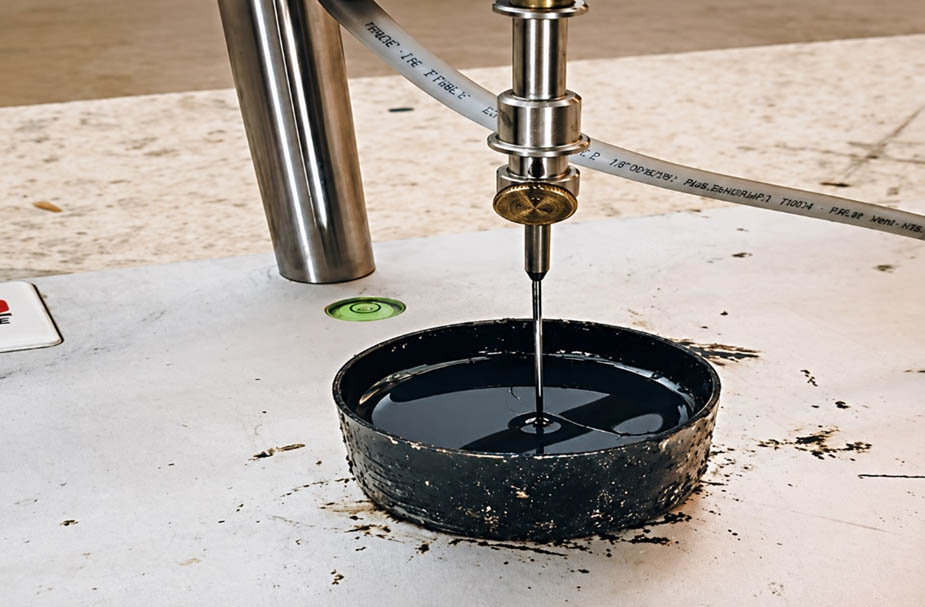
Figure 3
Penetration test of bitumen.
Source: Author’s contribution.
Table 6
Ductility test of bitumen
| S. No. | Sample | Ductility value (cm) |
|---|---|---|
| 1 | 1 | 83 |
| 2 | 2 | 87 |
| 3 | 3 | 93 |
| Average | 87.67 |
Source: Author’s contribution.
Table 7
Softening point of bitumen samples
| S. No | Sample | Softening point value (°C) |
|---|---|---|
| 1 | 1 | 41.3 |
| 2 | 2 | 42.1 |
| Average | 41.75 |
Source: Author’s contribution.
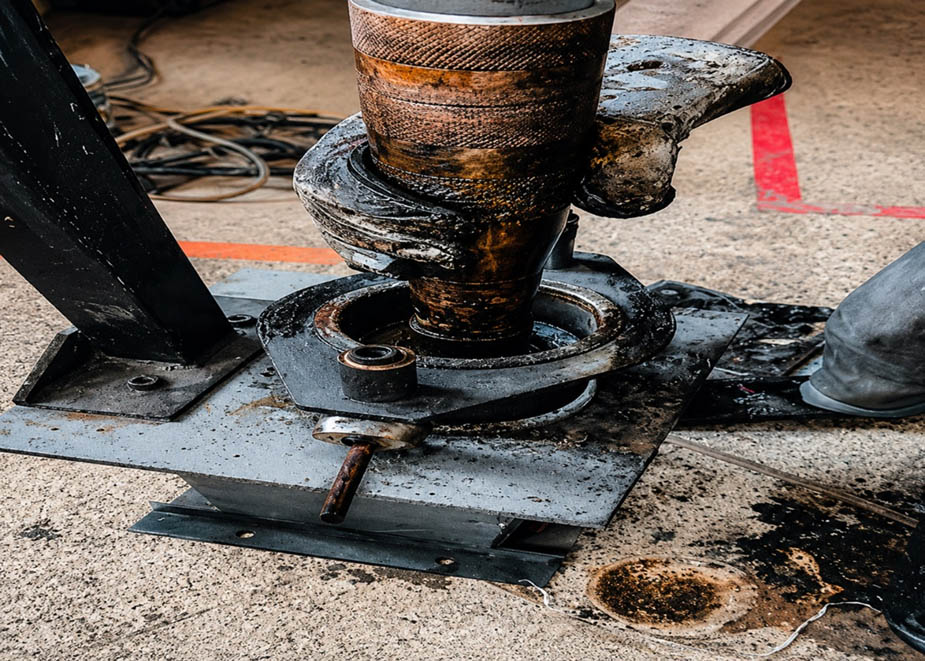
Figure 4
Marshal compactor.
Source: Author’s contribution.
Table 8
Aggregate proportion for Marshall mix
| S. No. | Aggregate (mm) | Weight (g) |
|---|---|---|
| 1 | 10 | 200 |
| 2 | 4.75 | 300 |
| 3 | 2.6 | 100 |
| 4 | Filler | 400 |
Source: Author’s contribution.
Table 9
Traditional sample results
| Bitumen content (% by weight of mix) | Height of the cake (cm) | Diameter of the cake (cm) | Average flow value (mm) | Average stability value (kN) | Stability value after the correction factor of 1.14 (kN) |
|---|---|---|---|---|---|
| 3% | 5.8 | 10 | 2.3 | 3.4 | 3.88 |
| 4% | 5.8 | 10 | 3.23 | 4.05 | 4.62 |
| 5% | 5.8 | 10 | 2.73 | 4.98 | 5.68 |
| 6% | 5.8 | 10 | 3.7 | 4.25 | 4.85 |
Source: Author’s contribution.
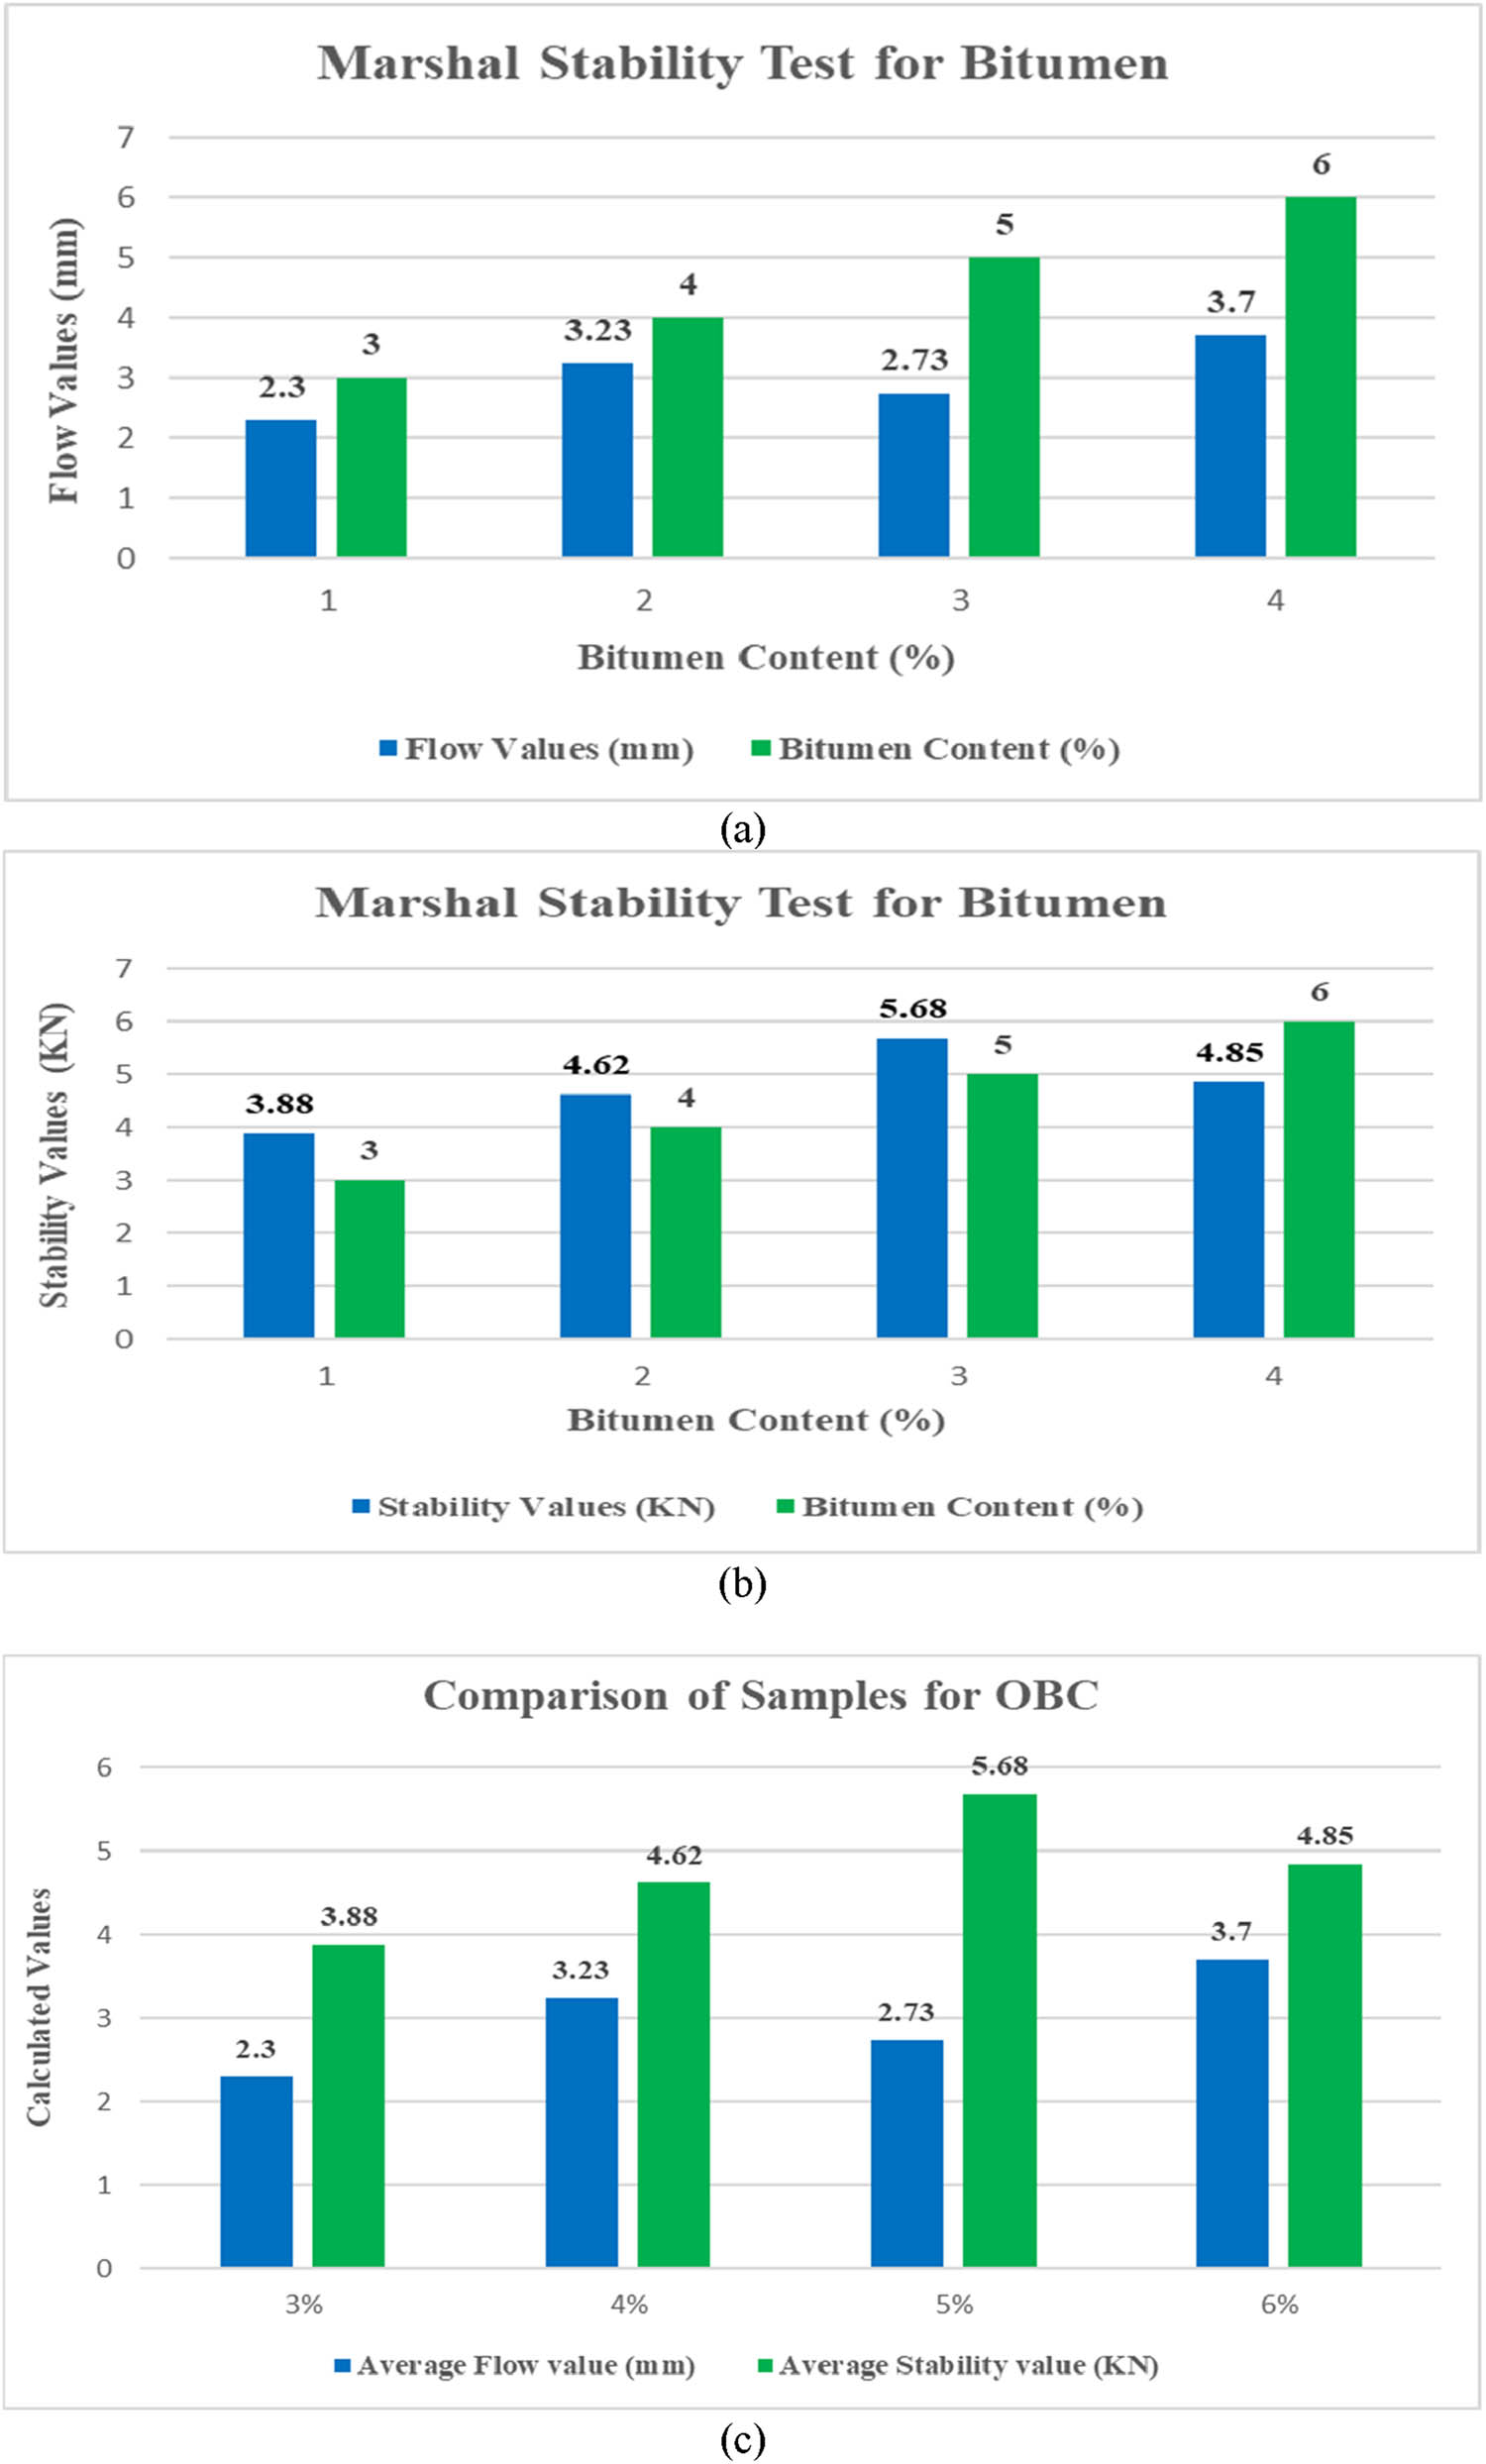
Figure 5
(a) Traditional sample flow value, (b) traditional sample stability value, and (c) result comparison for the traditional sample.
Source: Author’s contribution.
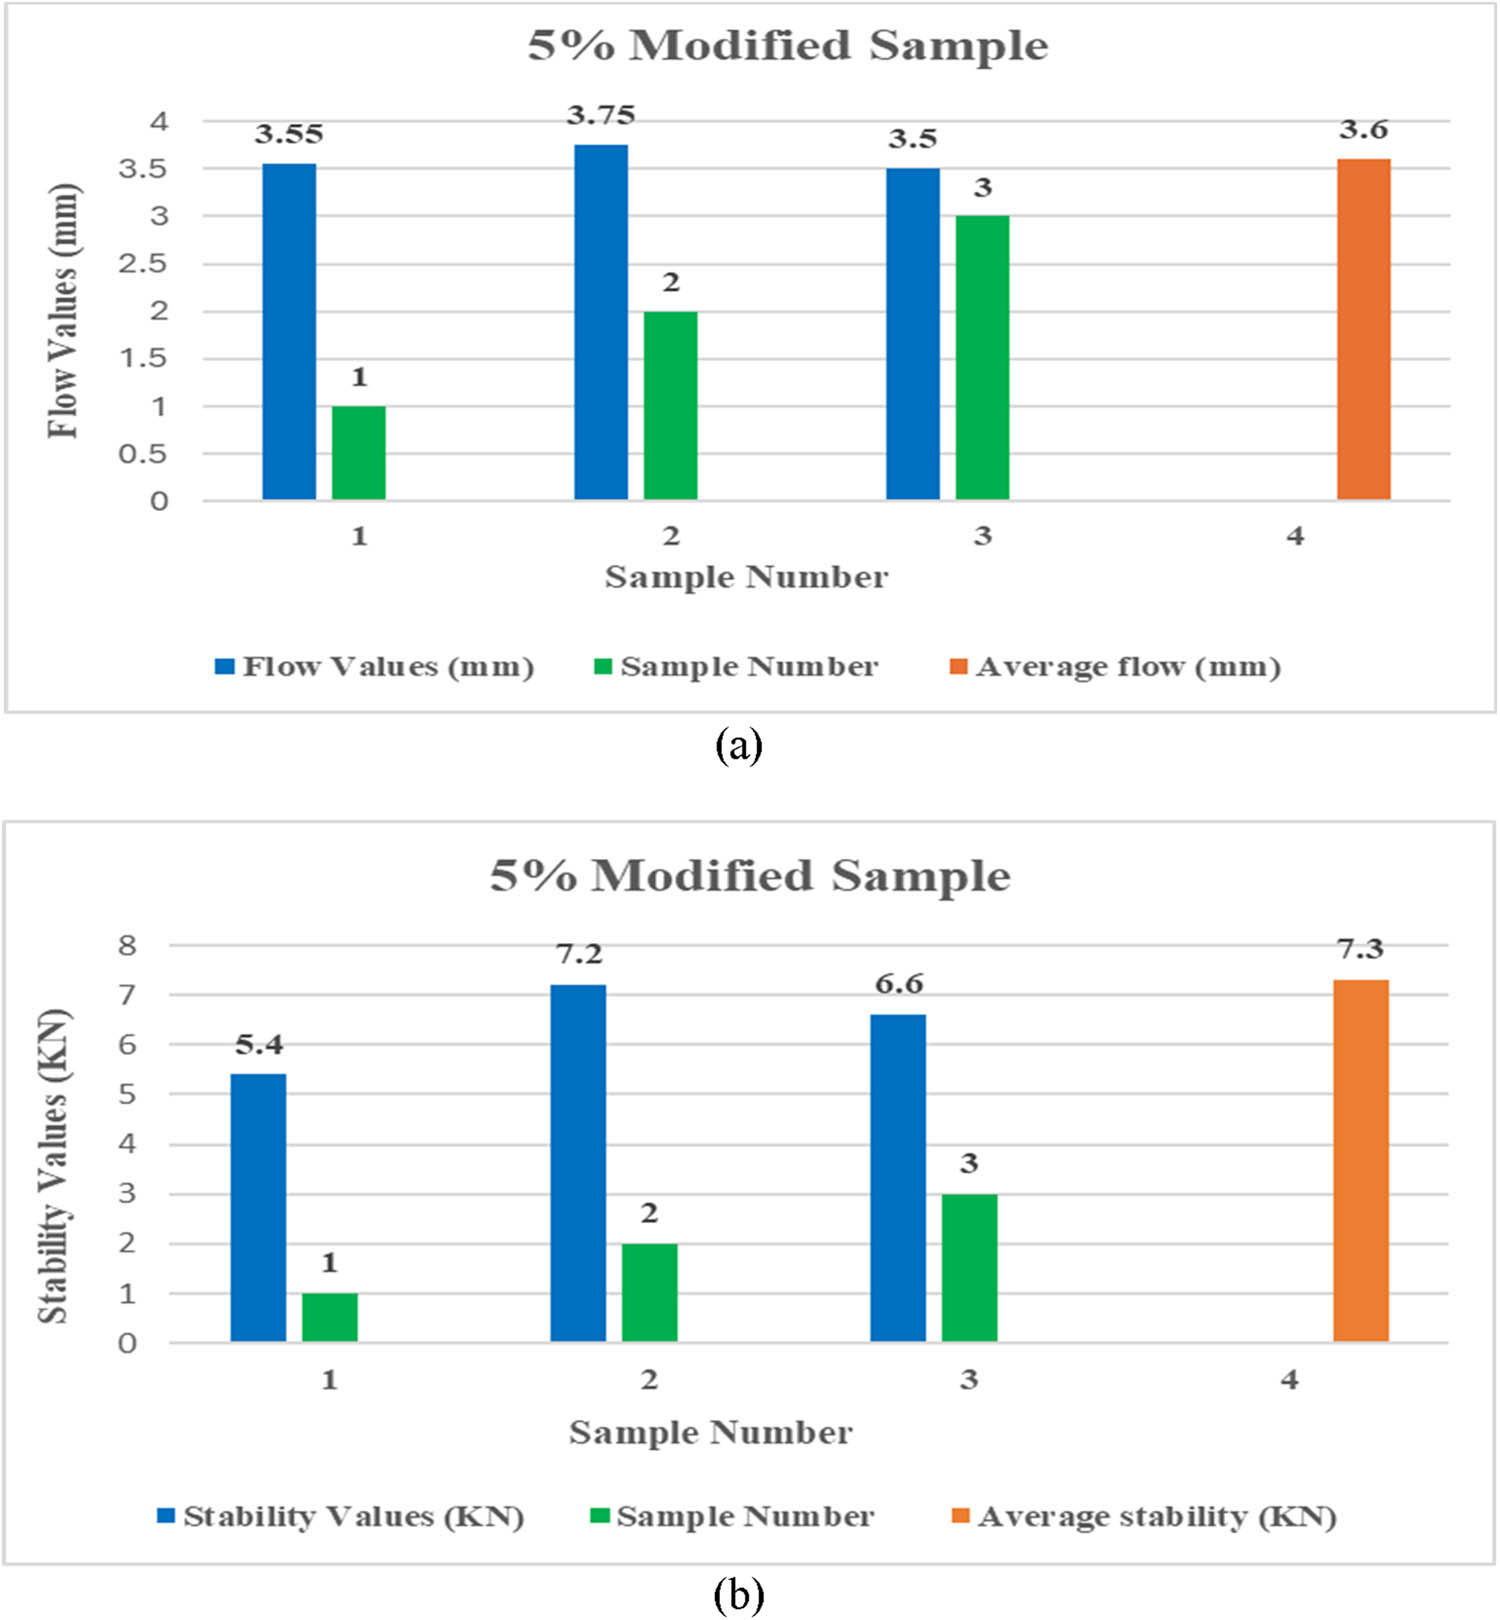
Figure 6
(a) Flow value of 5% modified sample and (b) stability value of 5% modified sample.
Source: Author’s contribution.
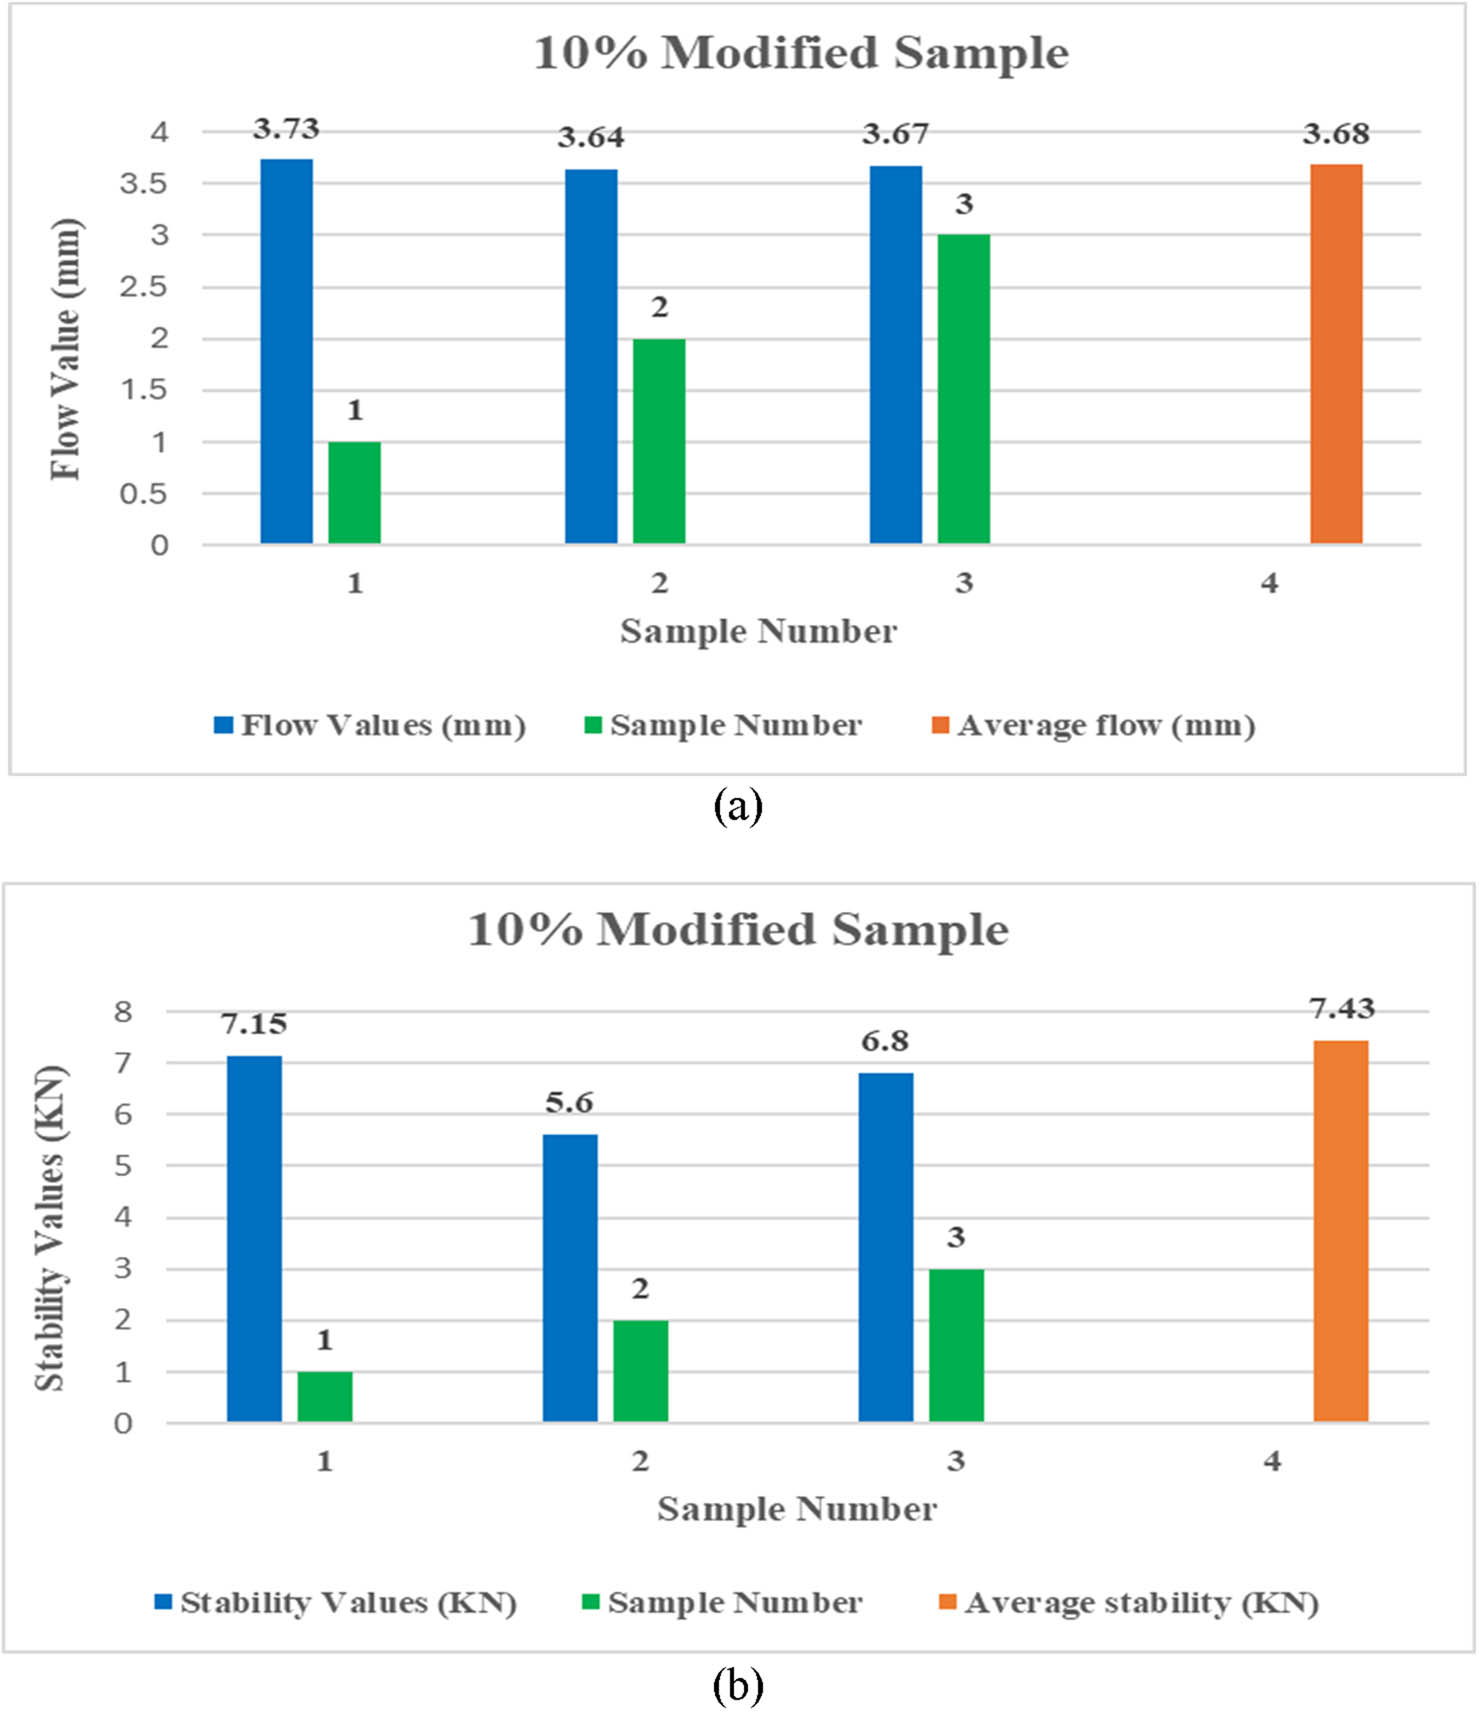
Figure 7
(a) Flow value of 10% modified sample and (b) stability value of 10% modified sample.
Source: Author’s contribution.
Table 10
Flow and stability values of traditional and modified samples
| Sample | Average flow (mm) | Average stability (kN) |
|---|---|---|
| Traditional | 2.73 | 5.68 |
| 5% modified | 3.6 | 7.30 |
| 10% modified | 3.68 | 7.43 |
Source: Author’s contribution.
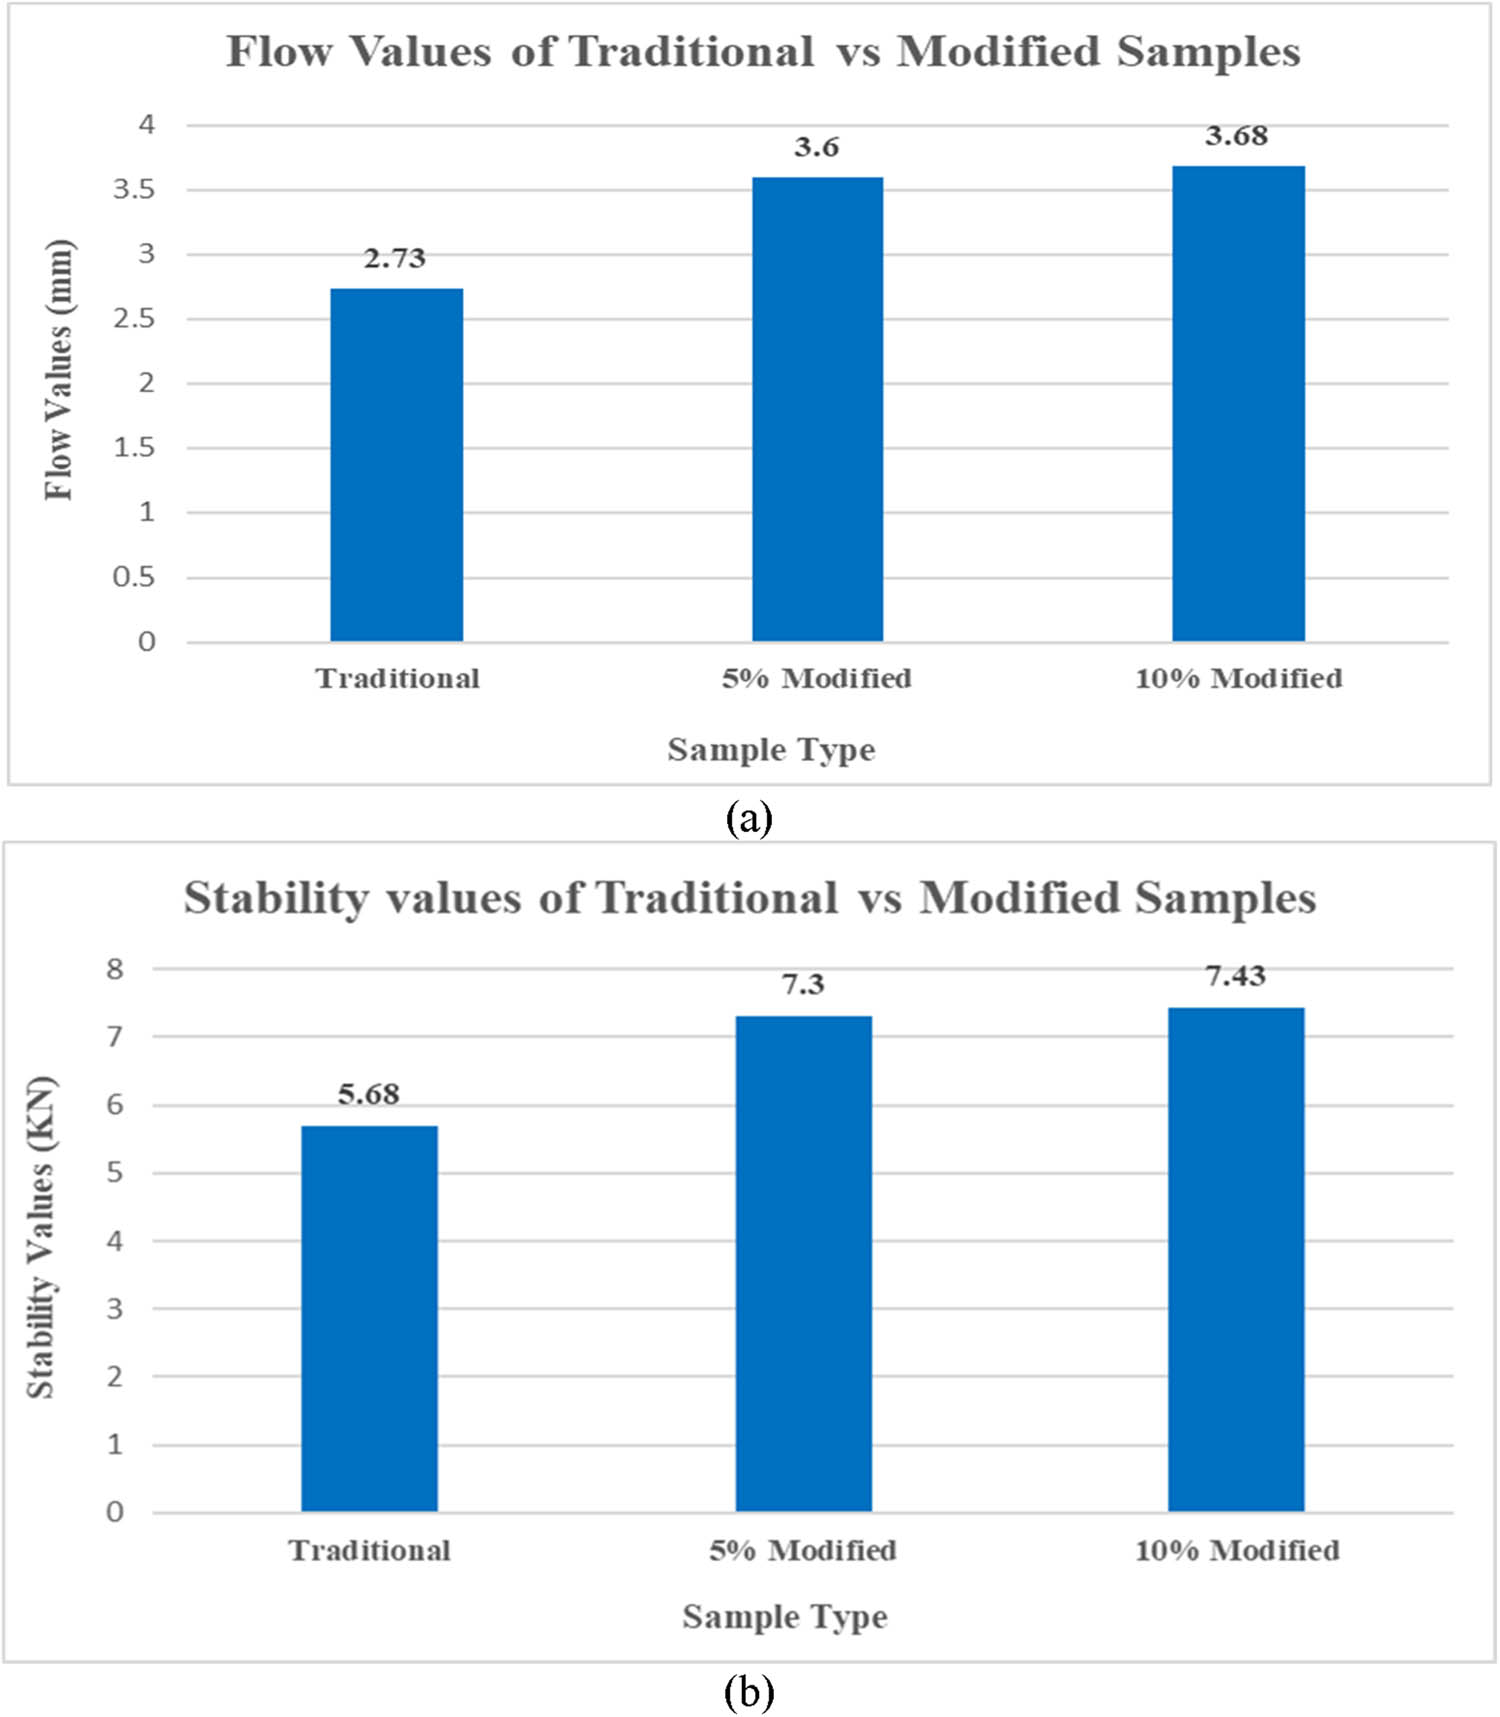
Figure 8
(a) Flow values for traditional vs modified mix and (b) stability values for traditional vs modified mix.
Source: Author’s contribution.
Table 11
Percentage increase in 5% modified sample
| Parameter | Traditional sample | 5% modified sample | Percentage increase |
|---|---|---|---|
| Stability value (kN) | 5.68 | 7.30 | 28.42 |
| Flow value (mm) | 2.73 | 3.6 | 31.87 |
Source: Author’s contribution.