
1. Introduction
In developing countries such as Pakistan, rutting, cracking, and deformation of flexible pavements are common problems due to poor mix quality, extreme climatic conditions, and heavy, overloaded traffic [1]. Permanent deformation is considerably aggravated by summer temperatures above 40°C and the high percentage of heavy goods vehicles [2]. The bituminous surface course of aggregates, fillers, and binder [1] is the most susceptible to damage. The properties of the filler are very important, it is responsible for filling the voids, influencing the rheology of the mastic and directly affecting the stability and durability of the mix [3,4,5].
Growing traffic and limited resources have led to a rise in interest in sustainable additives such as fly ash, reclaimed polyethylene, and Fuller’s earth. These improve mechanical properties, temperature resistance, and waste management [6,7,8,9]. Brick dust and iron dust have been found to improve the stability and flow values of asphalt mixes considerably [10,11]. Studies have examined the use of alternative materials, such as recycled concrete aggregates, as filler substitutes that provide improved performance in bituminous base layers [12]. A wide range of fillers, such as limestone, cement, and fly ash, have been well reviewed for their effects on mix properties [13,14]. The influence of filler type on the overall performance of the pavement has been demonstrated by research on the strength of flexible pavements [15].
Recent studies have investigated the application of red mud as partial replacement to fillers and have shown improved stability and resistance to moisture damage [16]. E-waste fibre was used as an aggregate replacement and found to improve the tensile strength and rutting resistance [17]. The experimental study of modified bitumen has shown that polymer additives increase the Marshall stability by 25–40% [18]. Fly ash and sisal fibre have been employed as stabilizing additives in bituminous concrete mixes for improved performance [19]. Modified bitumen applications in highway construction have shown increased durability and decreased maintenance costs [20,21]. The different modifiers for flexible pavement have been discussed in the literature, which validates the use of waste-based materials [22,23,24].
Recent international research further emphasizes waste valorization. Choudhary et al. [25] reviewed 19 waste fillers and found that 9 exhibited higher Marshall stability than conventional mixes. Rice husk ash improved moisture resistance by 7%, rutting resistance by 29%, and fatigue life by 48.61% [1,26]. Sugarcane bagasse ash increased the Marshall stability from 7.6 to 9.0 kN with an 8% replacement [27,28]. Sewage sludge ash at a concentration of 3–4% significantly improved Marshall stability [29,30,31]. Cement kiln dust, when combined with volcanic ash, enhanced stability and density [32]. Nickel, cobalt, and iron tailings exhibited significant increases in stability [33]. Phosphogypsum whiskers enhanced high-temperature performance and fatigue resistance [34]. Scanning electron microscopy (SEM) analysis revealed that alternative fillers exhibit irregular particle structures enhancing mechanical interlock and bonding [35].
In Pakistan, rutting and potholes are the dominant distresses, with bulk specific gravity significantly affecting their development [36]. Waste-derived polymers have demonstrated significant improvements in strength and moisture resistance under local climatic conditions [8].
However, there are very few comprehensive studies on Fuller’s earth as a filler modifier in developing countries. Early studies showed that mineral fillers such as kaolin clay and Fuller’s earth significantly affect the properties of paving mixtures [37]. Fuller’s earth is a naturally occurring aluminium silicate clay, with high porosity and unique adsorptive properties. It is available locally at low cost.
This research fills this gap by systematically evaluating Fuller’s earth replacement levels to improve strength, flexibility, and pavement durability. The findings are expected to provide an affordable solution for improving pavement performance in developing countries facing similar climatic and traffic challenges.
2. Materials and methodology
The experimental work was divided into two main phases: material quality assessment and sample performance evaluation. All materials were tested for appropriate ASTM standards to ensure uniformity and reliability.
2.1. Material quality testing
The quality assessments of coarse aggregate, fine aggregate, and bitumen were conducted to evaluate their suitability for bituminous mix design. The density and particle size dispersion were determined through the specific gravity (ASTM C127) and gradation (ASTM D692) of the coarse aggregates [38,39]. The gradation of the fine aggregates was checked against ASTM C33 to ensure they were of a suitable particle size distribution for construction purposes [40]. Finally, the bitumen binder was thoroughly tested for consistency, flexibility, and thermal sensitivity using penetration (ASTM D5), ductility (ASTM D113), and softening point (ASTM D36) tests [41,42,43].
2.2. Sample performance testing
The research was carried out on two mix designs: a conventional (traditional) mix and a modified mix with Fuller’s earth as a filler replacement. The filler weight was increased in 5 and 10% increments, rather than using the traditional sandstone filler. For all other components, the aggregate gradations and the 5% optimum binder content (OBC) were kept constant to isolate the effect of the modification. The detailed treatment methodologies and the percentages for each mix combination are summarized in Table 1. Subsequently, the prepared mixtures were assessed for flow and stability.
Table 1
Composition and treatment matrix of traditional and modified bituminous mixtures (per 1,000 g aggregate batch)
| Mix designation | Bitumen content (%) | Traditional sandstone filler (g) | Fuller’s earth modifier (g) | Total filler weight (g) | Replacement level (% by weight of filler) |
|---|---|---|---|---|---|
| Traditional mix (control) | 5.00% | 400 | 0 | 400 | 0% |
| 5% modified mix | 5.00% | 380 | 20 | 400 | 5% |
| 10% modified mix | 5.00% | 360 | 40 | 400 | 10% |
Source: Author’s contribution.
2.2.1. Marshall stability test (ASTM D6927)
The Marshall stability test is used to determine the optimal binder content and evaluate the structural integrity of each mix. The procedure involved aggregate sampling, heating and mixing with bitumen, compaction using a Marshall hammer, and stability testing after conditioning in a water bath [44].
3. Results and discussion
The experimental results were calculated in accordance with the study’s defined methodology and standards. First, the experimental results of the materials were computed. Once it was confirmed that the material was suitable for sample preparation, different samples were prepared, and the results were obtained.
3.1. Specific gravity of coarse aggregate (ASTM C-127)
The test was done on a sample of 2,000 g of coarse aggregate, and the details of the test are given in Table 2.
Table 2
Specific gravity of coarse aggregate
| S. No. | Parameter | Weight (g) |
|---|---|---|
| 1 | A1 | 1,875 |
| 2 | A2 | 634 |
| 3 | B | 1,975 |
| 4 | C | 1,964 |
| 5 | A | 1,241 |
Source: Author’s contribution.
A1 = Weight of suspended saturated aggregate in water.
A2 = Weight of suspended basket in water.
A = (A1–A2) = Weight of saturated aggregate submerged in water.
B = Weight of saturated surface dry aggregate in air.
C = Weight of oven-dried aggregate.
The equation used for the calculation of specific gravity is.
.
The typical range for aggregates used in construction is 2.5–3.0, with an average value around 2.68. The specific gravity value of 2.68 falls within this range, suggesting that our coarse aggregate samples have a suitable density for construction purposes.
3.2. Gradation of coarse aggregate (ASTM D-692)
A coarse aggregate gradation test determines the distribution of coarse aggregate particle sizes. The test involves passing the material through a series of standard sieves, each with smaller openings. The amount of material retained on each sieve is measured. The test results are shown in Table 3.
Table 3
Coarse aggregate gradation
| Sieve # | Size (mm) | Retained weight (g) | % retained | Cumulative % retained | % passing |
|---|---|---|---|---|---|
| 1.5 | 1.5 | 0 | 0 | 0 | 100 |
| 1 | 1 | 0 | 0 | 0 | 100 |
| ¾ | 0.75 | 78 | 3 | 3 | 97 |
| ½ | 0.5 | 1237 | 53 | 56 | 44 |
| 3/8 | 0.375 | 815 | 35 | 91 | 9 |
| #4 | 0.1875 | 185 | 8 | 99 | 1 |
Source: Author’s contribution.
The coarse aggregate’s fineness modulus (FM) value was calculated to be 2.51. For well-graded aggregates, the FM is typically 2.3–3.2; therefore, the coarse aggregate is well-graded and meets construction grading standards. The resultant curve is shown in Figure 1.
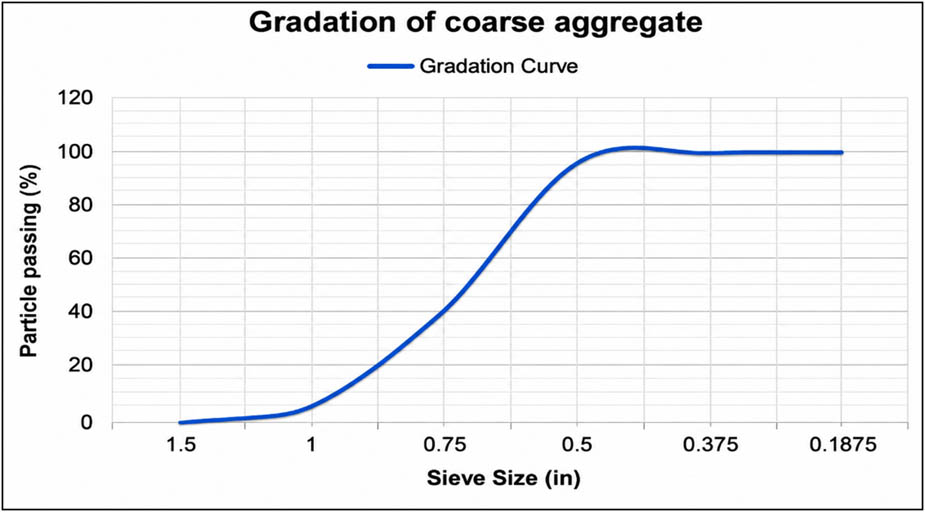
Figure 1
Gradation curve of coarse aggregate.
Source: Author’s contribution.
3.3. Gradation of fine aggregate (ASTM C-33)
This test method covers the procedure for determining the particle size distribution of fine aggregate. In this case, the particles are placed on standard sieves with progressively smaller holes, and the quantity retained on each sieve is measured. This is used to calculate the gradation value, which is important for assessing the suitability of aggregate material for construction. The results of this analysis are shown in Table 4.
Table 4
Fine aggregate gradation
| Sieve # | Size (mm) | Retained weight (g) | % retained | Cumulative % retained | % passing |
|---|---|---|---|---|---|
| 5 | 5 | 795 | 1 | 1 | 99 |
| 8 | 144 | 651 | 18 | 9 | 81 |
| 16 | 269 | 382 | 34 | 52 | 48 |
| 30 | 1 | 381 | 0 | 52 | 48 |
| 50 | 213 | 168 | 27 | 79 | 21 |
| 100 | 81 | 87 | 10 | 89 | 11 |
Source: Author’s contribution.
The FM value of fine aggregate was determined to be 2.92, which falls within the specified limits of 2.3–3.1. This indicates that the fine aggregate is well-graded and meets the grading requirements for construction; the grading curve is shown in Figure 2.
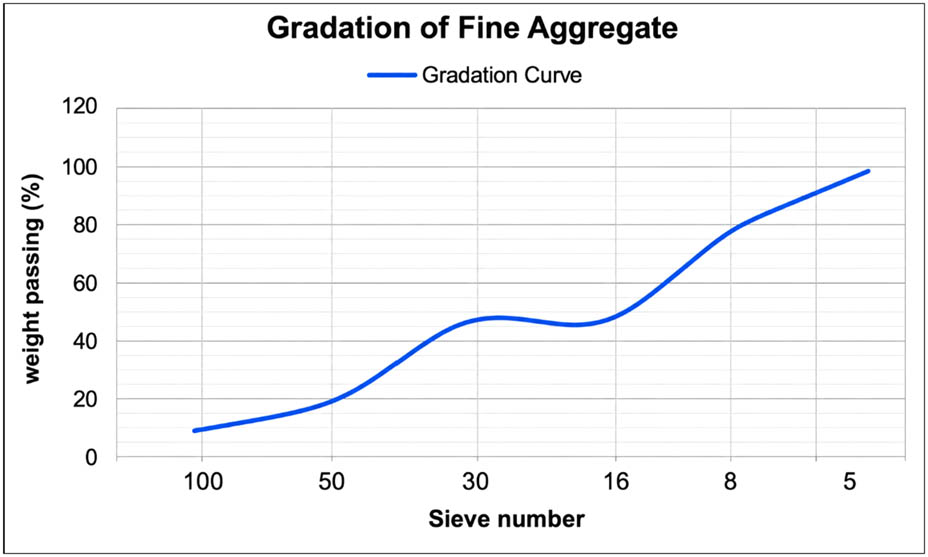
Figure 2
Fine aggregate gradation curve.
Source: Author’s contribution.
3.4. Penetration test of bitumen (ASTM D-5)
The test is conducted to determine the softening point and consistency of the bitumen. The penetration needle apparatus was used for evaluation. For the test, a specimen was placed just below the instrument’s needle. The needle was then placed and allowed to drop into the specimen for 5 s. This same process was repeated at three other locations on the same specimen. The penetration value was calculated as the average of all three readings in mm. The results are given in Table 5 and Figure 3.
Table 5
Penetration test of bitumen
| S. No. | Sample | Needle reading | Value (0.1 mm) | Penetration value (0.1 mm) |
|---|---|---|---|---|
| 1 | 1 | Initial reading | 37 | 8 |
| Final reading | 45 | |||
| 2 | 2 | Initial reading | 38 | 6 |
| Final reading | 44 | |||
| 3 | 3 | Initial reading | 38 | 6 |
| Final reading | 44 | |||
| Mean reading | 6.7 |
Source: Author’s contribution.
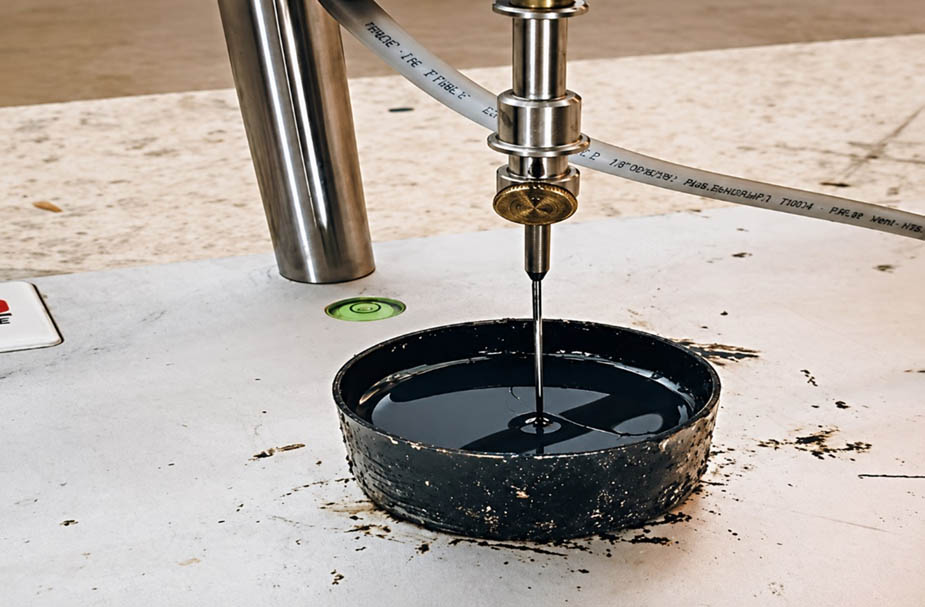
Figure 3
Penetration test of bitumen.
Source: Author’s contribution.
The result showed that the bitumen meets the requirements for a standard 60/70-grade binder, with a mean penetration value of 67 d-mm. This indicates that the binder is highly suitable for pavement construction in regions experiencing moderate temperature profiles.
3.5. Ductility test for bitumen (ASTM D-113)
The ductility test for bitumen assesses the material’s ability to elongate under specific conditions. It measures how far a bitumen sample can be stretched before breaking. This ductility value was obtained by preparing three samples. Each sample was then placed in the ductility apparatus, which was set to the required standard pulling speed and temperature. After some time, the sample broke, and the reading for each sample was recorded (Table 6). The average of these readings is called the bitumen ductility value.
Table 6
Ductility test of bitumen
| S. No. | Sample | Ductility value (cm) |
|---|---|---|
| 1 | 1 | 83 |
| 2 | 2 | 87 |
| 3 | 3 | 93 |
| Average | 87.67 |
Source: Author’s contribution.
The results of the ductility test indicate consistent performance within the range of 83–93 cm. The calculated average ductility is 87.67 cm.
3.6. Softening point for bitumen (ASTM D-36)
It refers to the temperature at which bitumen softens sufficiently for a standard steel ball to sink to a specified depth in a beaker under specific conditions. This test is crucial for determining the temperature susceptibility and stability of bitumen. Two rings of the same size as specified by the standards of ASTM D-36 are filled with bitumen, then subjected to the ring and ball apparatus. The temperature at which the balls touch the bottom of the beaker is recorded (Table 7).
Table 7
Softening point of bitumen samples
| S. No | Sample | Softening point value (°C) |
|---|---|---|
| 1 | 1 | 41.3 |
| 2 | 2 | 42.1 |
| Average | 41.75 |
Source: Author’s contribution.
The average softening point of 41.75°C indicates that the sample is suitable for road construction and meets the requirement for regions with a maximum temperature of 40°C. This ensured structural integrity and longevity under thermal stress, a crucial factor for road surface performance.
3.7. Marshall stability test (ASTM D-6927)
After all quality tests have been conducted on the aggregates used in the mix, a Marshall stability test is performed to ensure that all standard requirements are met. Marshal stability test results were categorized based on modification. Figure 4 shows the design mix heating and the marshal compactor.
Traditional Marshal mix results
Modified Marshall mix results
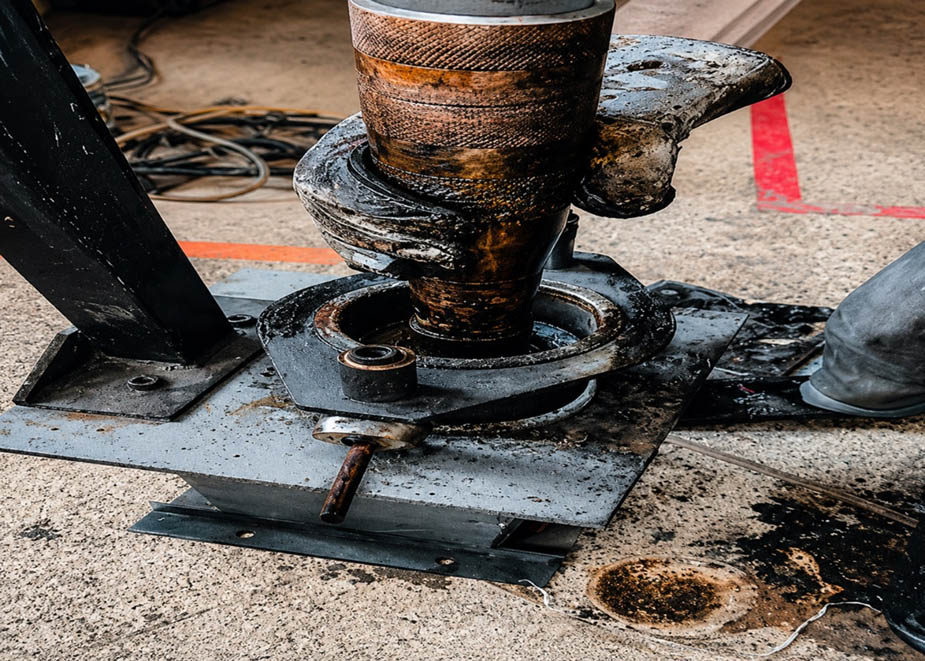
Figure 4
Marshal compactor.
Source: Author’s contribution.
3.7.1. Traditional Marshal mix results
In this method, the resistance to plastic deformation of cylindrical bituminous cakes is measured at a loading rate of 5 cm/min. The stability of the mix is defined as the maximum load the compressed specimen can withstand at 60℃. The flow value indicates the deformation of the Marshall test specimen during loading to the maximum load, expressed in 0.25 mm units.
This mix was prepared with a weight of 1,000 g aggregate (Grade 1 type), the variation of which is given in Table 8.
Table 8
Aggregate proportion for Marshall mix
| S. No. | Aggregate (mm) | Weight (g) |
|---|---|---|
| 1 | 10 | 200 |
| 2 | 4.75 | 300 |
| 3 | 2.6 | 100 |
| 4 | Filler | 400 |
Source: Author’s contribution.
To the following aggregates, different percentages of bitumen were added, expressed as a percentage by weight of the mix. The mix was prepared such that the aggregate was heated to 175–195°C, and the bitumen to 121–138°C. After thoroughly mixing the aggregate and bitumen, the mix is poured into a preheated mould, which is then compressed by giving it 75 blows on each face of the mould using a Marshall compactor. Three specimens were prepared using the same method at different percentages: 3%, 4%, 5%, and 6%. The samples were then extruded and kept at room temperature for 24 h. Soon after the cakes had cooled, they were submerged in a water bath at 60°C ± 1°C for 30 min.
The specimens were removed and placed in the Marshall test machine, and the Marshall stability and flow values were noted. If the sample’s average height is not 63.5 mm, the Marshall values are multiplied by a correction factor. All the samples in this test had a height of approximately 58.7 mm; therefore, the final stability value was multiplied by 1.14, as per the correction factor table. The details of the test carried out are shown in Table 9 and Figure 5.
Table 9
Traditional sample results
| Bitumen content (% by weight of mix) | Height of the cake (cm) | Diameter of the cake (cm) | Average flow value (mm) | Average stability value (kN) | Stability value after the correction factor of 1.14 (kN) |
|---|---|---|---|---|---|
| 3% | 5.8 | 10 | 2.3 | 3.4 | 3.88 |
| 4% | 5.8 | 10 | 3.23 | 4.05 | 4.62 |
| 5% | 5.8 | 10 | 2.73 | 4.98 | 5.68 |
| 6% | 5.8 | 10 | 3.7 | 4.25 | 4.85 |
Source: Author’s contribution.
3.7.2. Selection of standard traditional sample
The results concluded that the OBC was determined by the sample’s minimum flow value and its higher stability value. The sample with the OBC was chosen as the standard traditional sample to which the modified mix results were compared.
The computed test results show that a 3% bitumen content sample yielded the minimum flow value, followed by a 5% bitumen content sample; however, the maximum stability was achieved by a 5% bitumen content sample, as detailed in Figure 5a–c.
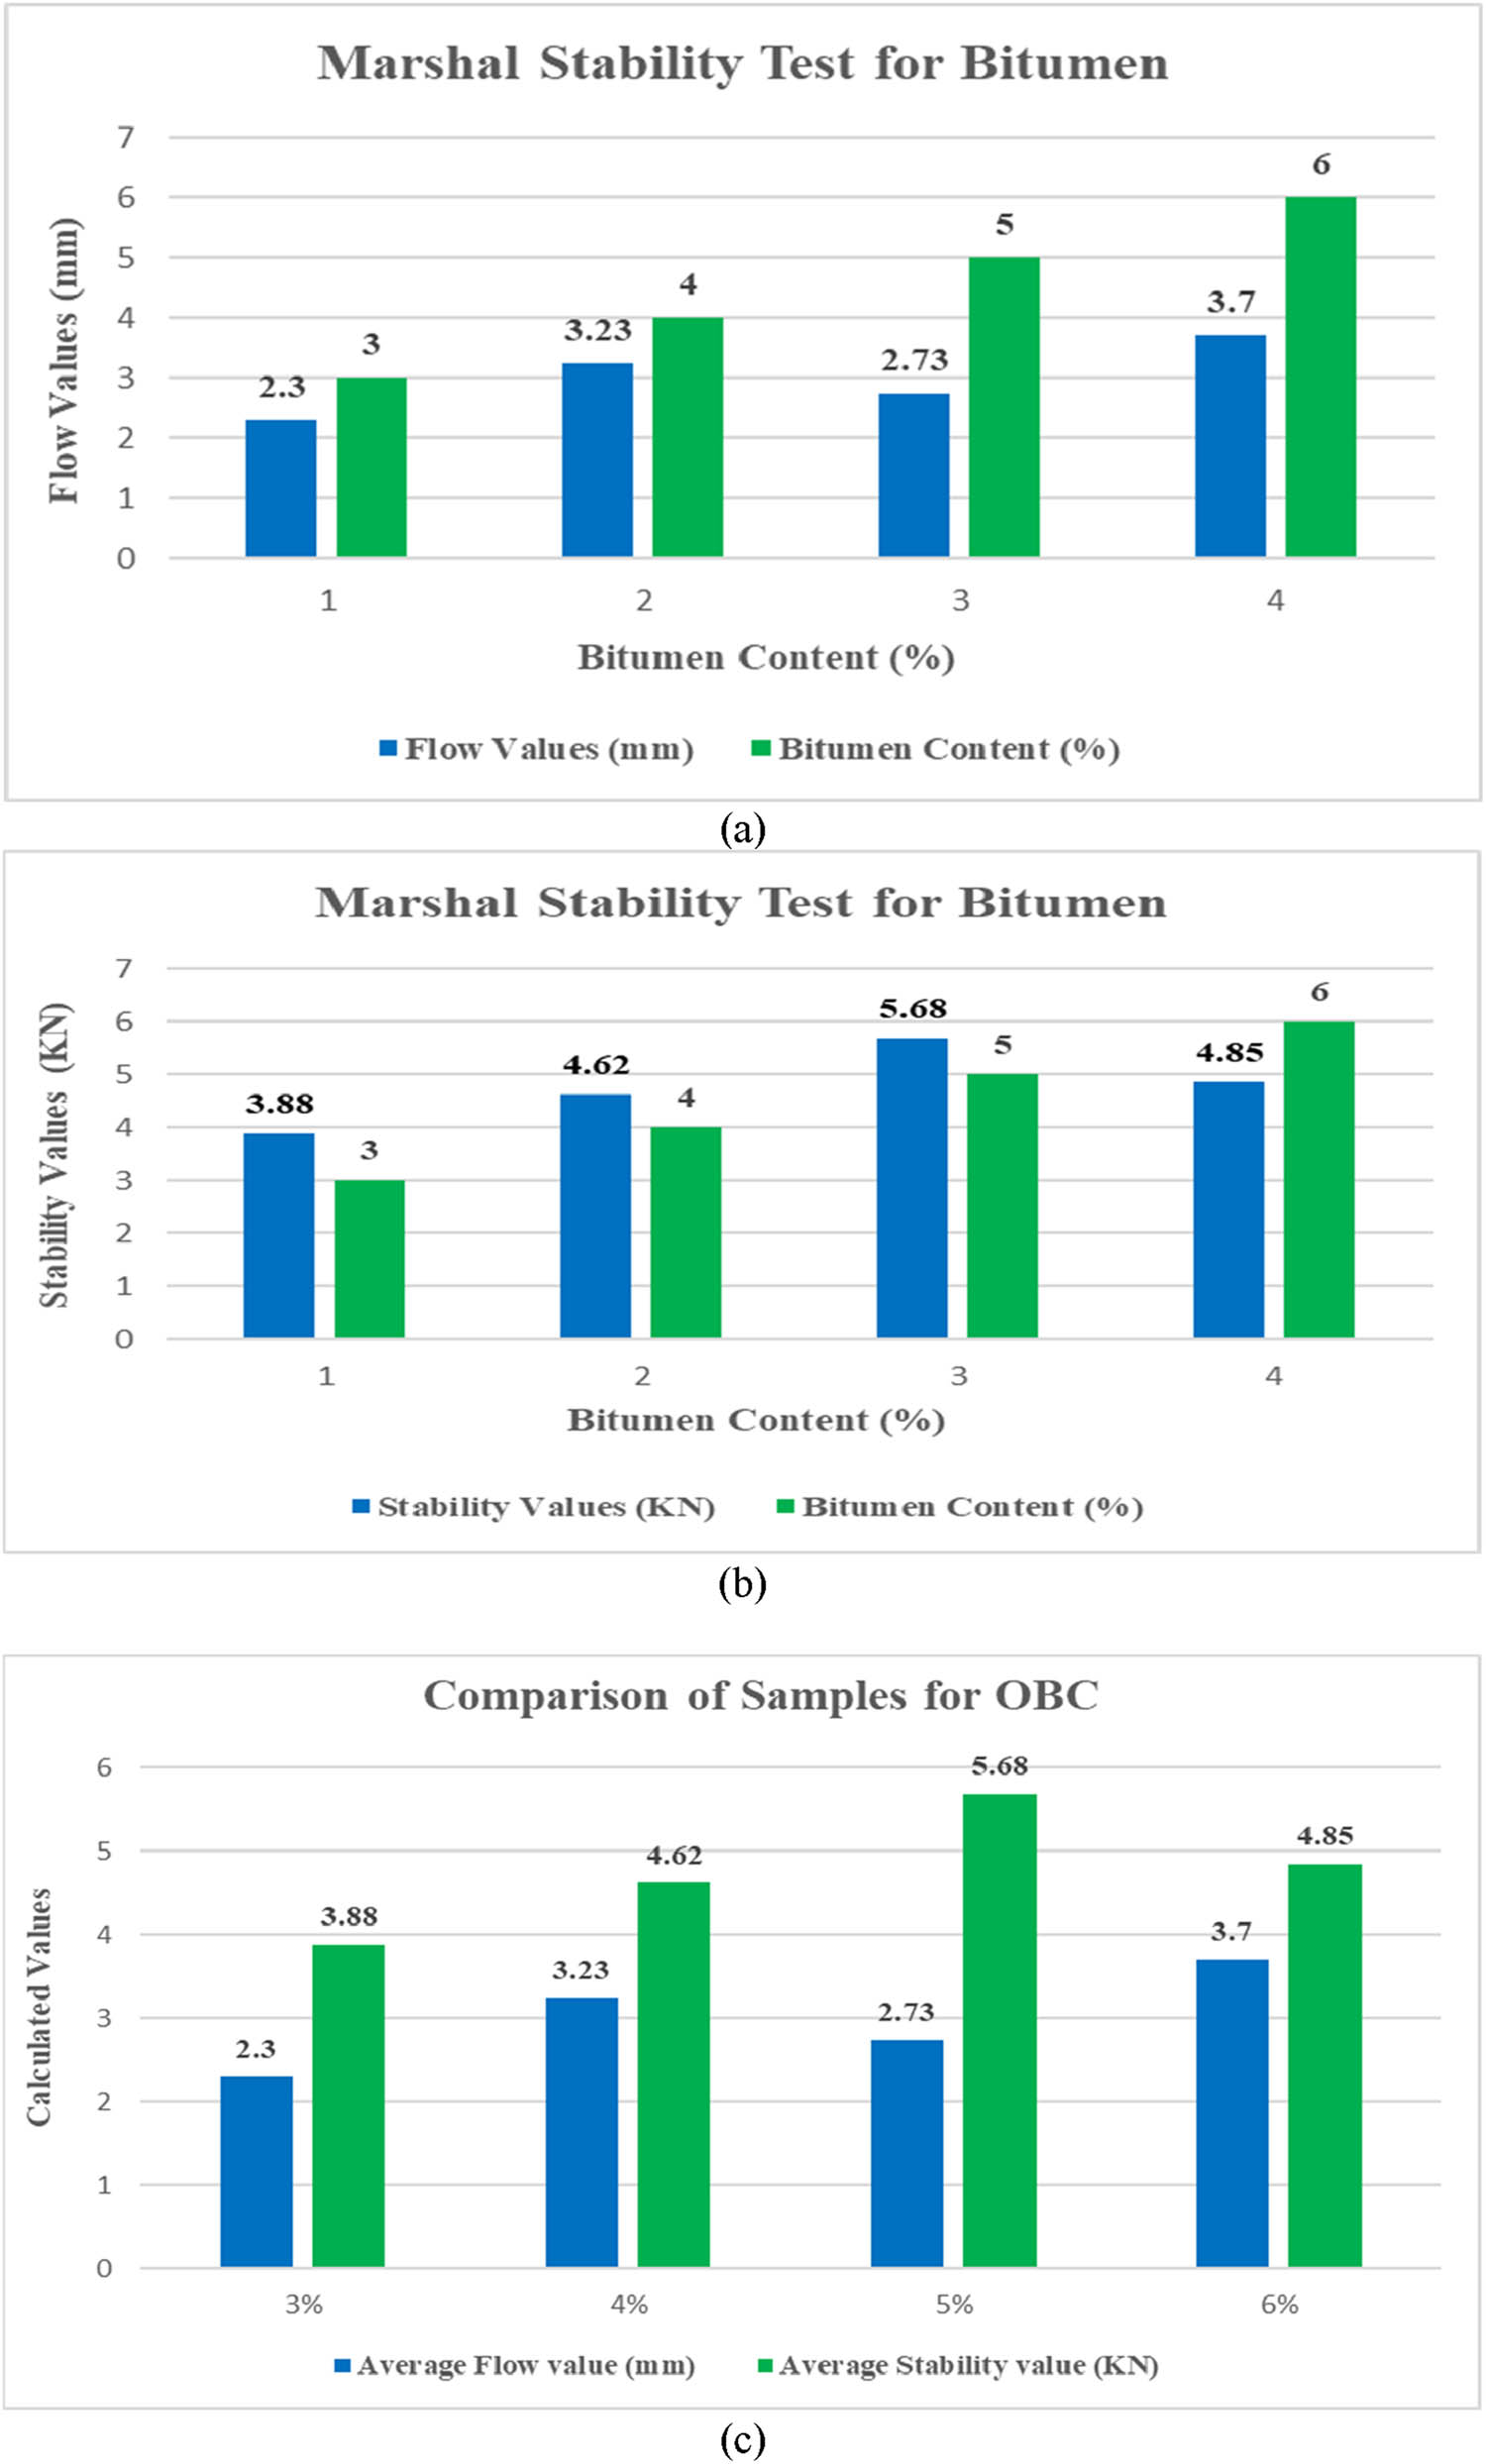
Figure 5
(a) Traditional sample flow value, (b) traditional sample stability value, and (c) result comparison for the traditional sample.
Source: Author’s contribution.
The tables and figures show that the OBC and the best results were achieved at 5% bitumen. Therefore, this 5% bitumen sample was taken as the standard traditional sample for this study. The bituminous mix was modified by increasing the bitumen content to 5%, and the results of the modified sample were compared with those of the selected standard sample.
3.7.3. Modified Marshal mix results
The modified samples were prepared and tested once the traditional mix results were obtained and OBC was determined. The coarse aggregate, fine aggregate, and bitumen were kept constant, while the filler used in the standard mix was replaced with Fuller’s earth. The replacement was performed in increments of 5% by weight of the traditional filler.
Moreover, the replacement was performed until the specimen began to show a saturating or decreasing trend. This project replaced the standard traditional mix by 5 and 10% using Fuller’s earth. The results obtained are given in Table 10 and Figure 6.
3.7.3.1. 5% Modified sample results
The sample was prepared using the same procedure, except that the sample proportioning step was adjusted to achieve an overall sample weight of 1,000 g. 380 g of sandstone filler and 20 g of Fuller were added, while the number of other aggregates and bitumen was kept the same as in Table 9 of the traditional mix result.
To eliminate any outliers from the results, three samples with the same aggregate proportion were prepared and tested. The results are shown and plotted in Figure 6a and b for better understanding.
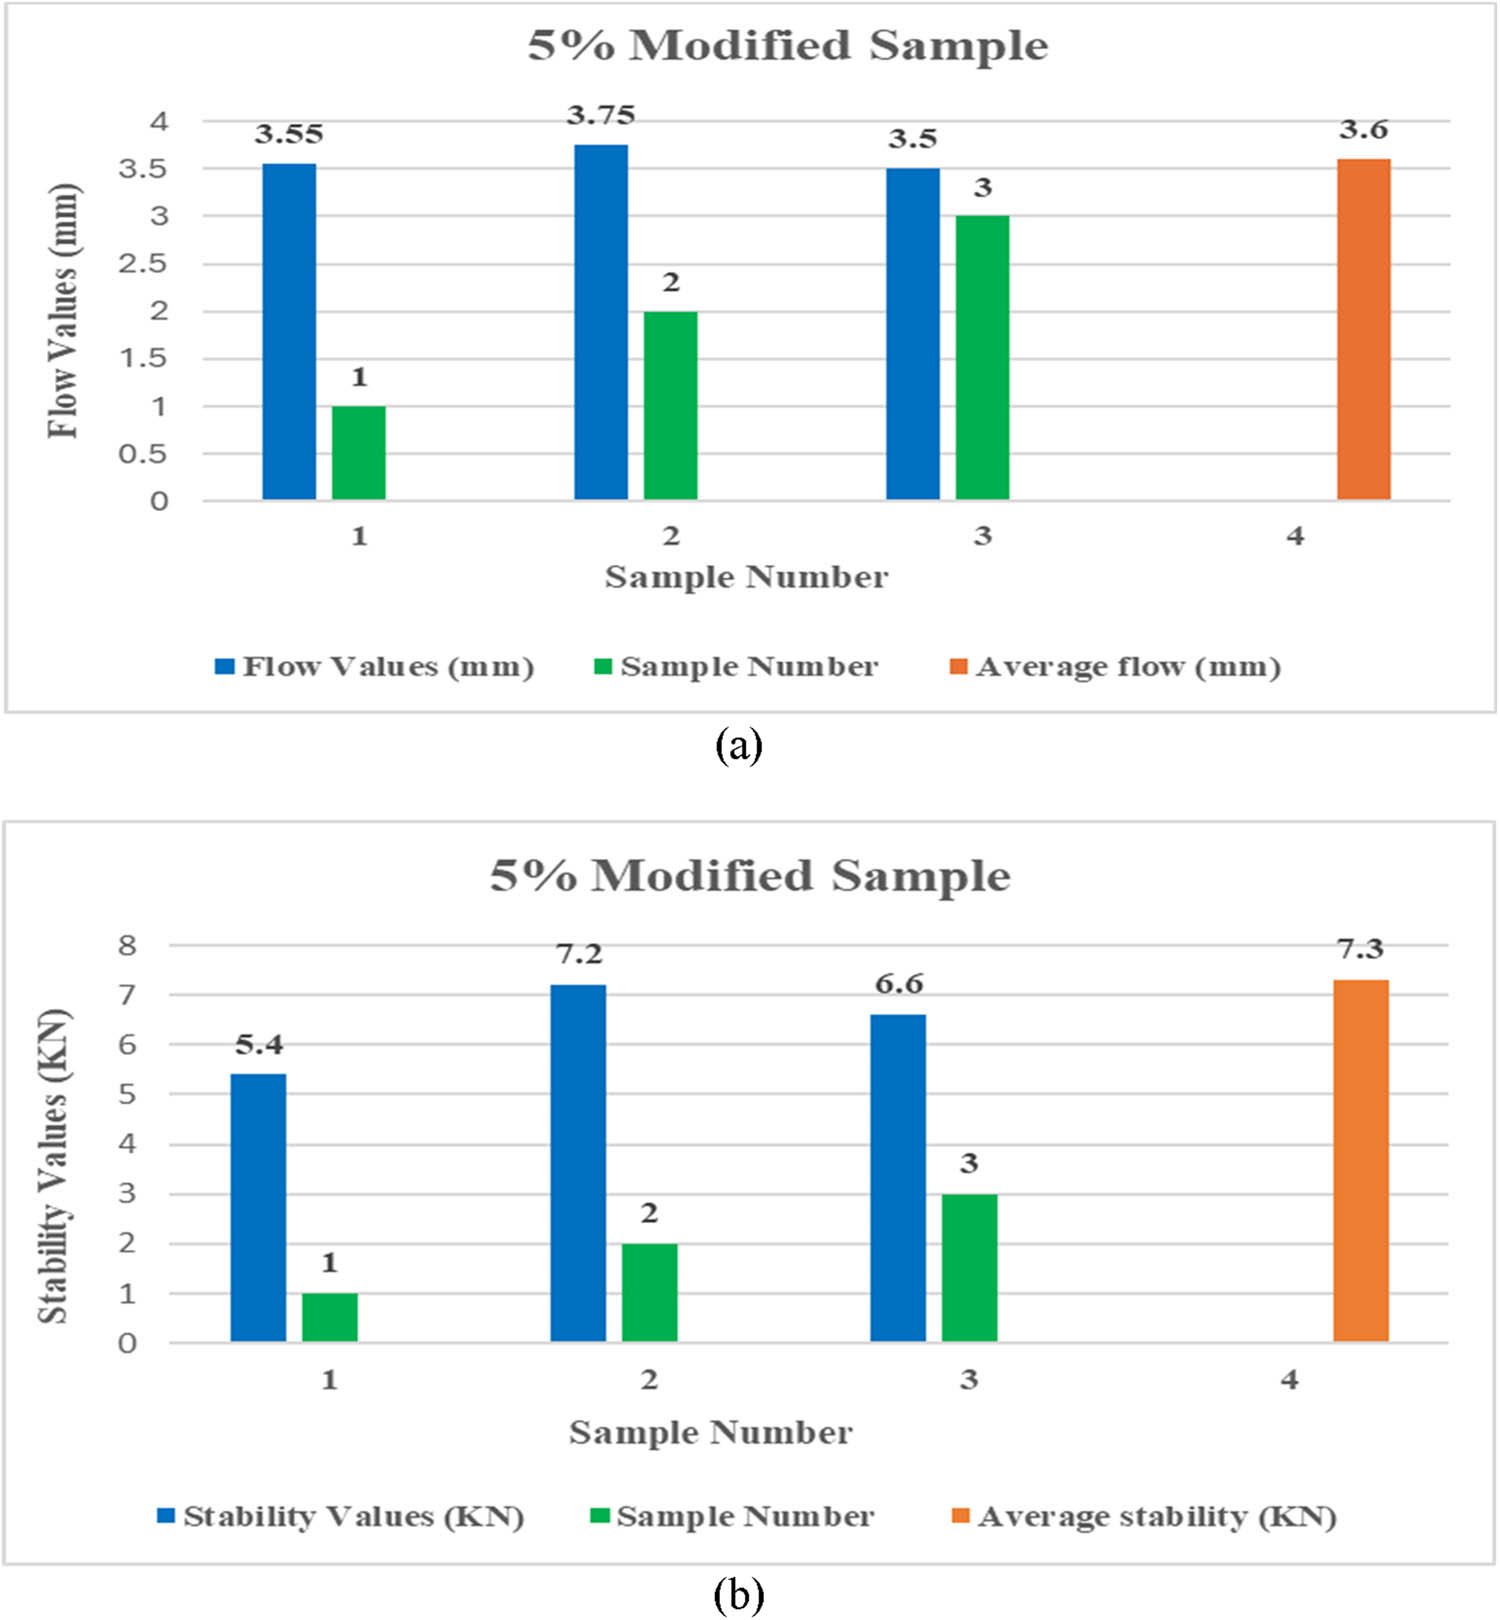
Figure 6
(a) Flow value of 5% modified sample and (b) stability value of 5% modified sample.
Source: Author’s contribution.
The stability and flow values recorded during the tests were plotted for the same three samples. The charts showed that if one sample had been prepared, it would have deviated from the investigation.
The calculated average flow was 3.60 mm, and the average stability was 6.40 kN for the 5% modified bituminous mix. After multiplying the stability value by a correction factor of 1.14 (sample height = 58.7 mm approximately), the final stability was 7.30 kN.
3.7.3.2. 10% modified sample results
The sample was prepared using the same procedure, except that the sample proportioning step was adjusted to achieve an overall sample weight of 1,000 g. 360 g of sandstone filler and 40 g of Fuller were added, while the number of other aggregates and bitumen were kept the same as in Table 9 of the traditional mix result.
To eliminate outliers from the results, three samples containing the same amount of aggregates were prepared and tested. The results are presented and plotted in Figure 7a and b for better understanding.
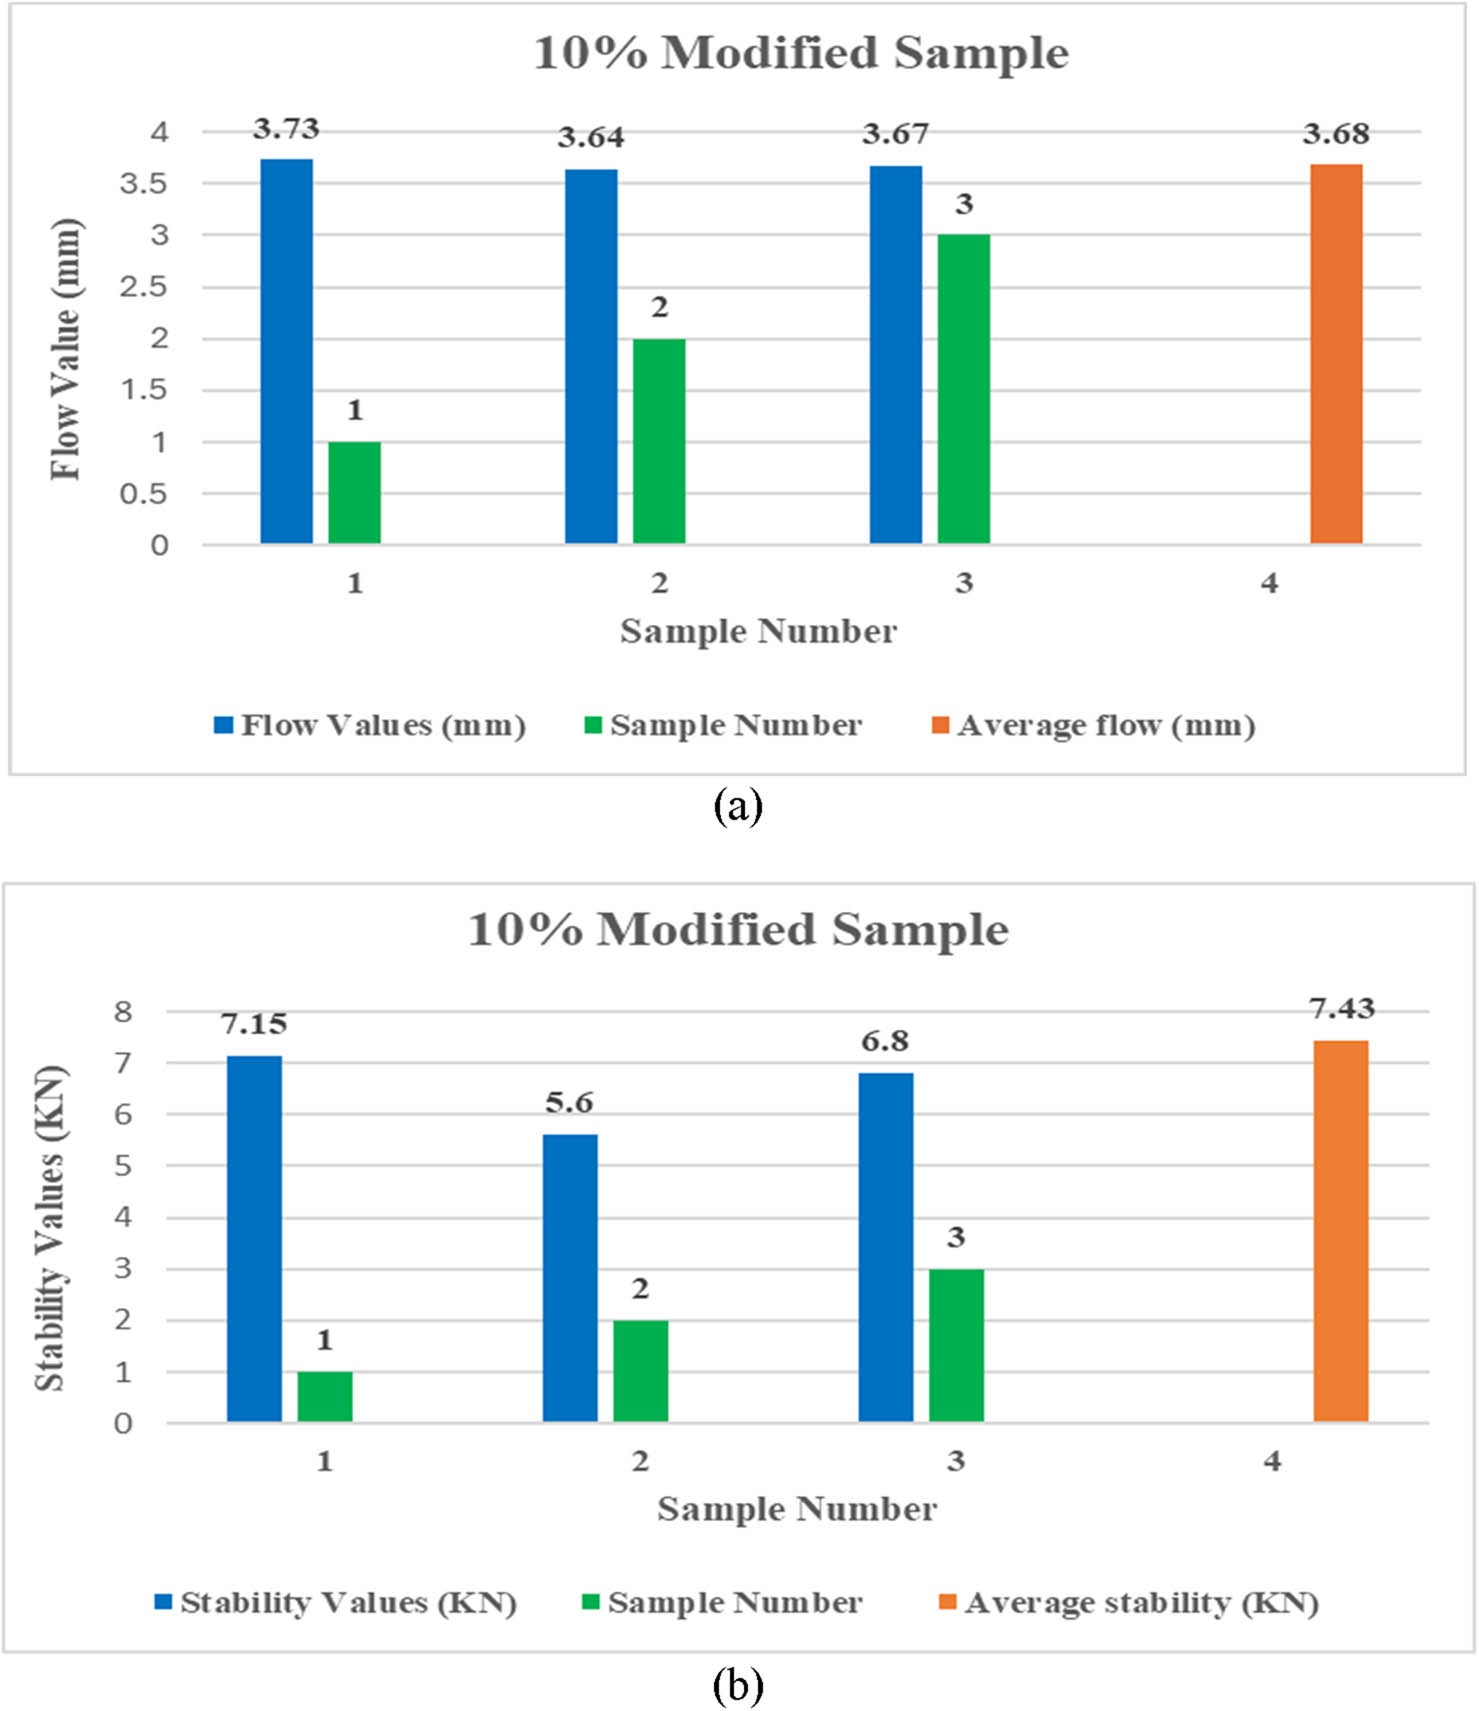
Figure 7
(a) Flow value of 10% modified sample and (b) stability value of 10% modified sample.
Source: Author’s contribution.
The calculated average flow was 3.68 mm, and the average stability was 6.52 kN for the 10% modified bituminous mix. After multiplying the stability value by a correction factor of 1.14 (sample height = 58.7 mm approximately), the final stability was 7.43 kN.
3.7.4. Traditional vs modified results
The evaluation tends to demonstrate the extent to which the modification of Fuller earth in the bituminous mix has contributed to its stability and flow properties. The investigation indicates that the modification significantly increases the stability value of the bituminous mix design. The calculated optimum values are presented in Table 10. The flow and stability results are shown in Figure 8.
Table 10
Flow and stability values of traditional and modified samples
| Sample | Average flow (mm) | Average stability (kN) |
|---|---|---|
| Traditional | 2.73 | 5.68 |
| 5% modified | 3.6 | 7.30 |
| 10% modified | 3.68 | 7.43 |
Source: Author’s contribution.
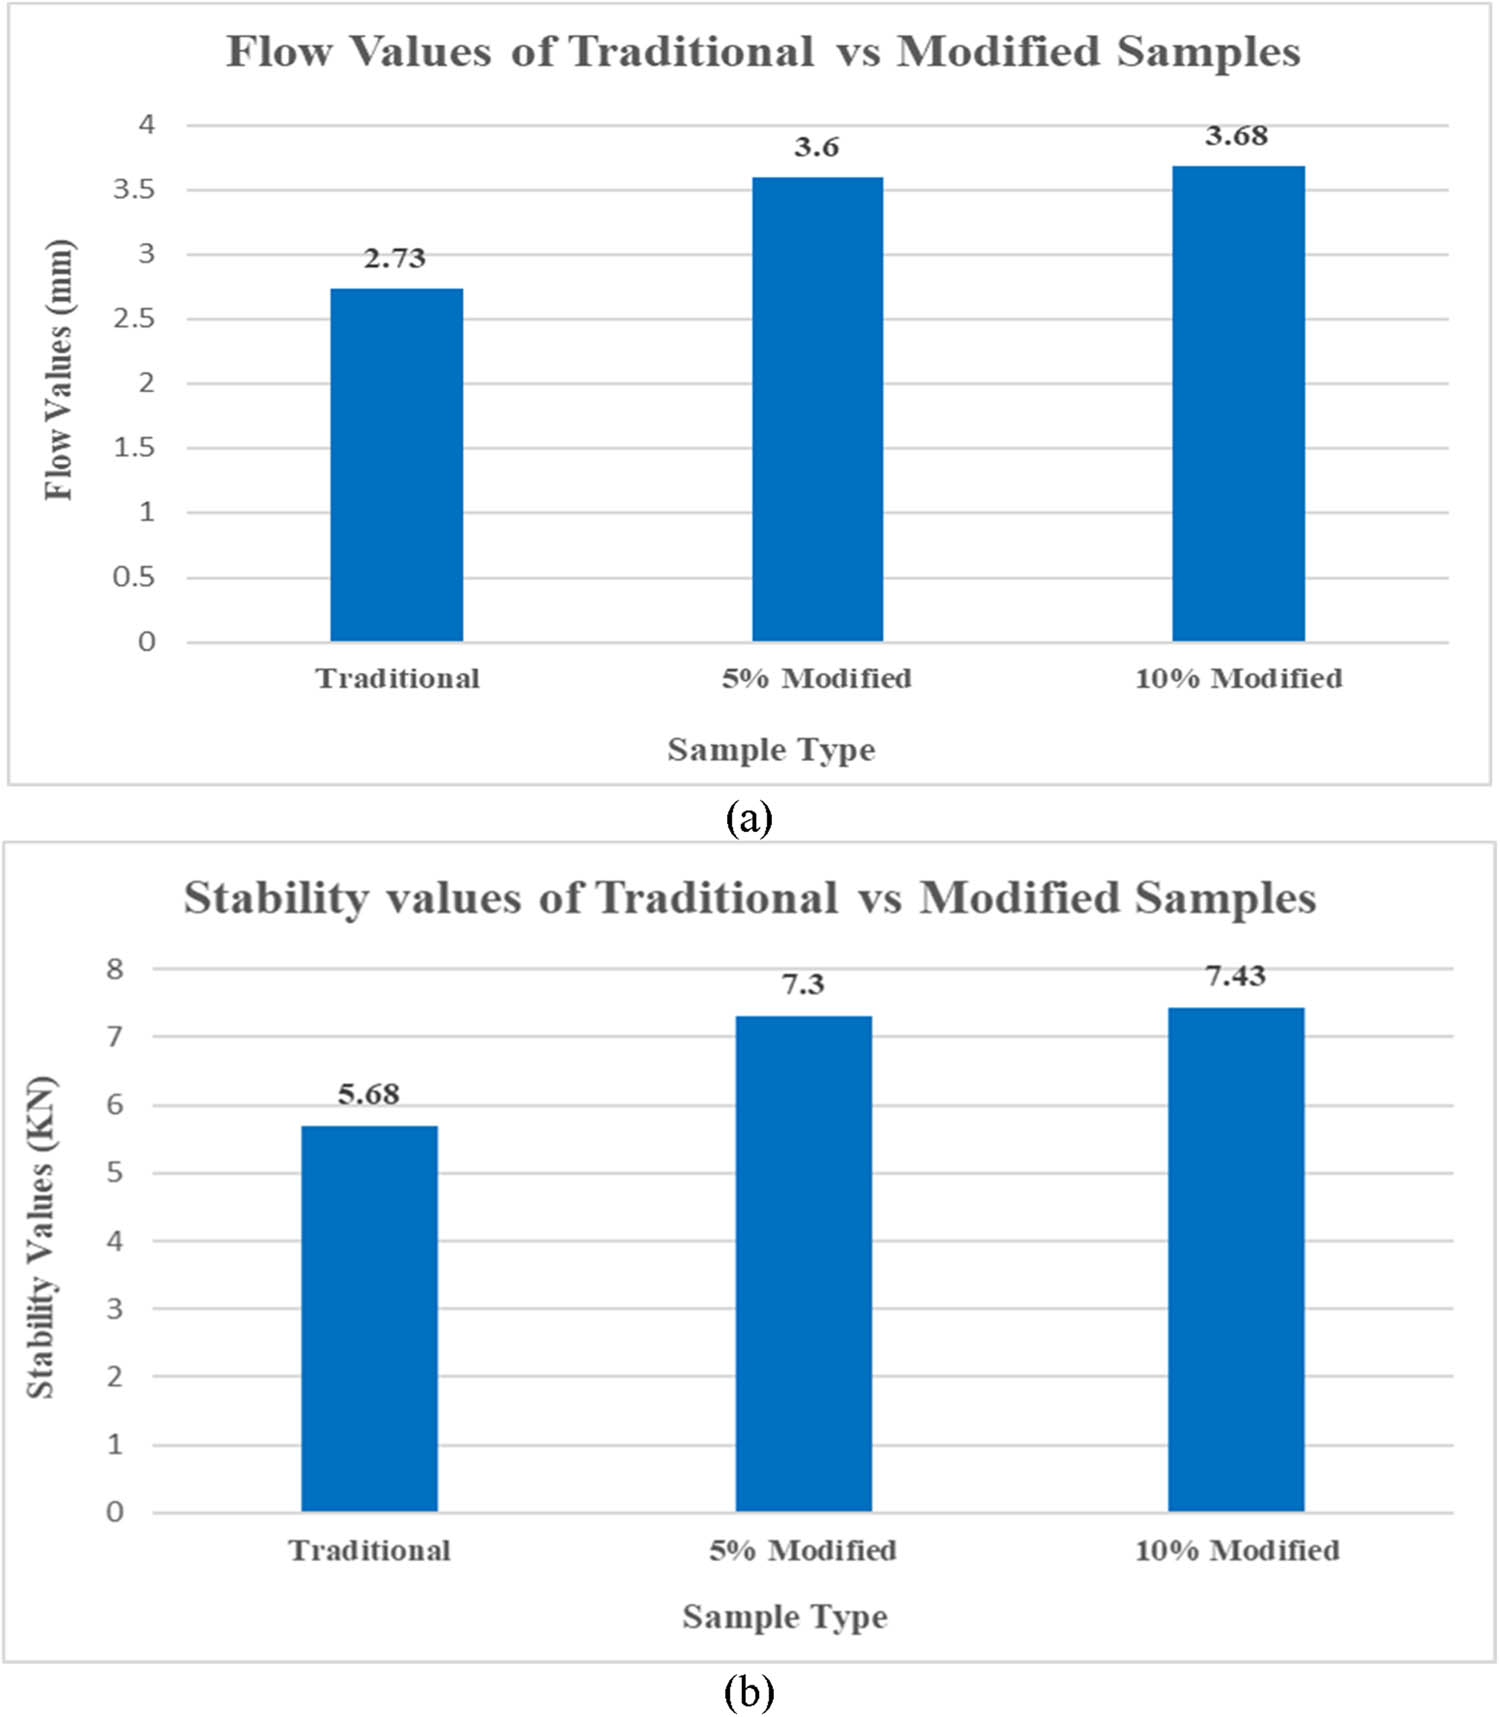
Figure 8
(a) Flow values for traditional vs modified mix and (b) stability values for traditional vs modified mix.
Source: Author’s contribution.
The results showed an increasing trend for the bituminous mix as moving from the traditional mix to the 5% modified mix (Table 11). There is a minor increase in the flow value, which can be ignored since it remains within the ASTM D-6927 limits. However, as moving from 5% to 10%, the stability value increases very slightly (Table 12).
Table 11
Percentage increase in 5% modified sample
| Parameter | Traditional sample | 5% modified sample | Percentage increase |
|---|---|---|---|
| Stability value (kN) | 5.68 | 7.30 | 28.42 |
| Flow value (mm) | 2.73 | 3.6 | 31.87 |
Source: Author’s contribution.
Table 12
Percentage increase in the 10% modified sample
| Parameter | Traditional sample | 10% modified sample | Percentage increase |
|---|---|---|---|
| Stability value (kN) | 5.68 | 7.43 | 30.81 |
| Flow value (mm) | 2.73 | 3.68 | 34.80 |
Source: Author’s contribution.
Table 11 shows that a 5% modification to the mix significantly increased the pavement mix strength by 28.42%.
Also, the 10% modified sample showed a 30% increase in strength compared to the traditional sample. The comparison is shown in Table 13.
Table 13
Comparison of 5% and 10% modified sample
| Parameter | 5% modified sample | 10% modified sample | Percentage increase |
|---|---|---|---|
| Stability value (kN) | 7.30 | 7.43 | 1.78 |
| Flow value (mm) | 3.6 | 3.68 | 2.22 |
Source: Author’s contribution.
After the comparison and evaluation, it was observed that the stability strength increased by 28.42% as moving from a traditional to a 5% bituminous mix modification, indicating that the change significantly improved the filler material’s mix design strength. However, as the modification was increased from 5% to 10%, a very slight increase in strength was observed, indicating that the bituminous mix’s effective performance was achieved at 5% modification.
3.7.5. Discussion of results in context of previous studies
The observed improvements in Marshall stability (28.42% for 5 and 30.81% for 10% Fuller’s earth replacement) are consistent with and contribute to the existing body of research on alternative fillers in bituminous mixtures.
3.7.5.1. Comparison with alternative fillers
Our results align with Choudhary et al.’s [25] review, which found that 9 out of 19 waste fillers exhibited higher Marshall stability than conventional mixes. The 28–31% increase in stability is comparable to polymer-modified bitumen studies reporting 25–40% improvements [18]. Studies on sugarcane bagasse ash achieved stability increases from 7.6–9.0 kN at 8% replacement [27,28], while rice husk ash demonstrated 29% improvement in rutting resistance and 48.61% enhancement in fatigue life [1,26]. Similarly, red mud, used as a partial filler replacement, has shown improved stability and resistance to moisture damage [16], supporting the viability of alternative fillers.
3.7.5.2. Relevance to developing countries and hot climates
These findings are particularly relevant to developing countries such as Pakistan where pavement deterioration is aggravated by temperatures exceeding 40°C and heavy traffic loads [1,2,3,36]. The improved stability shows a greater resistance to permanent deformation, which is an important issue in such environments. Our study validates the findings of Ranadive and Tapase [15], who showed that the type of filler used is a major parameter influencing pavement performance in warm climatic regions, and reveals that Fuller’s earth is a locally available and cost-effective option. Similarly, utilization of waste derived polymers in Pakistan has shown strength improvements in local conditions [8] and fly ash with sisal fibre has shown improvement in bituminous concrete [19].
3.7.5.3. Mechanisms and optimal replacement
The observed improvement is likely due to the irregular particle structure of Fuller’s earth, which increases mechanical interlock as has been shown for alternative fillers in SEM analysis from previous studies [21]. Its high porosity and adsorptive properties [37] may enhance load transfer and the interaction between binder and filler. The marginal improvement between 5% and 10% replacement (1.78%) indicates a diminishing return, as seen in sewage sludge ash studies where the best performance was at 3–4% concentration [29,30,31], and Phosphogypsum whiskers, which show best performance at specific thresholds [34].
3.7.5.4. Comparison with standards
The resulting stability values (7.30 kN for 5%, 7.43 kN for 10%) are higher than the minimum values generally required for bituminous concrete surface courses. The flow values are within the permissible limits of ASTM D-6927 [31,44]. This indicates that the modification enhances strength without affecting flexibility.
4. Conclusion
The results of this study showed that the use of Fuller’s earth instead of the conventional sandstone filler increases significantly the mechanical properties of bituminous mixtures. The Marshall stability increased from 5.68 kN for the traditional mixture to 7.30 kN for the 5% modified mixture, which is 28.42% higher and 7.43 kN for the 10% modified mixture, which is 30.81% higher. The flow values for all the mixes were within the acceptable ASTM D-6927 limits of 2.73, 3.60, and 3.68 mm for the traditional, 5% modified, and 10% modified mixes, respectively, which indicates that strength enhancement was achieved without compromising flexibility. However, the marginal improvement in stability between the 5 and 10% modification levels was only 1.78%, indicating diminishing returns beyond the 5% replacement level. This is the best replacement percentage of Fullers earth in terms of economy and strength improvement. The study indicates that Fullers earth is an appropriate and economical filler modifier for improving durability of pavements in developing countries with similar climatic and traffic characteristics.
5. Recommendations
Other tests, such as the indirect tensile strength test and the rut test, should also be carried out on the mix to evaluate its behaviour in detail.
Research should be conducted to make the mix economical by using other cheaper materials in conjunction with Fuller’s earth.
The future work should focus on the long-term field performance and environmental impact of using Fuller’s earth in road construction.
Funding information
This research was partially supported by a project of the Institute of Desert Roads, Tarim Institute of Technology, Alaer, China.
Author contributions
Hamza Shams: Conceptualization, methodology, validation, formal analysis, investigation, data curation, writing – original draft preparation, and writing – review and editing; Yanjun QIU: Supervision, review and editing, project administration, and funding acquisition; Muhammad Kashif: Writing and editing; Zahoor Ahmad: Writing and editing; Hamid Abdrhman: Writing and editing; Chengxiang Wang: Writing and editing; Muhammad Yousaf Writing and editing; Costel PLESCAN: Writing and editing and funding; Elena Loredana PLESCAN: Writing and editing and funding; Dana Madalina PLATICA: Writing and editing and funding; Hanif Ullah: Editing; Muhammad Faiq: Editing; Mehtab Ahmad: Editing.
Conflict of interest statement
The authors declare no conflicts of interest.
Data availability statement
The data used in this research have been appropriately cited and reported in the main text.