
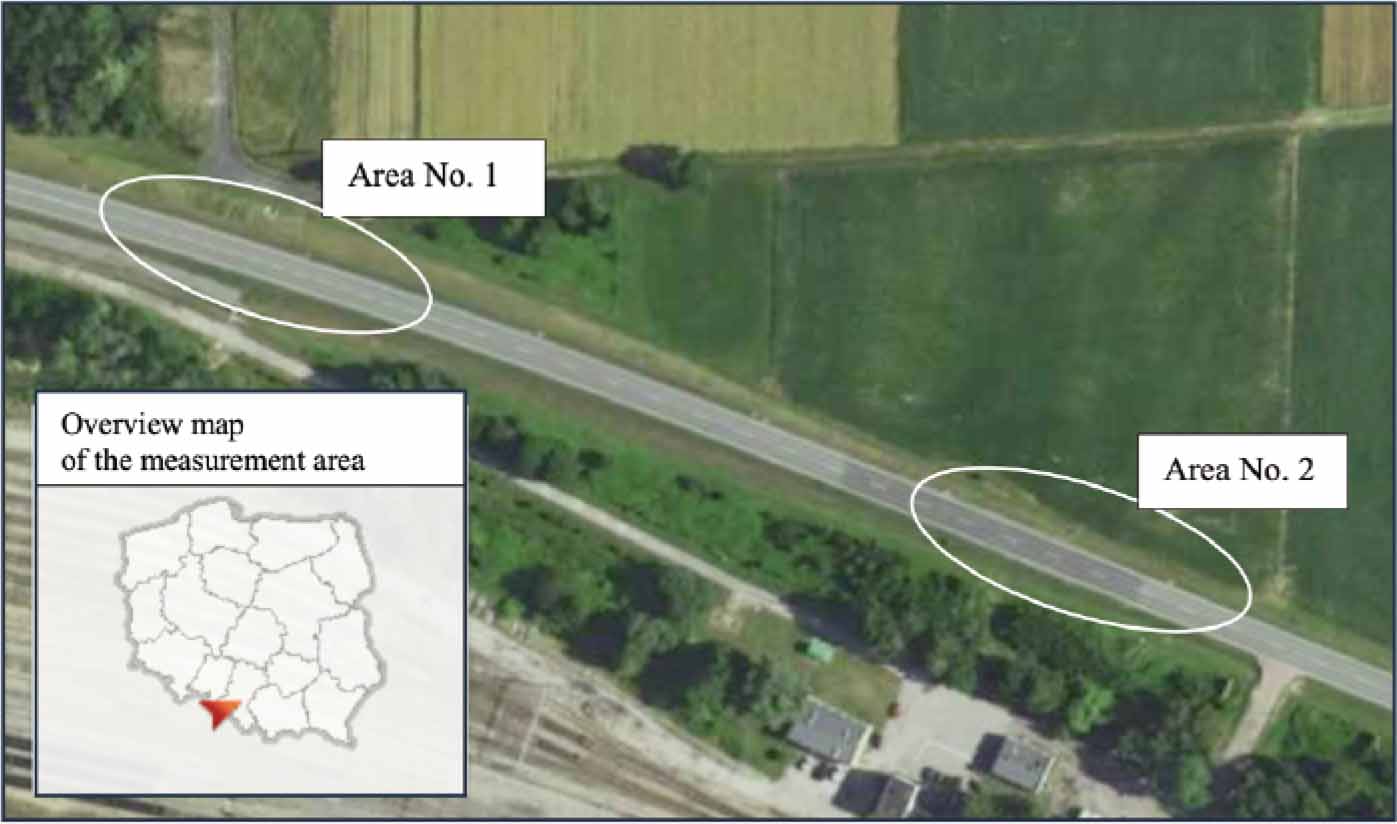
Figure 1.
Location of road areas subject to UAV measurement
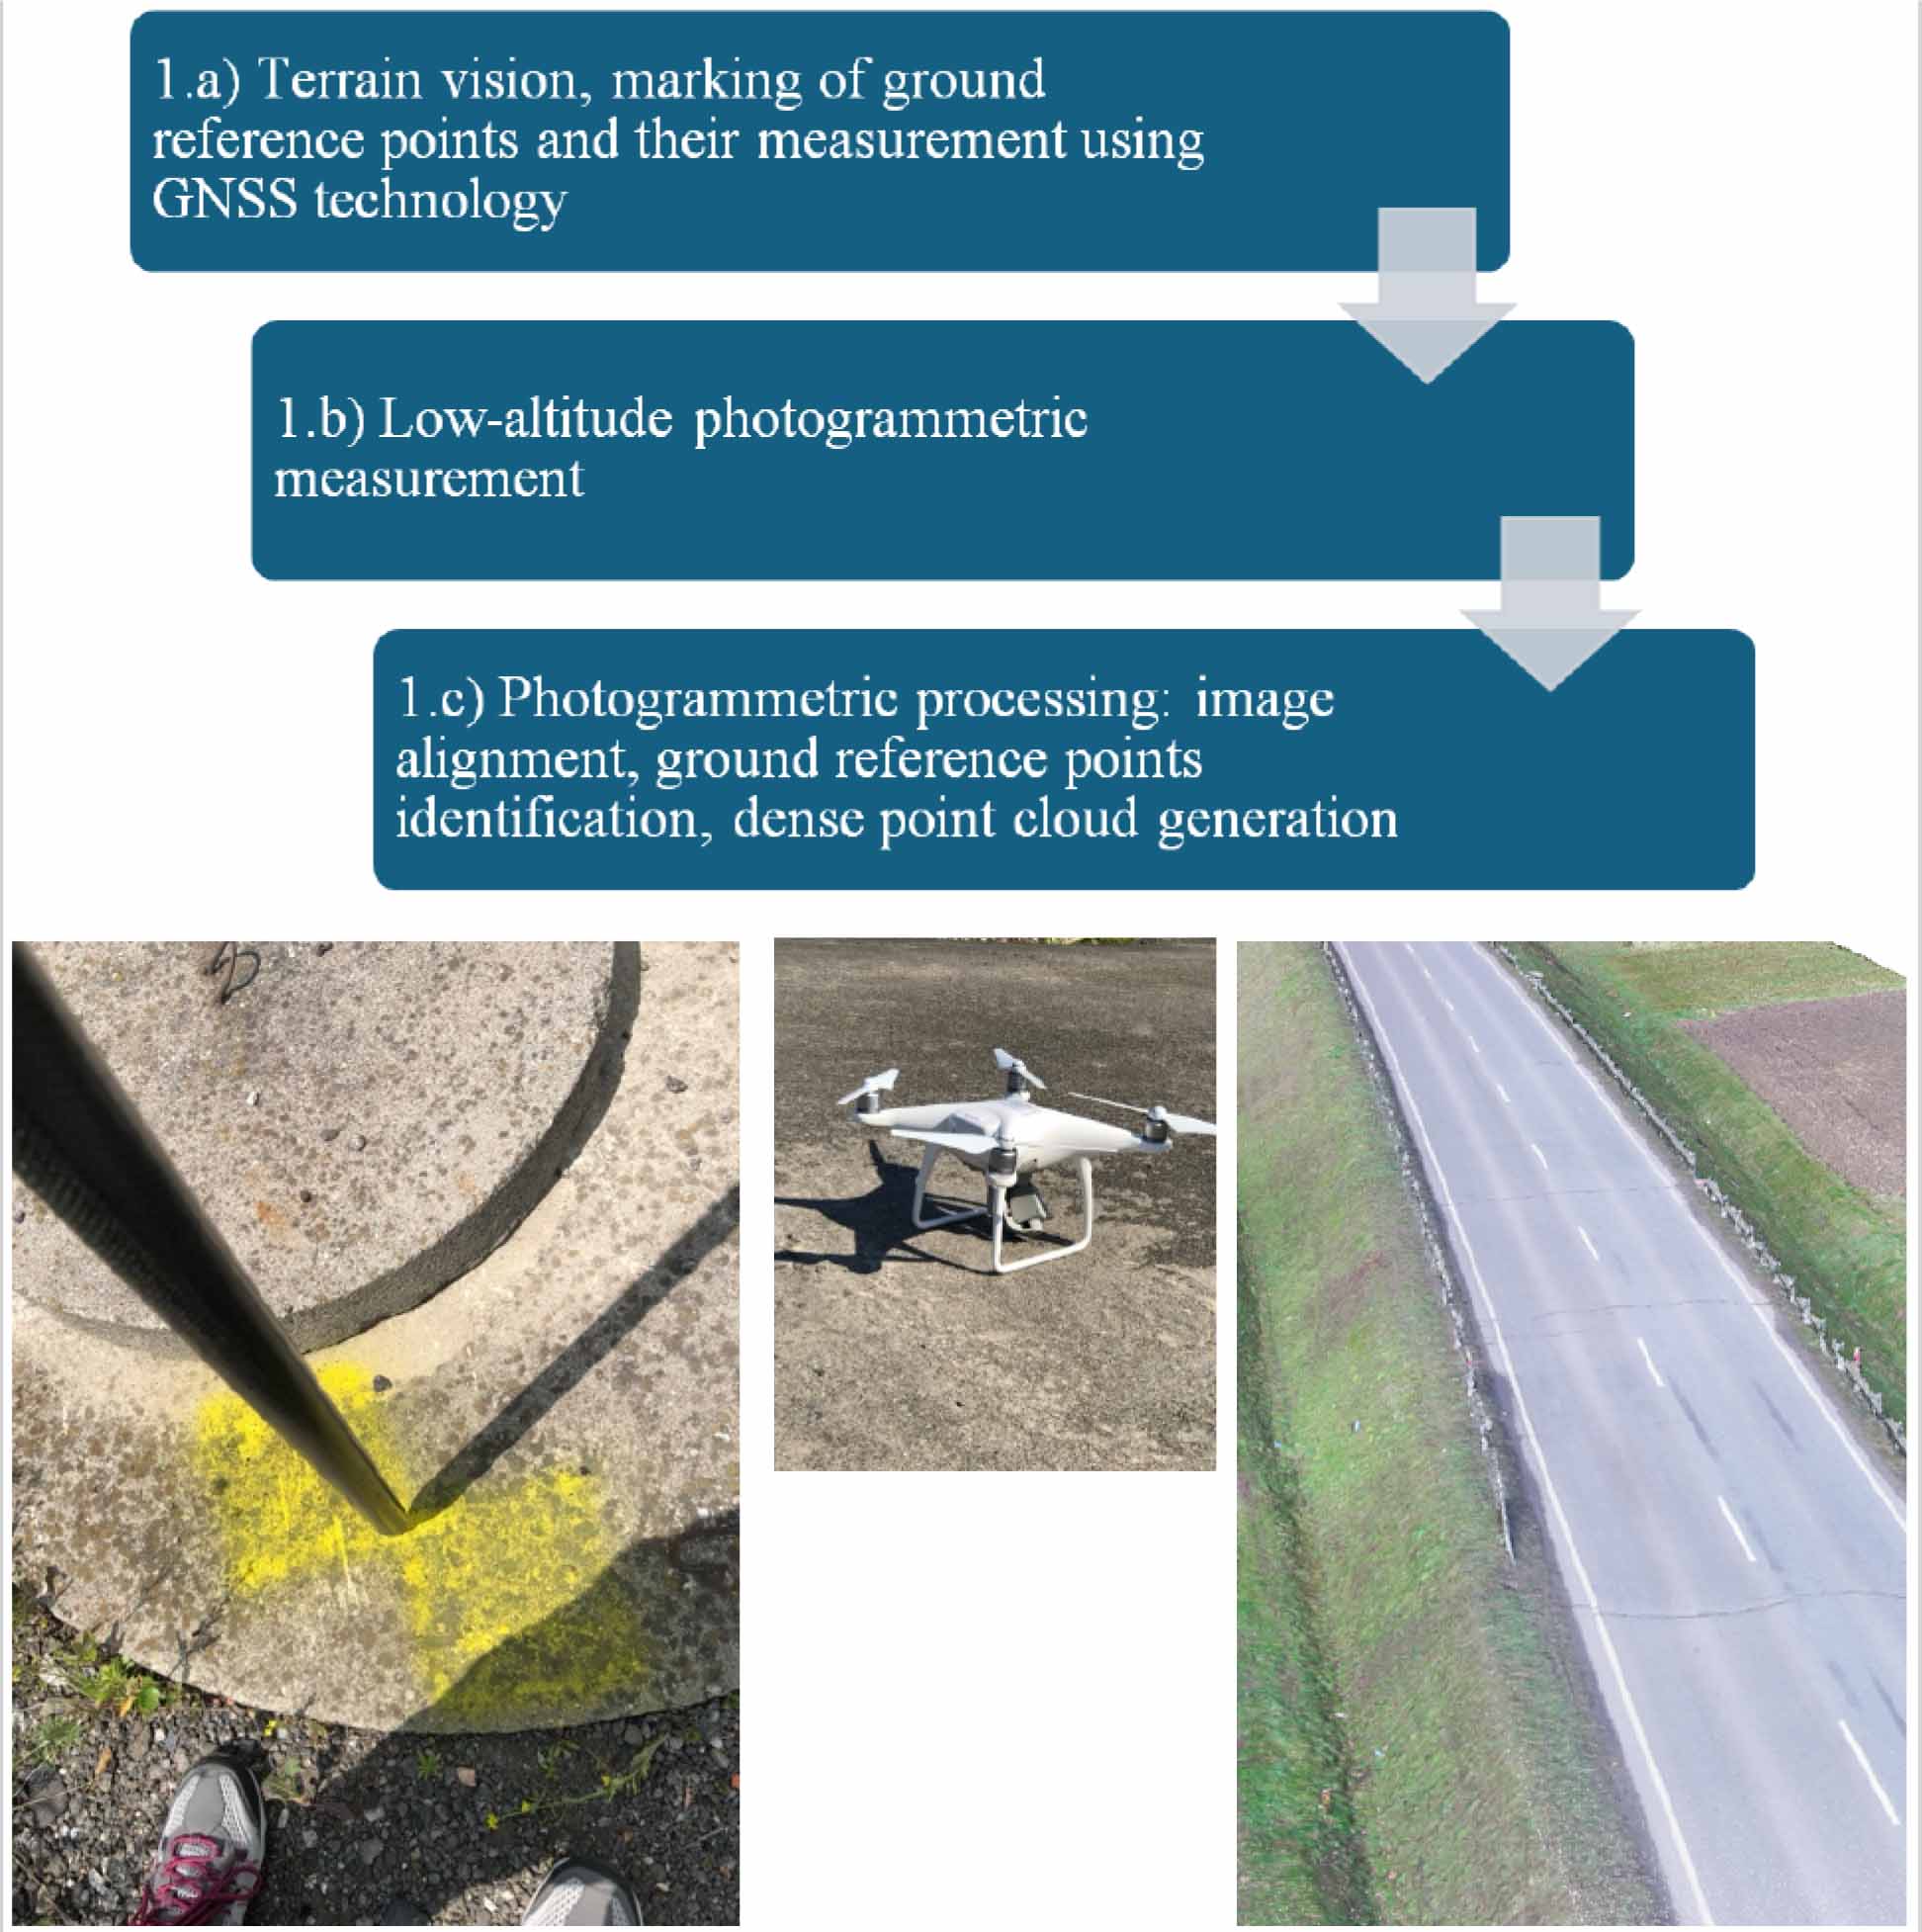
Figure 2.
Location of road areas subject to UAV measurement
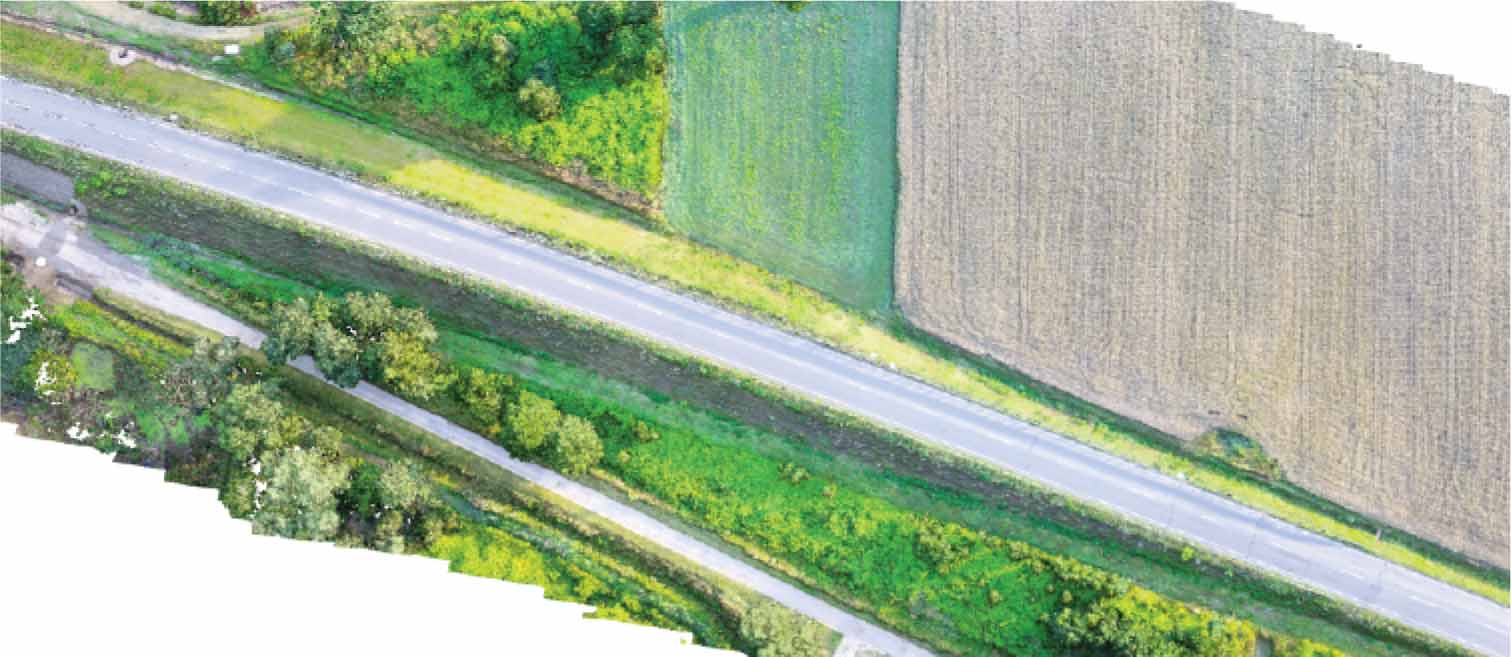
Figure 3.
Generated dense point cloud of the research area
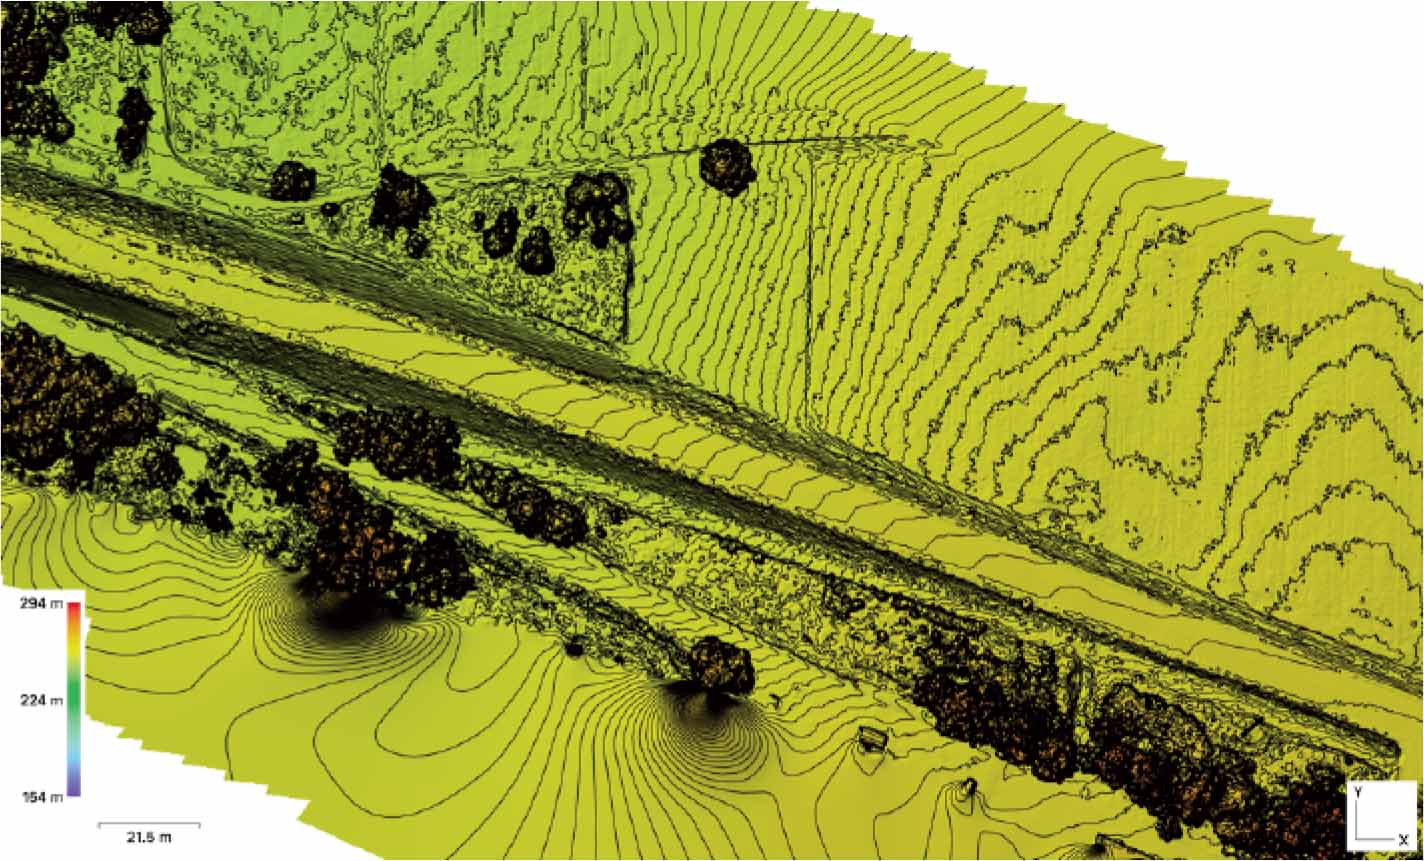
Figure 4.
Hypsometry of the research area
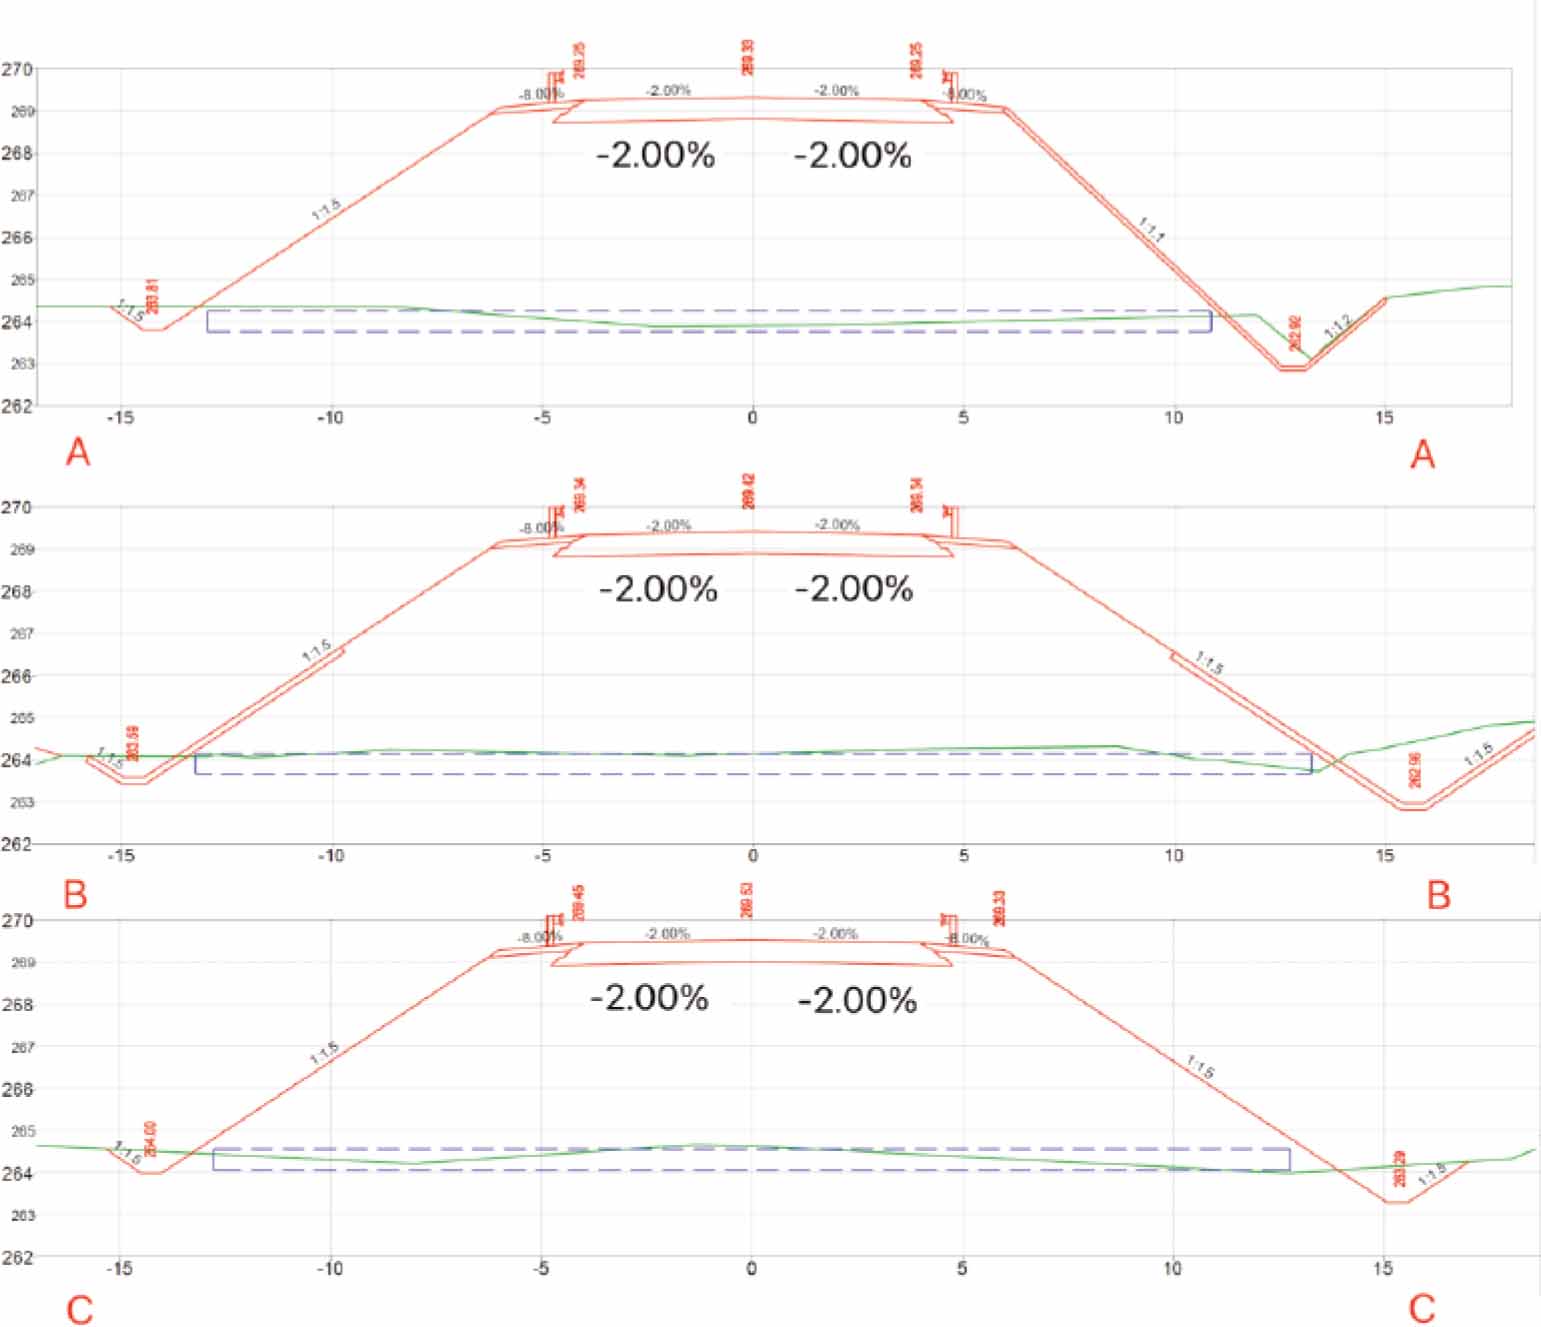
Figure 5.
Sections characteristic for road sections according to the chainage: 0+980.00 (section A-A), 0+998.00 (section B-B) and 1+020.00 (section C-C)-as-built condition
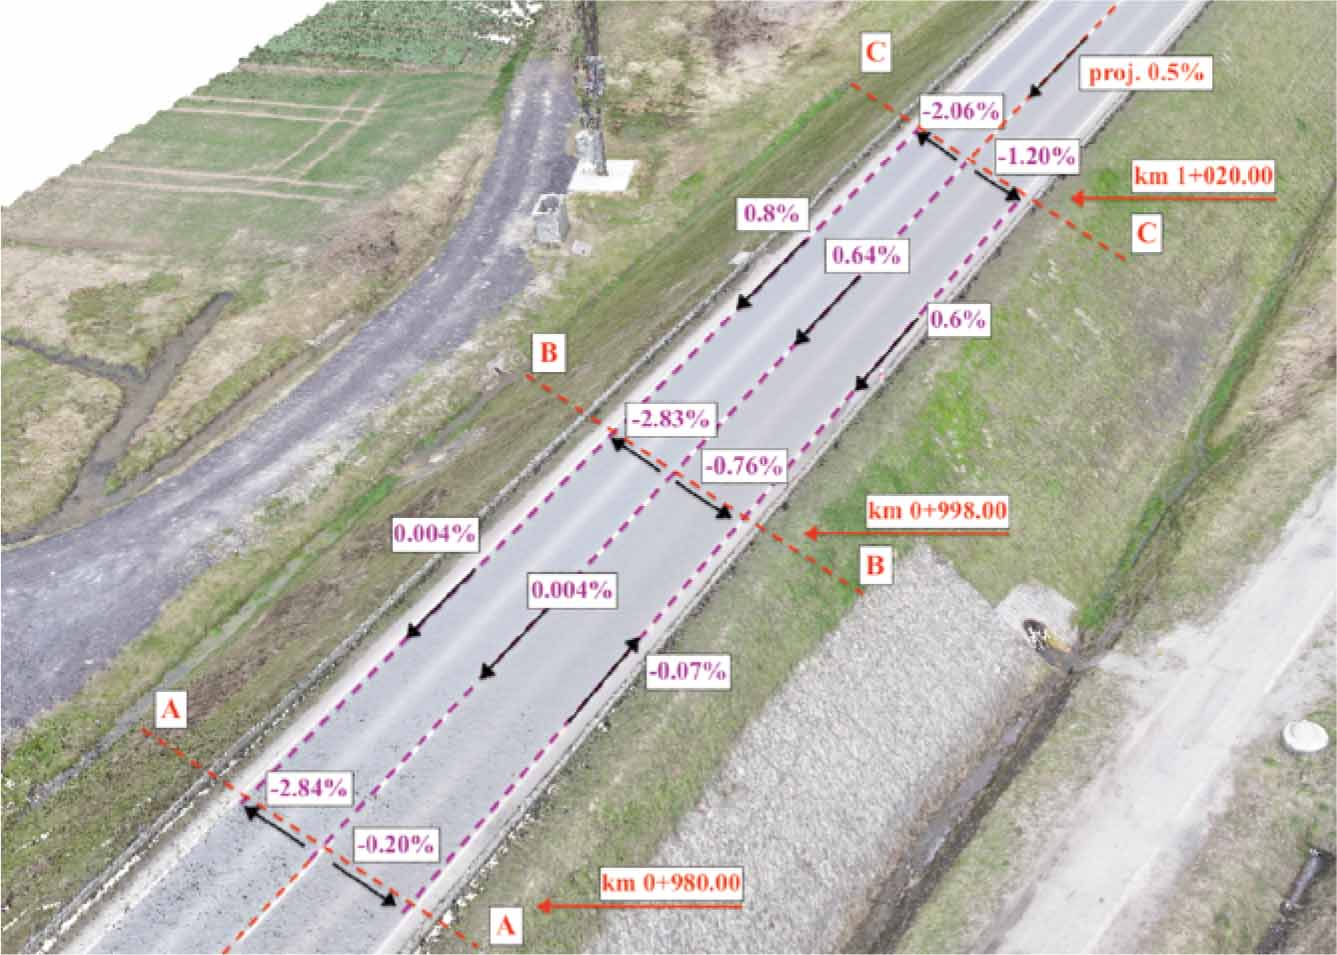
Figure 6.
3D model of a road fragment with defined cross slopes for sections according to chainage: 0+980.00 (section A-A), 0+998.00 (section B-B), 1+020.00 (section C-C) and grade line for the axis and edge of the road
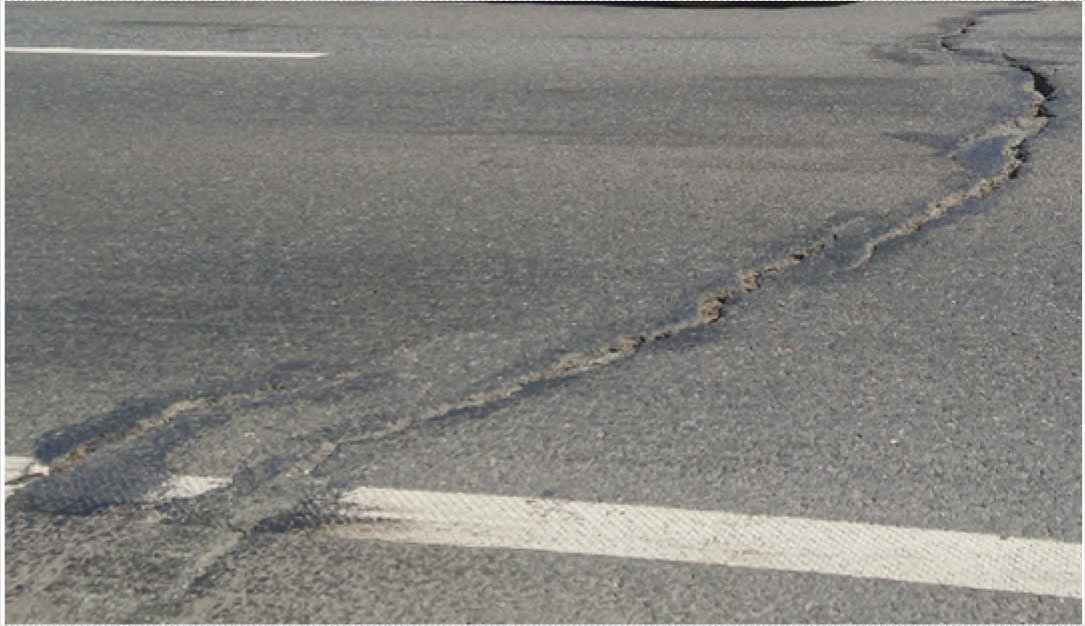
Figure7.
An example of pavement damage revealed in the area of Linear Discontinuous Surface Deformations
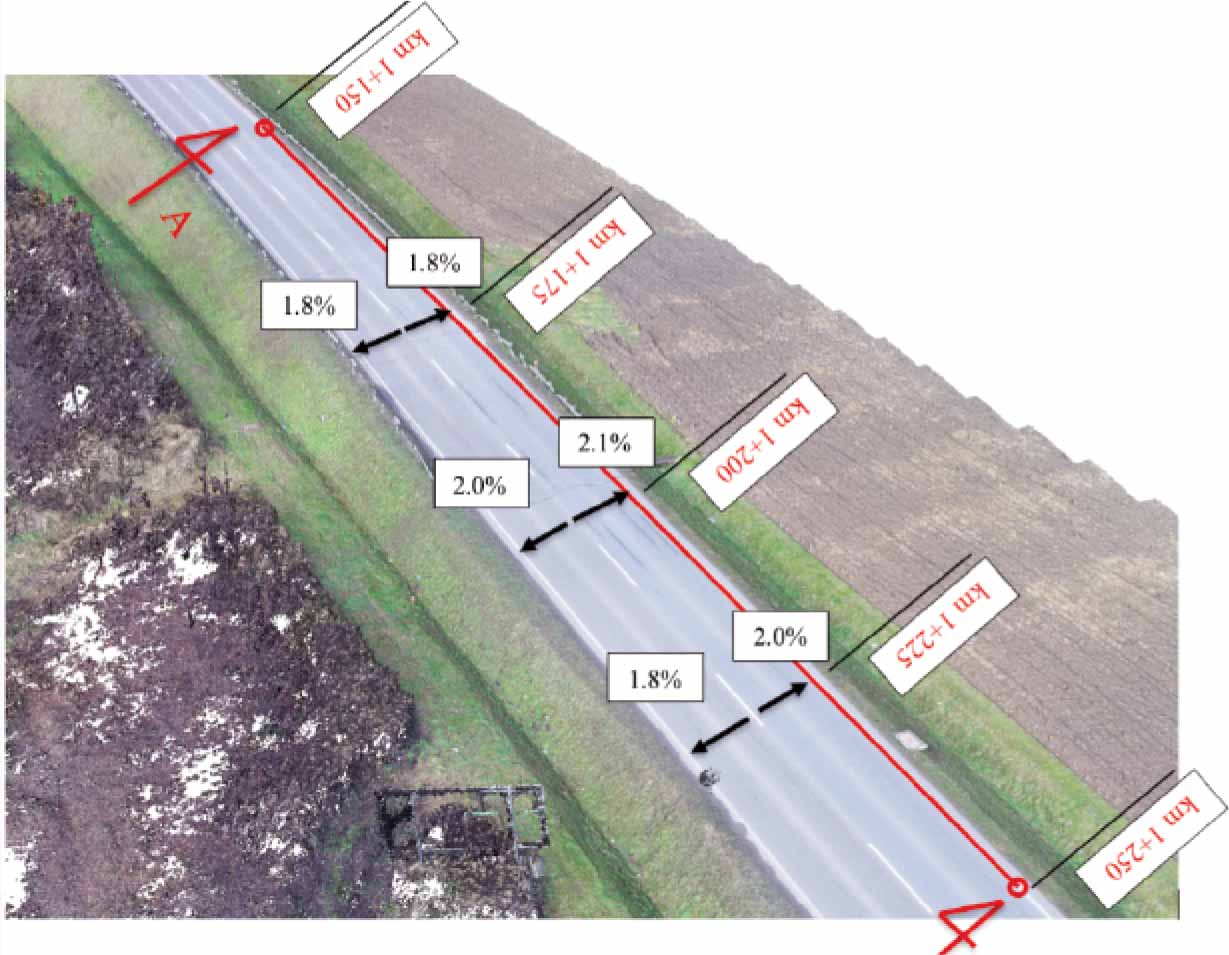
Figure 8.
3D model, a fragment of the road in the area of Linear Discontinuous Surface Deformations with specific cross slopes on selected sections and the indicated longitudinal section A-A
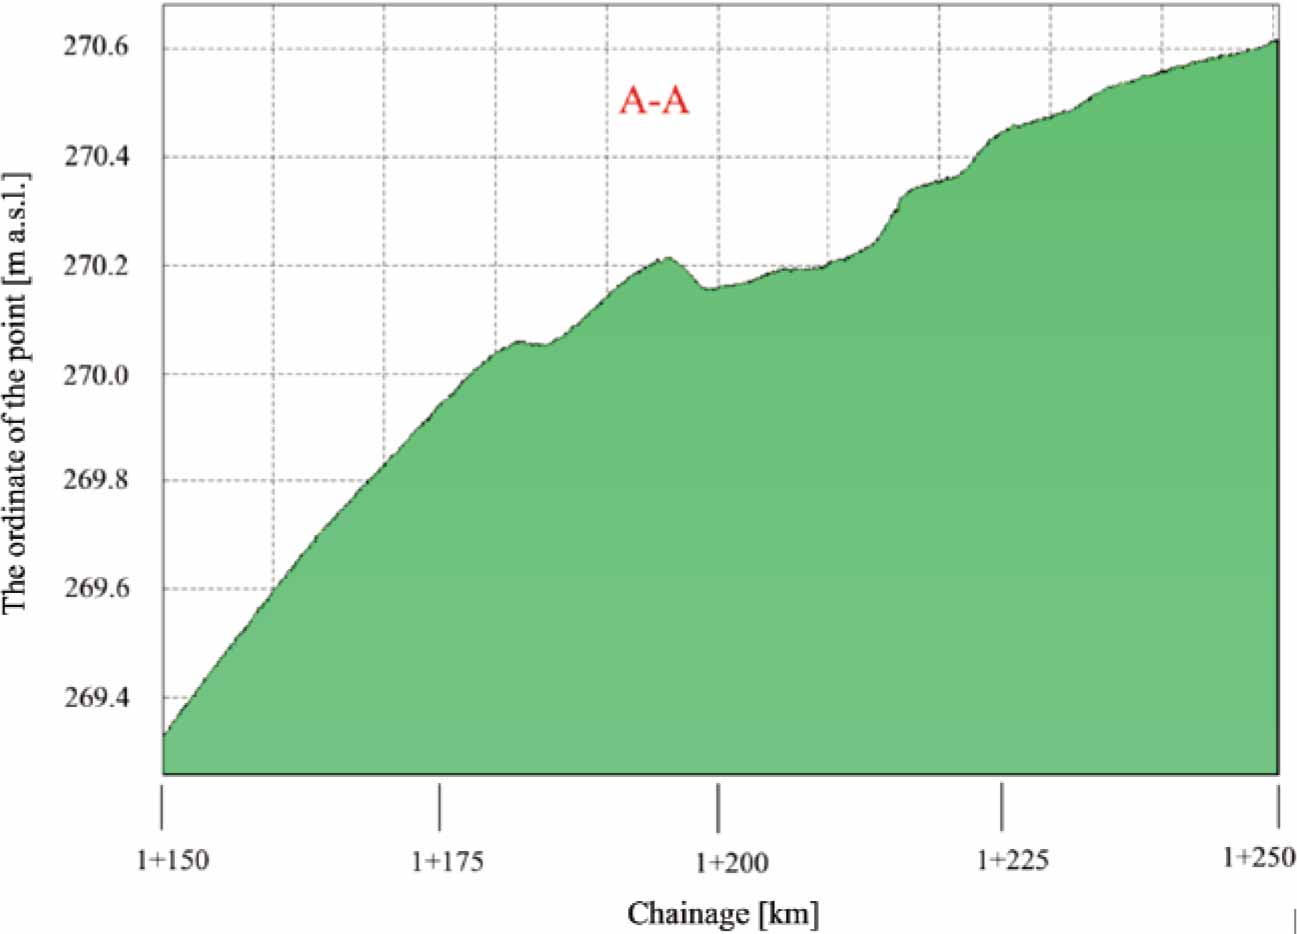
Figure 9.
Longitudinal section A-A in the area of Linear Discontinuous Surface Deformations (LDSD)