
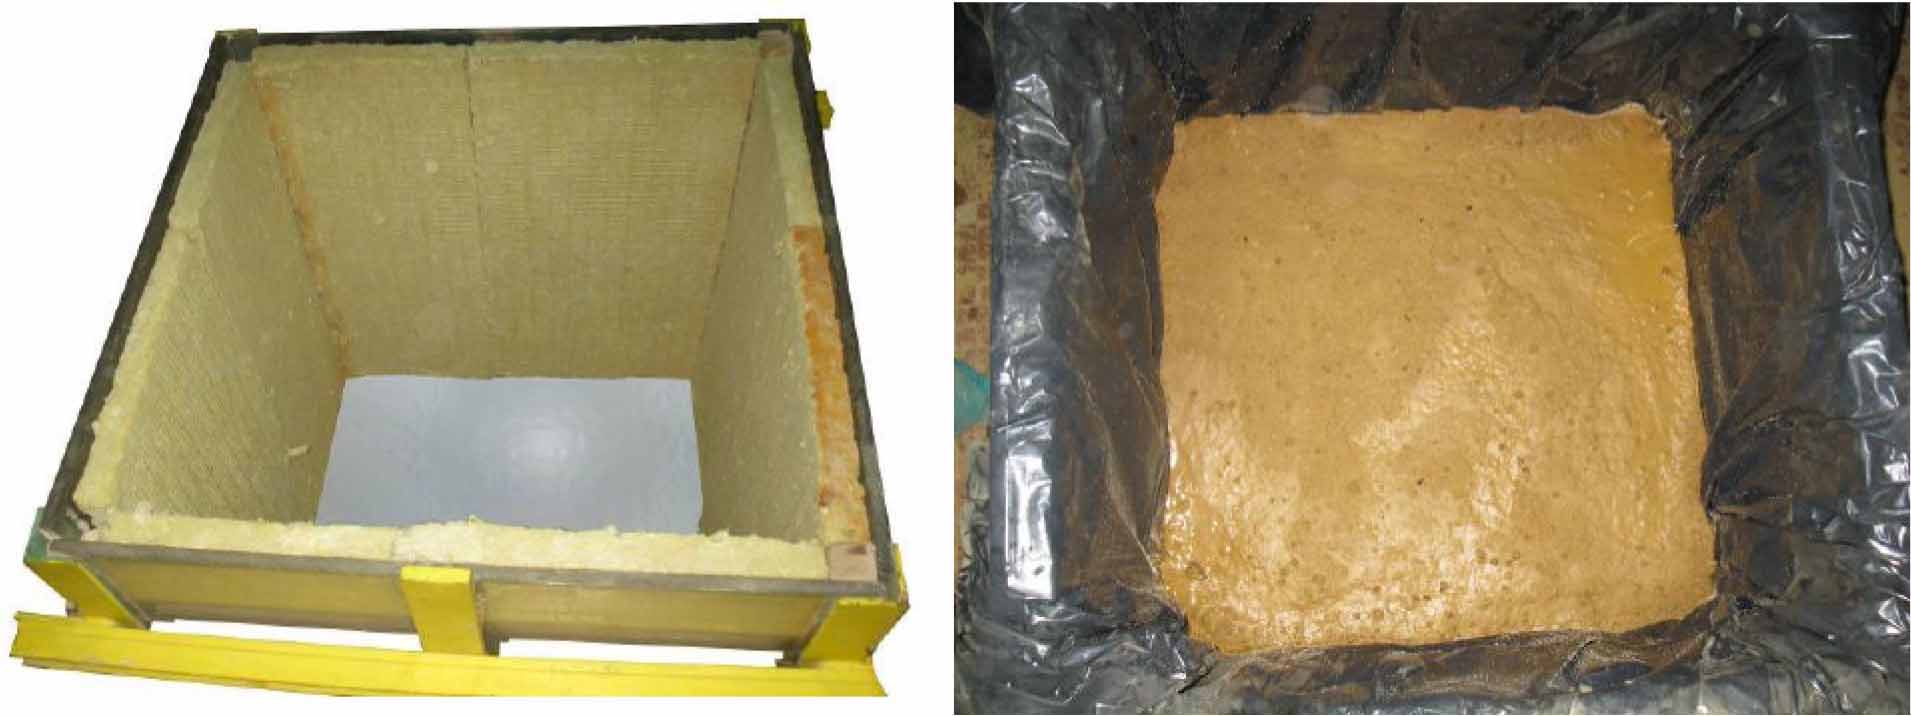
Figure 1.
Test bench: a) damping of the side walls with mineral wool, b) view of the clay layer with foil protection
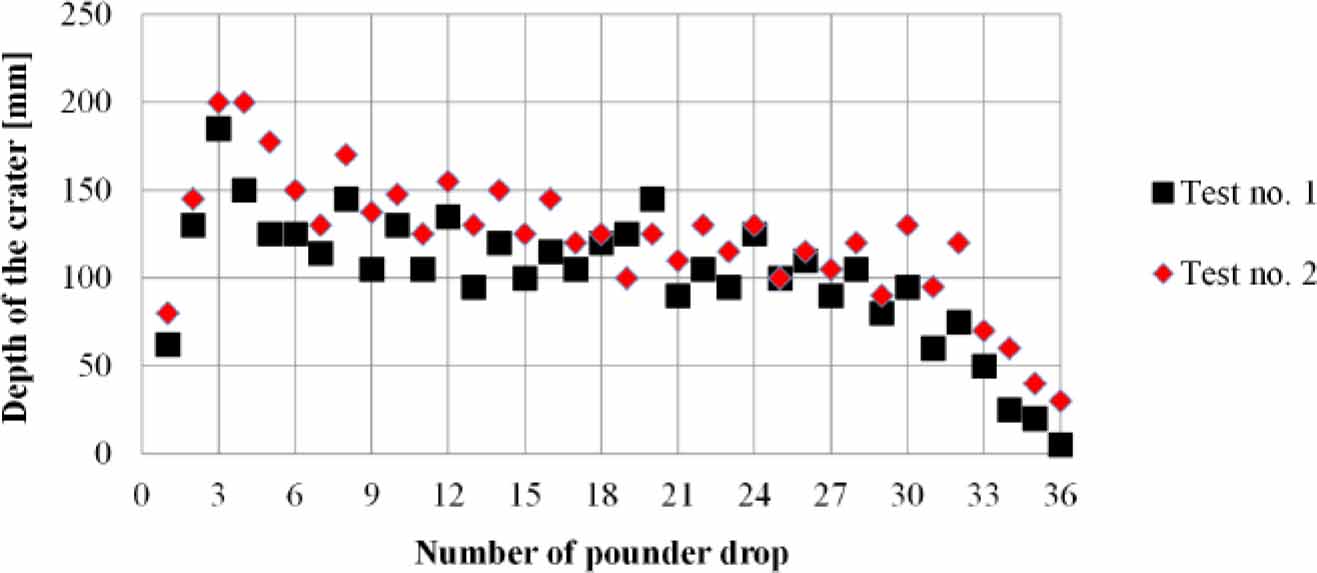
Figure 2.
Crater depths after individual pounder blows
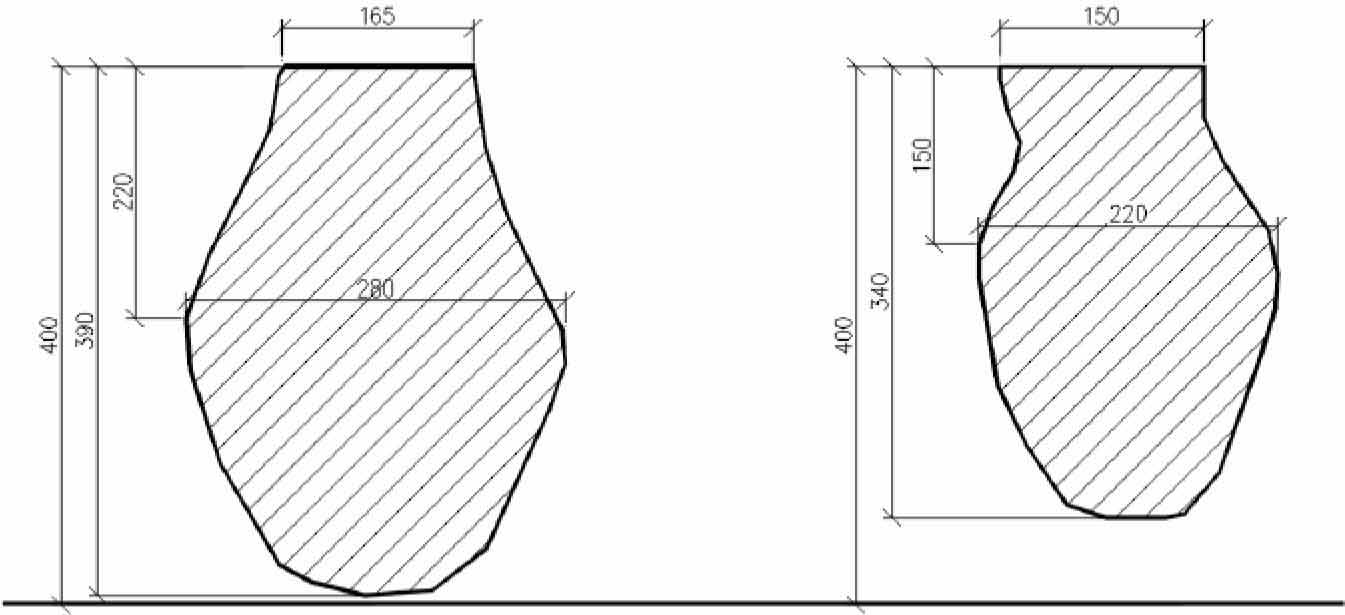
Figure 3.
Inventoried shape of the columns: a) No. 1, b) No. 2
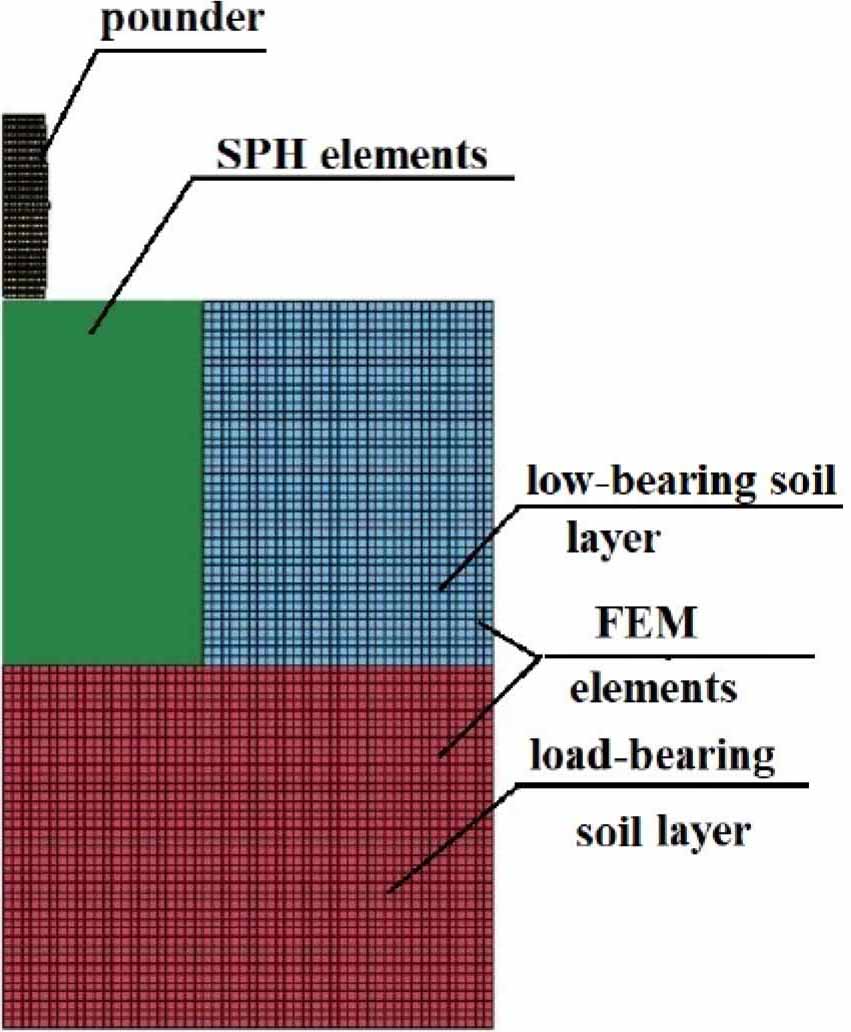
Figure 4.
Numerical model
Table 1.
Adopted constitutive models and their parameters
| Lp. | Kind | Constitutive model adopted | Model parameters |
|---|---|---|---|
| 1. | Pounder | 020-Rigid | E=210 GPa, ν=0.3, γ=74 kN/m3, |
| 2. | Base layer Medium sand, ID=0.88 | 173-Mohr-Coulomb | G=41.7 MPa, ϕ=33, c=0 kPa, ν=0.2, γ=18 kN/m3 |
| 3. | Improved layer Silty clay IL=0.7 | 173-Mohr-Coulomb (Tresca criterion) | G=1.39 MPa, Su=10.2 kPa, ν=0.31, γ=18.7 kN/m3 |
| 4. | DR column aggregate | 173-Mohr-Coulomb | G=6.86 MPa, ϕ=47, c=0 kPa, ν=0.2, γ=18 kN/m3 |
| 5. | Pounder contact elements – SPH elements | Nd | FS=0.5 FD=0.4 |
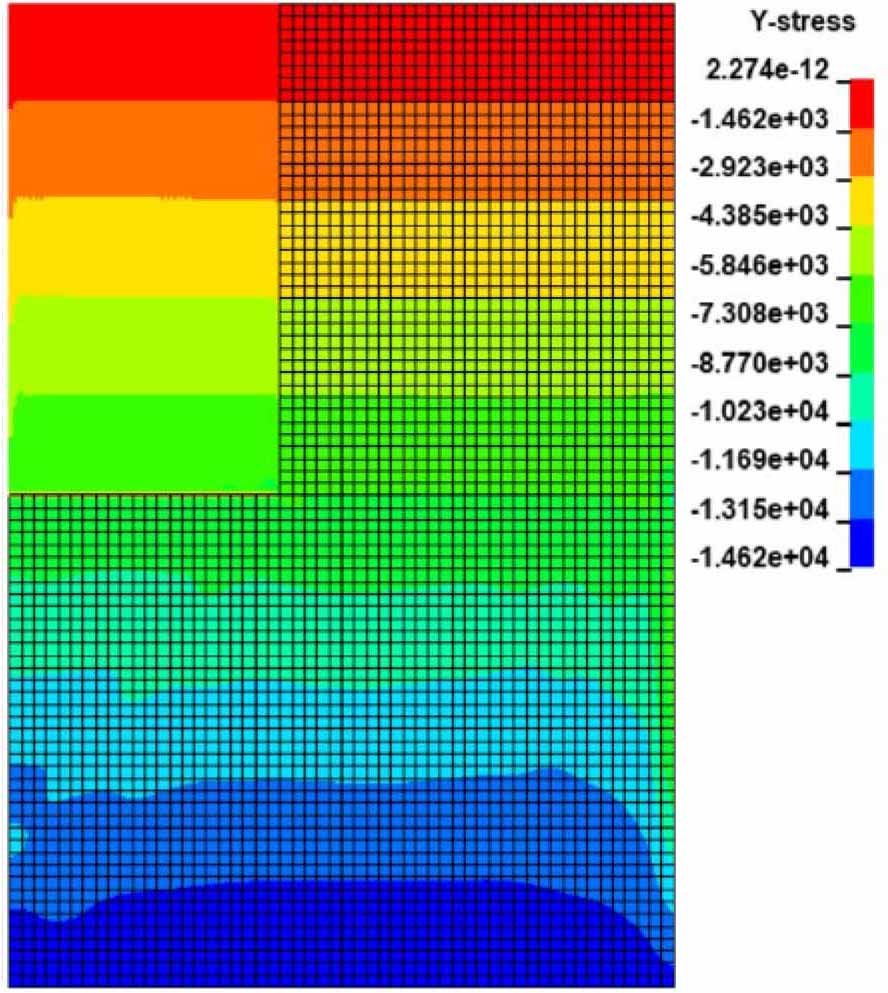
Figure 5.
Primary stress values before modelling dynamic replacement
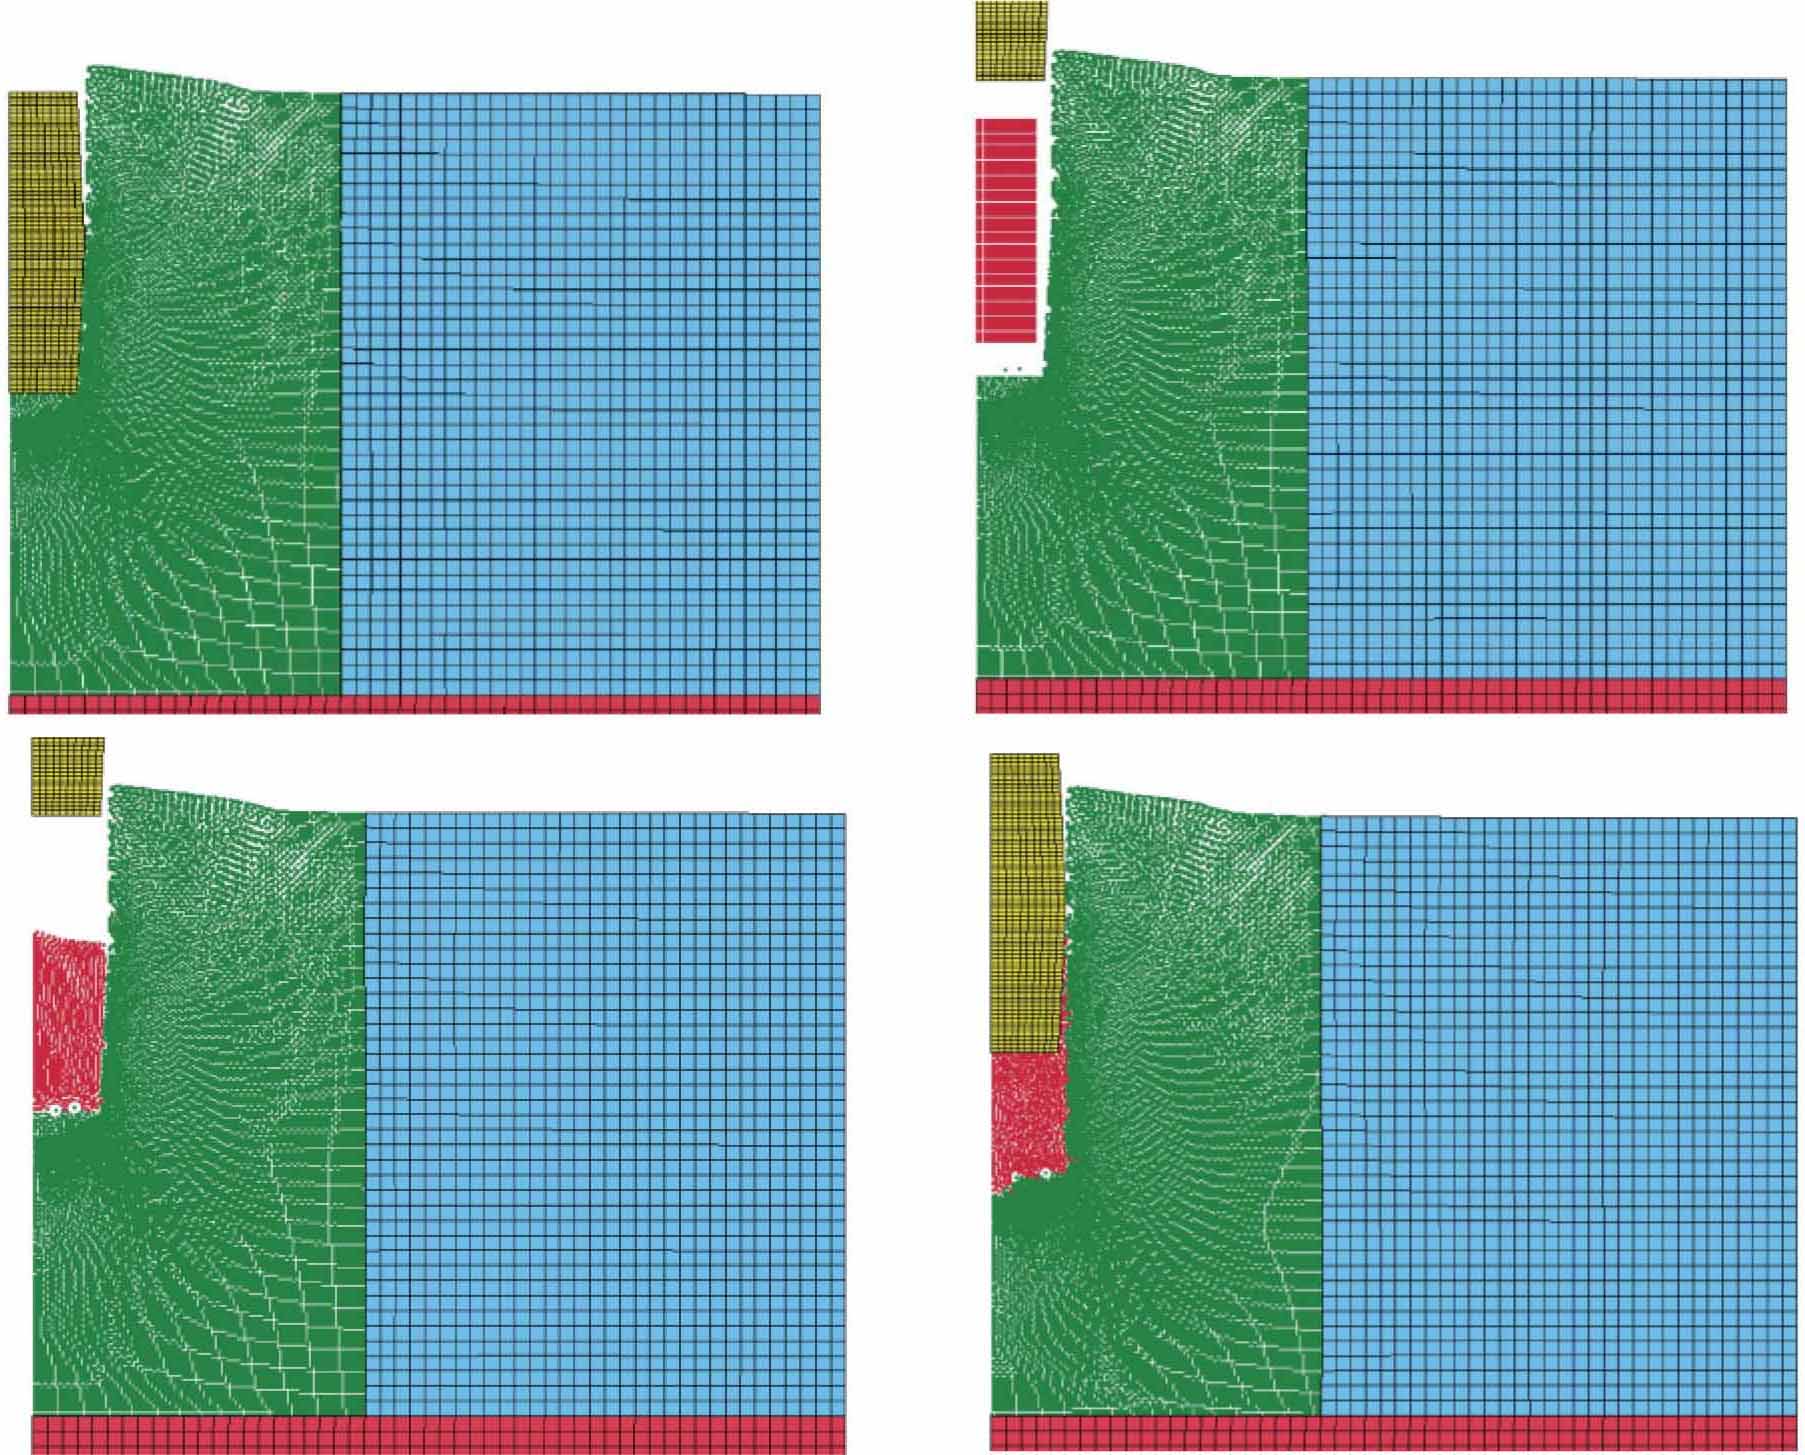
Figure 6.
View of the model in the characteristic stages associated with the first fill: a) after the 3rd pounder drop, b) free-falling aggregate into the crater, c) backfill after pouring into the crater, d) after pounder drop into the aggregate
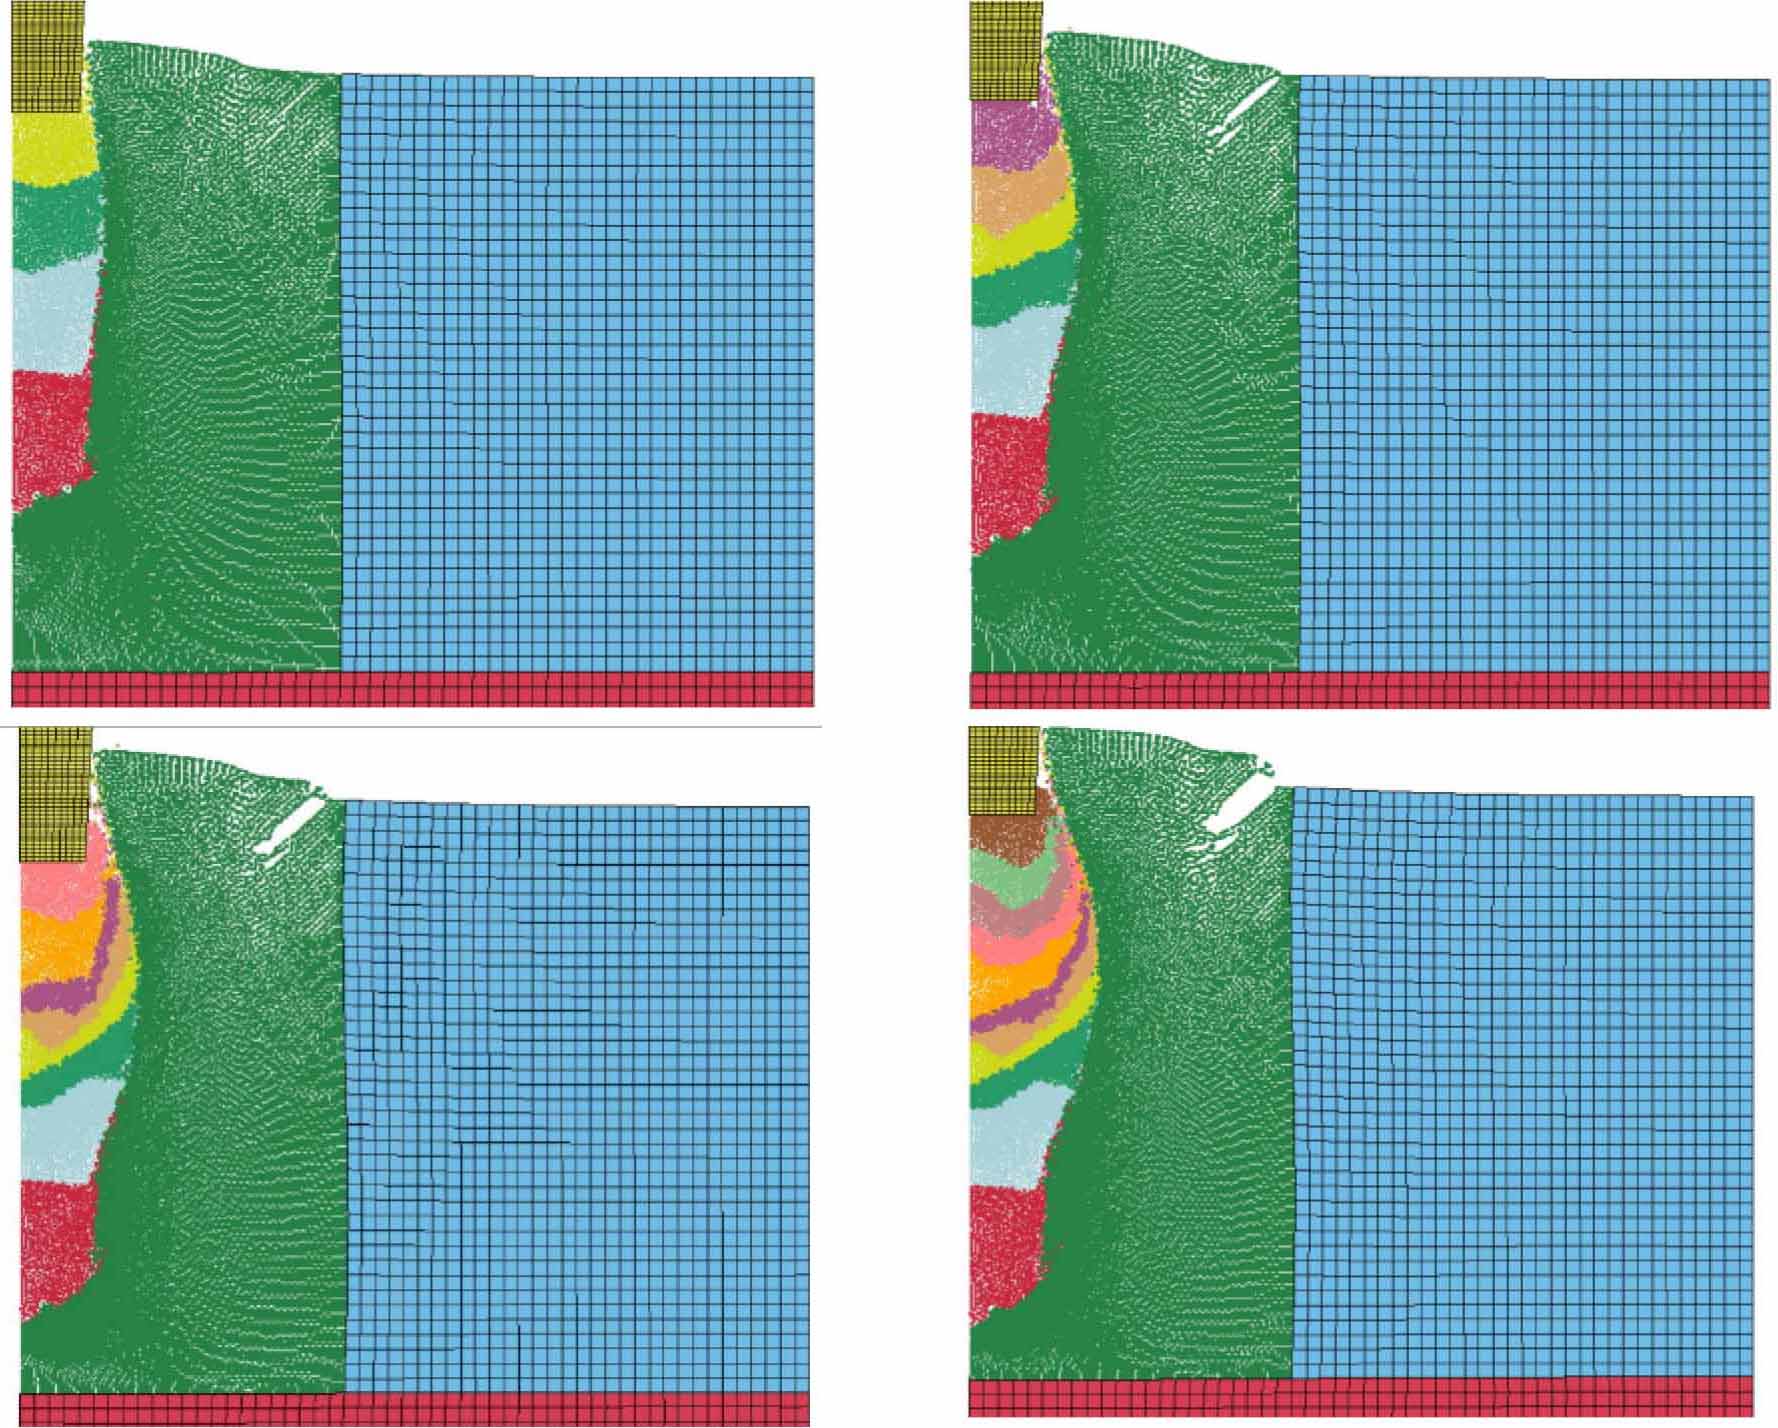
Figure 7
View of the model after the pounder blow in: a) 4 charges, b) 6 charges, c) 8 charges, d) 11 charges
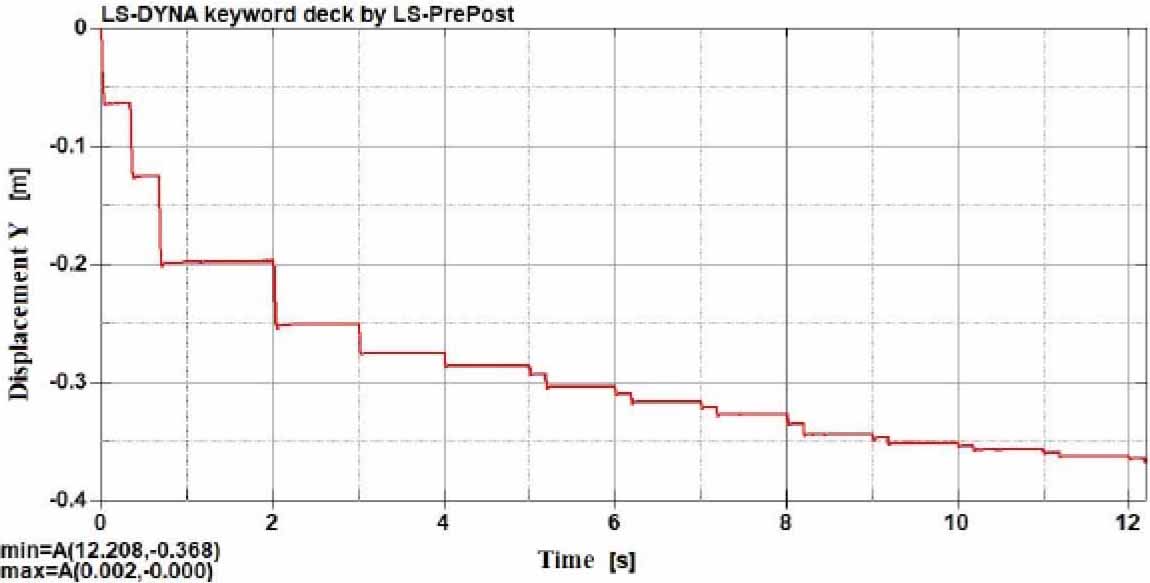
Figure 8.
Diagram of vertical displacements of the SPH element occurring directly under the base of the column (the first discharge into the aggregate after 2 s, preceded by 3 discharges forming the crater)
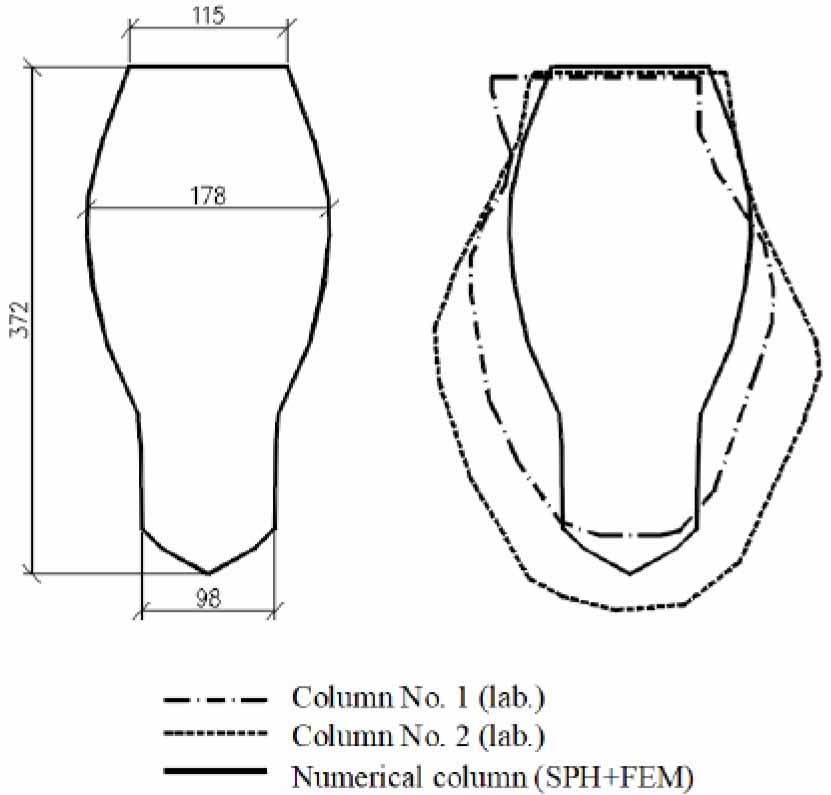
Figure 9
Shapes of the obtained columns: a) numerical column, b) comparison of shapes: numerical and laboratory
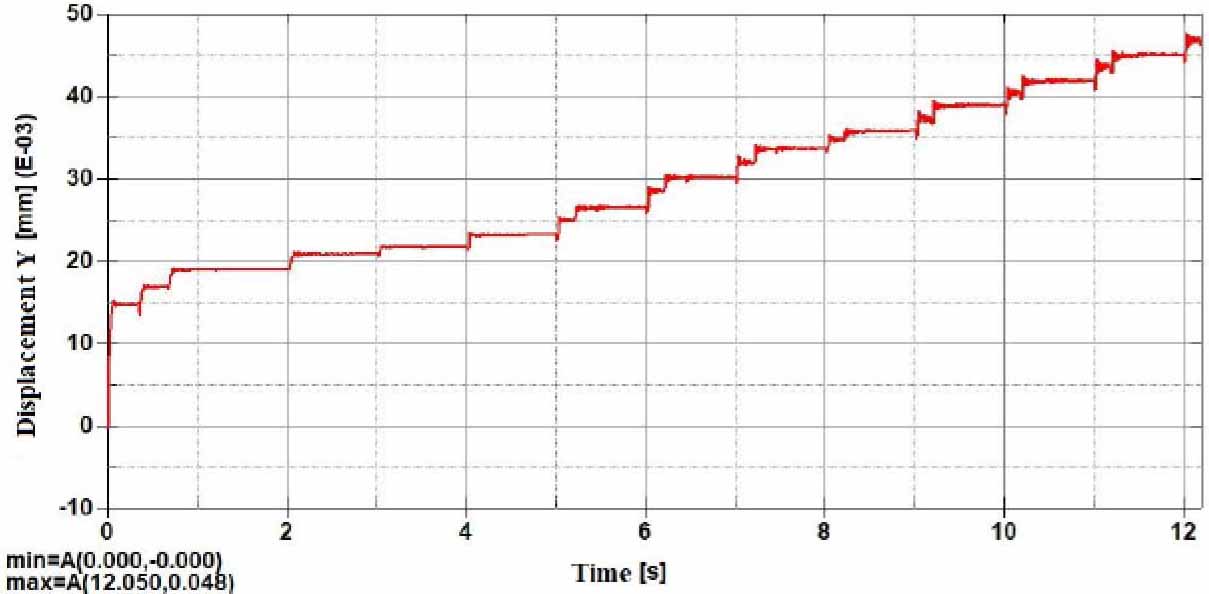
Figure10.
Diagram of vertical displacements of the SPH element occurring in the upper part of the model directly next to the dropped pounder
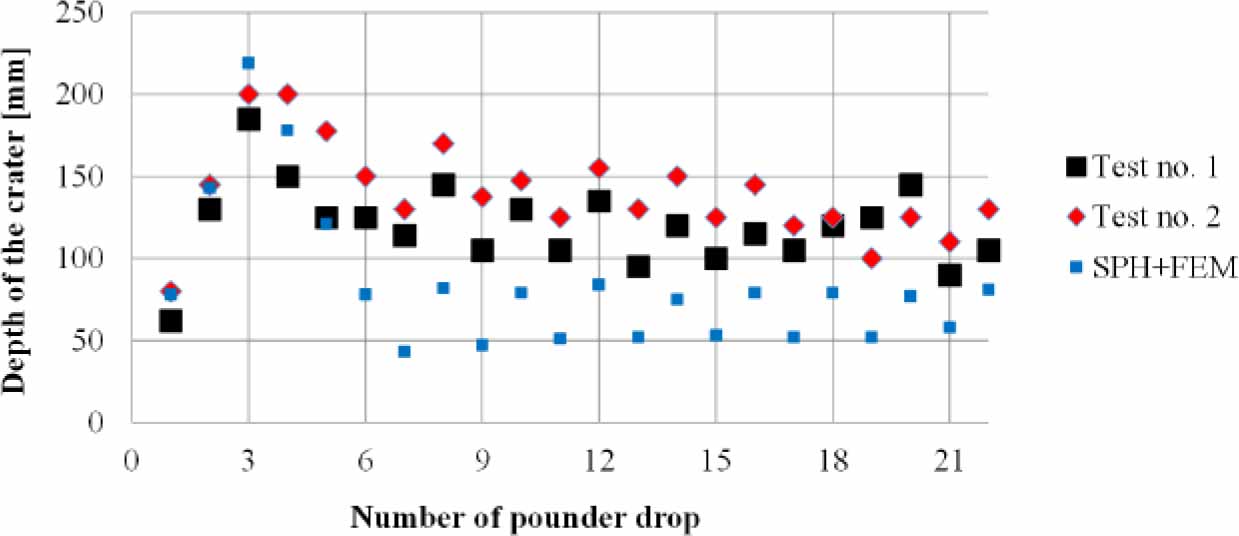
Figure 11.
Comparison of the depth of the crater obtained in laboratory tests and SPH+FEM calculations