Figure 1.
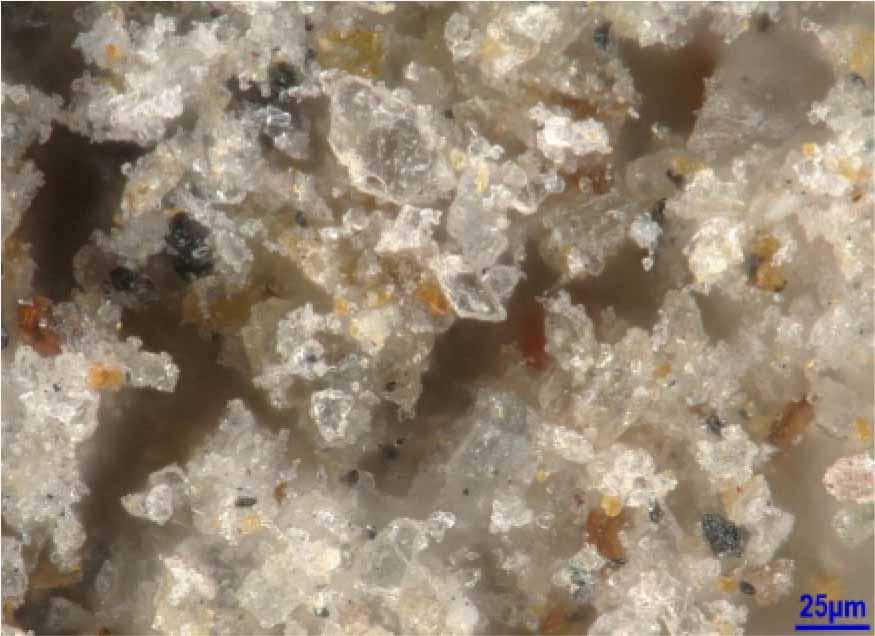
Figure 2.
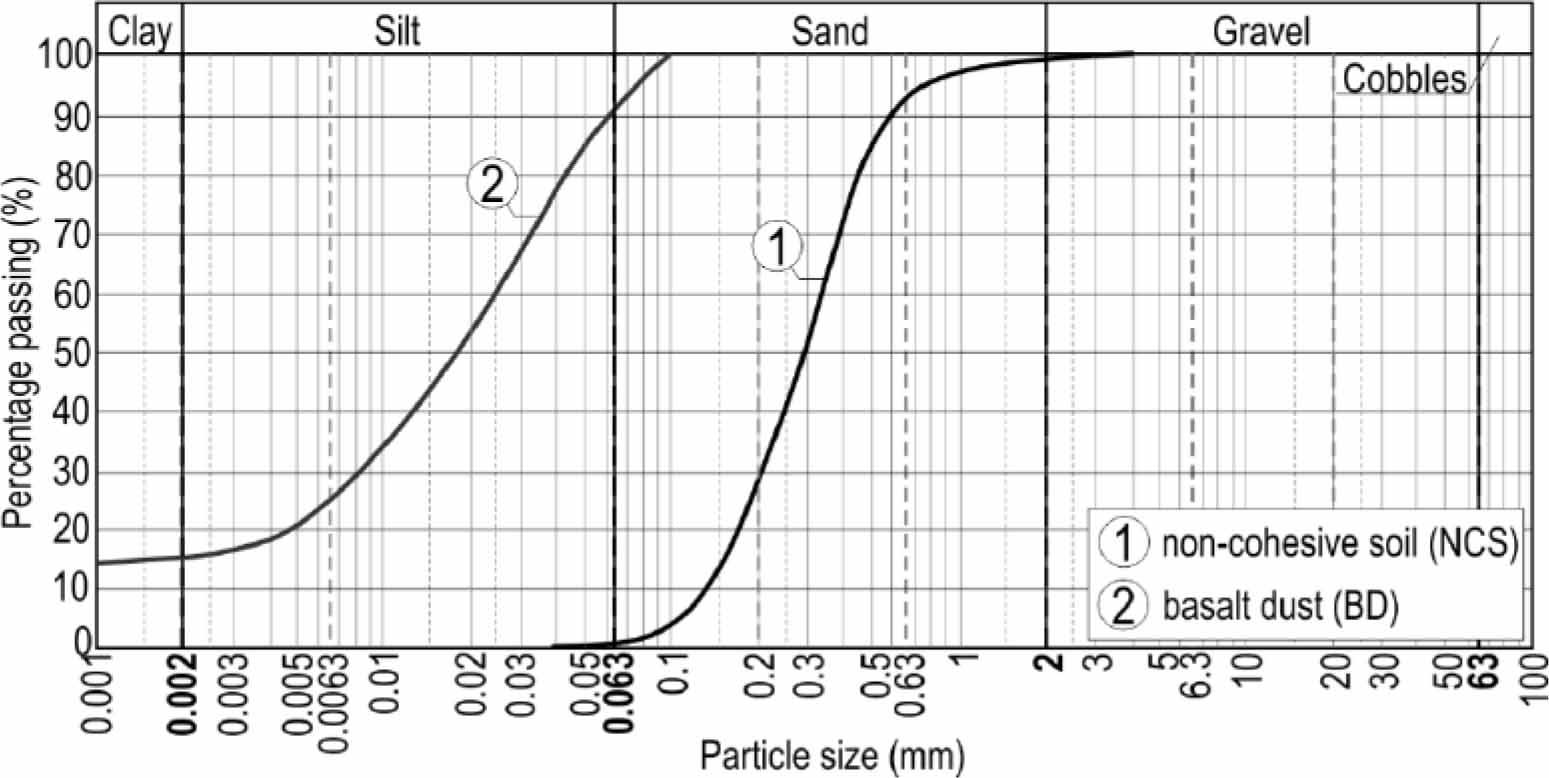
Figure 3.
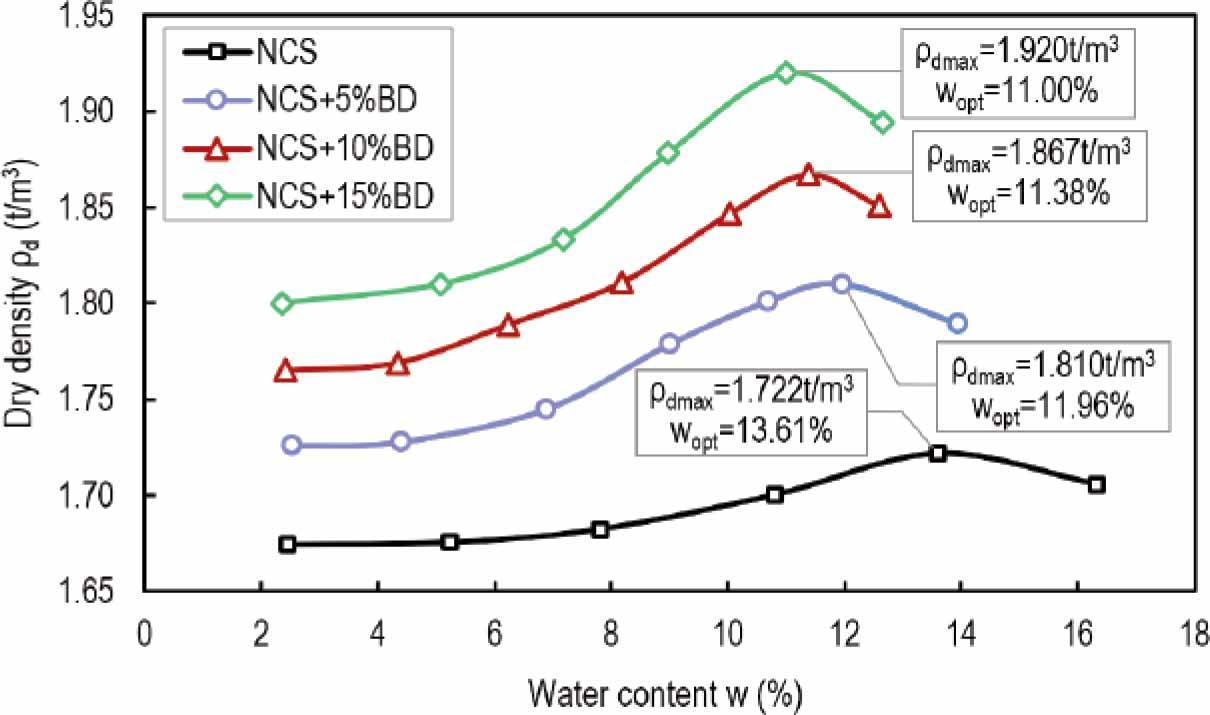
Figure 4.
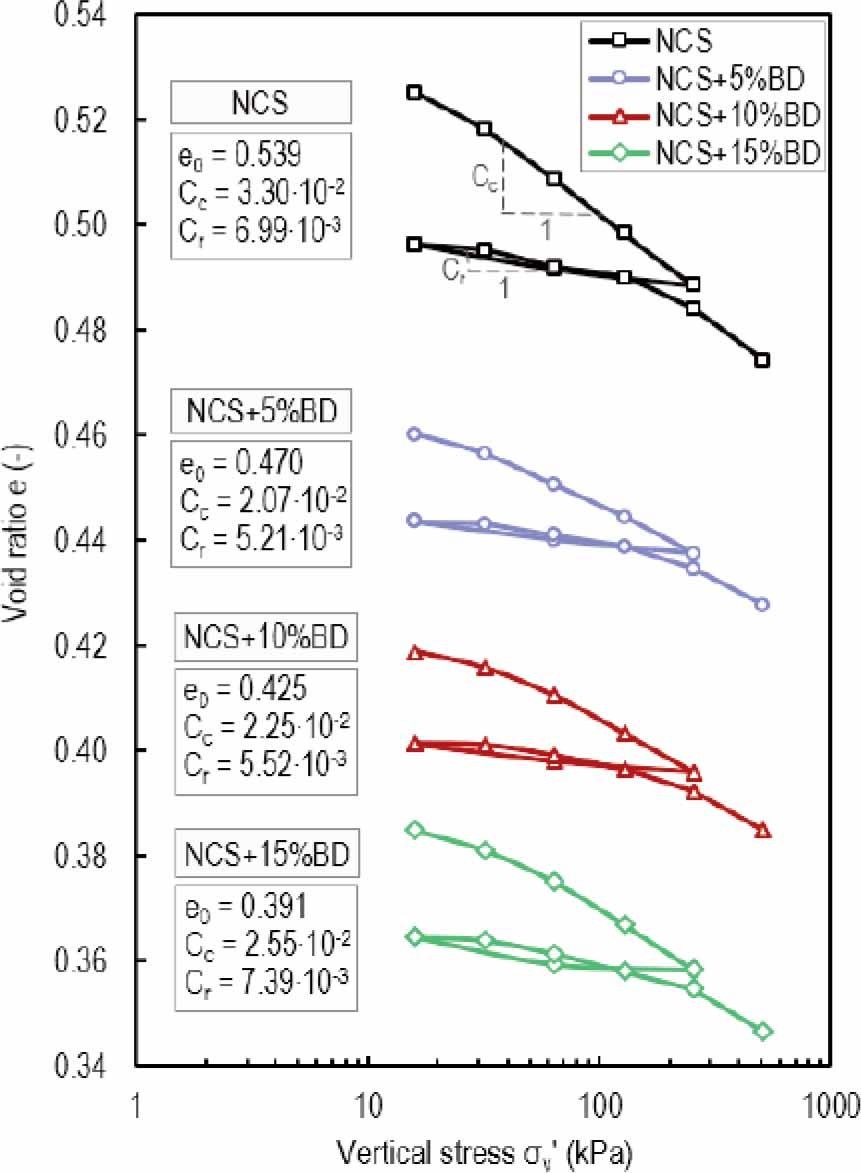
Figure 5.
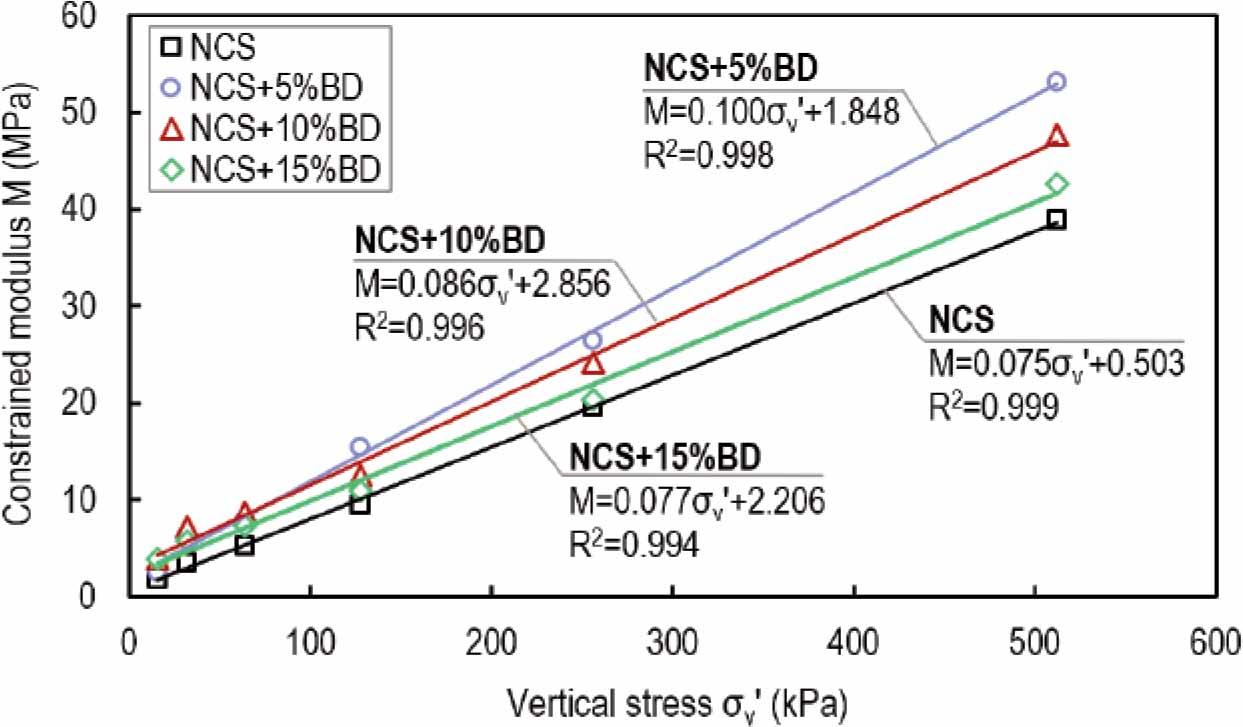
Figure 6.
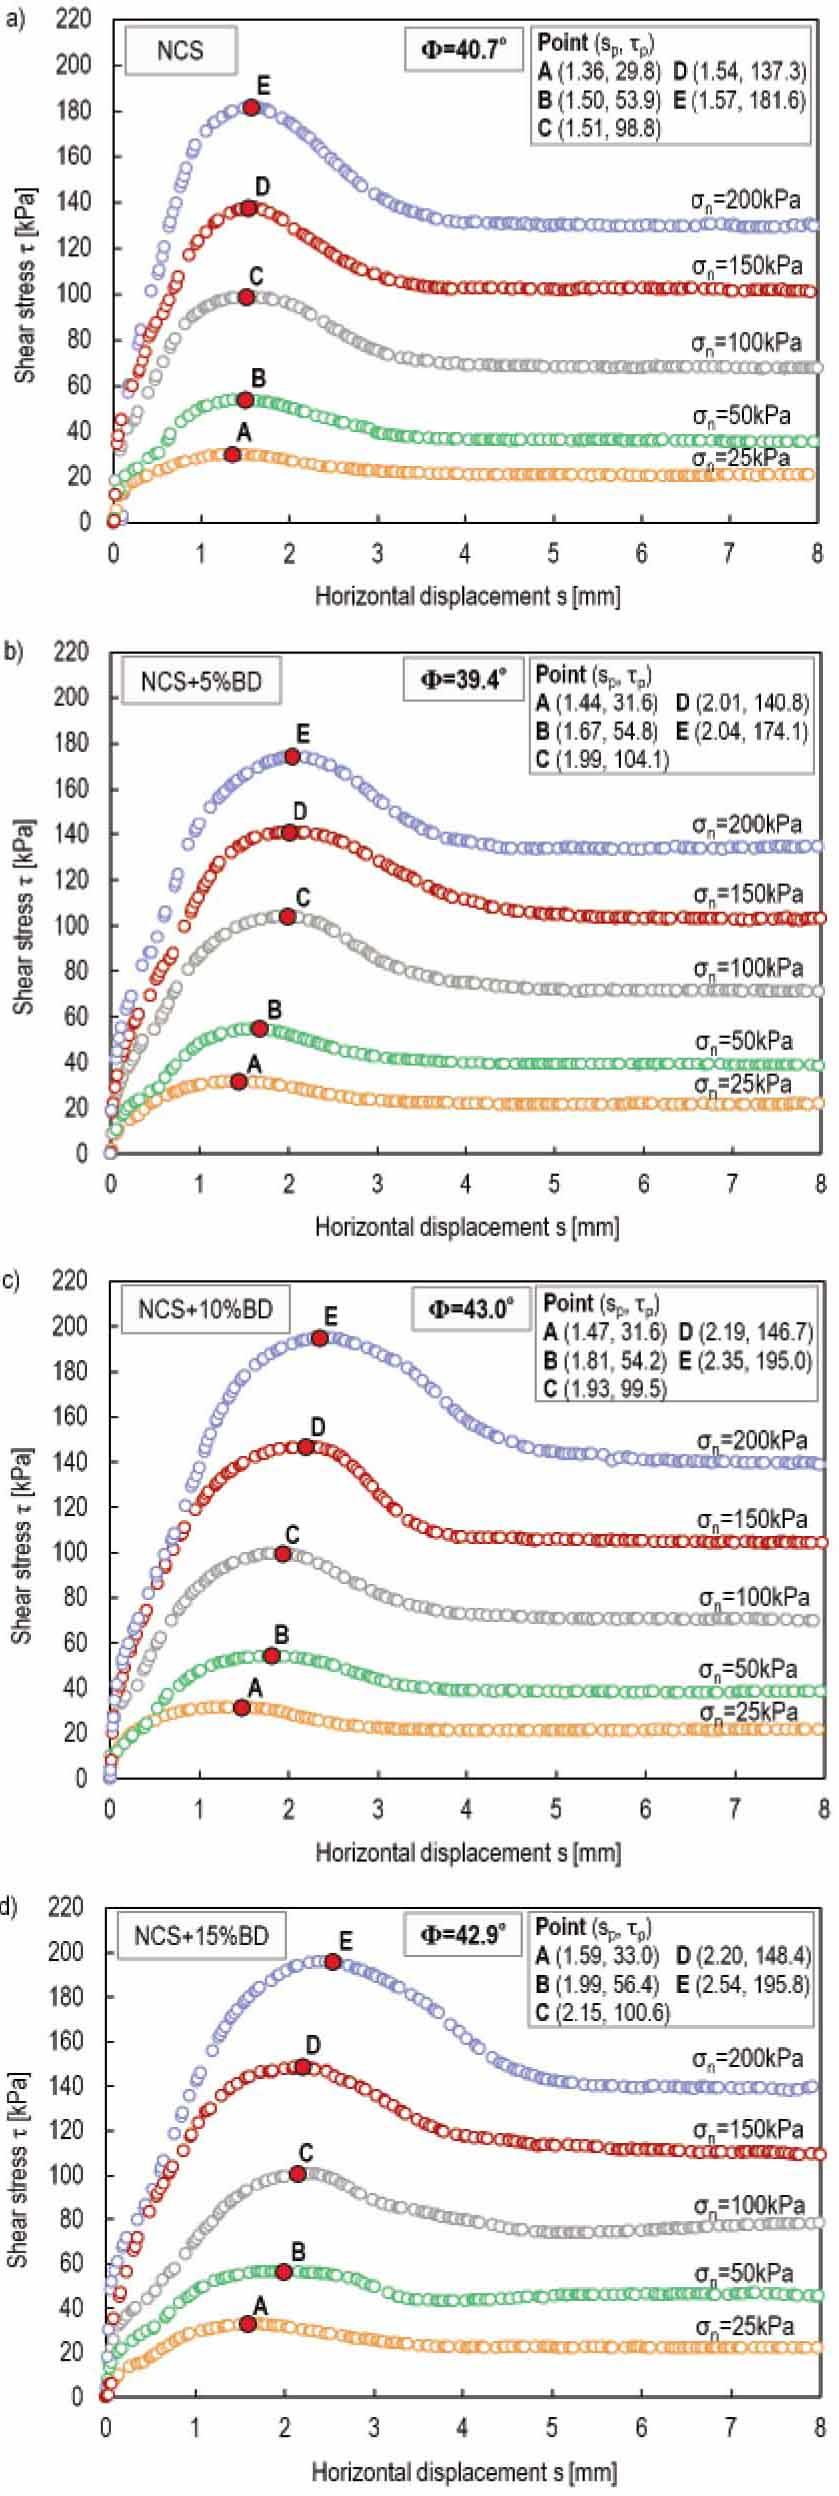
Tested and corrected coefficients of permeability
| Material | k (m/s) | k10 (m/s) |
|---|---|---|
| NCS | 1.72·10−4 | 1.20·10−4 |
| NCS+5%BD | 8.00·10−5 | 5.57·10−5 |
| NCS+10%BD | 6.76·10−5 | 4.71·10−5 |
| NCS+15%BD | 4.60·10−5 | 3.20·10−5 |
Basic properties of the tested materials
| Property | Value | |
|---|---|---|
| NCS | BD | |
| Particle size distribution | ||
| Gravel (%) | 0.2 | – |
| Sand (%) | 99.7 | 9.9 |
| Silt (%) | 0.1 | 75.2 |
| Clay (%) | – | 14.9 |
| Coefficient of uniformity (Cu) | 2.43 | > 25.0 |
| Coefficient of curvature (Cc) | 0.84 | > 2.56 |
| Specific dry density (t/m3) | 2.65 | 2.76 |