
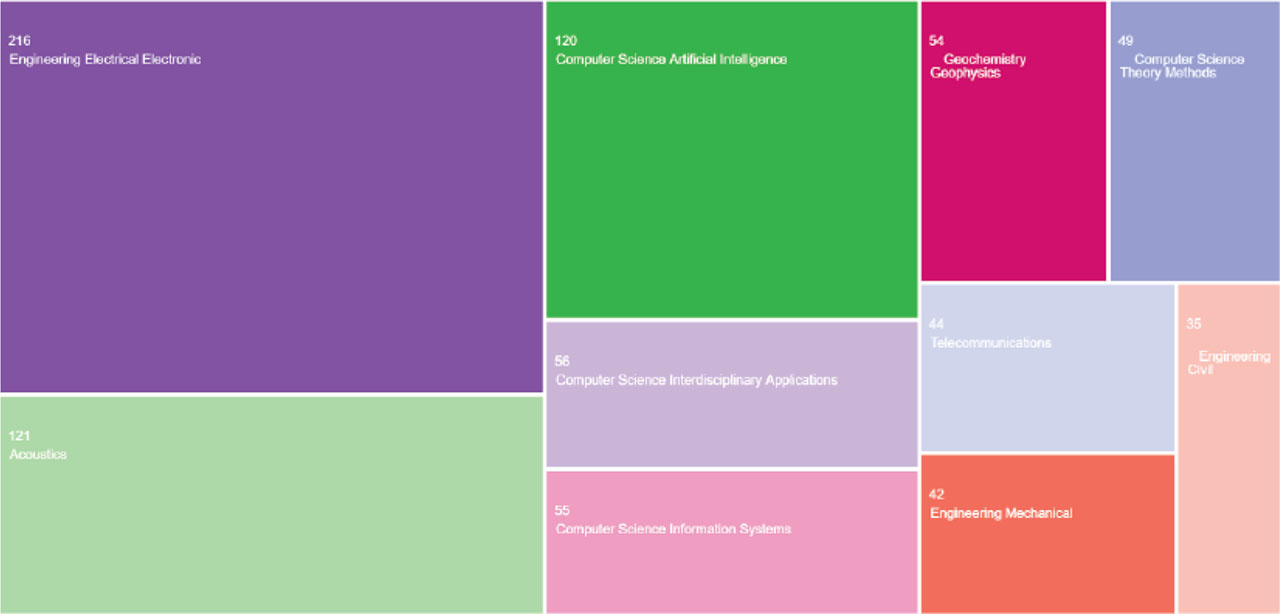
Figure 1.
WOS Categories distribution in bibliometric analysis
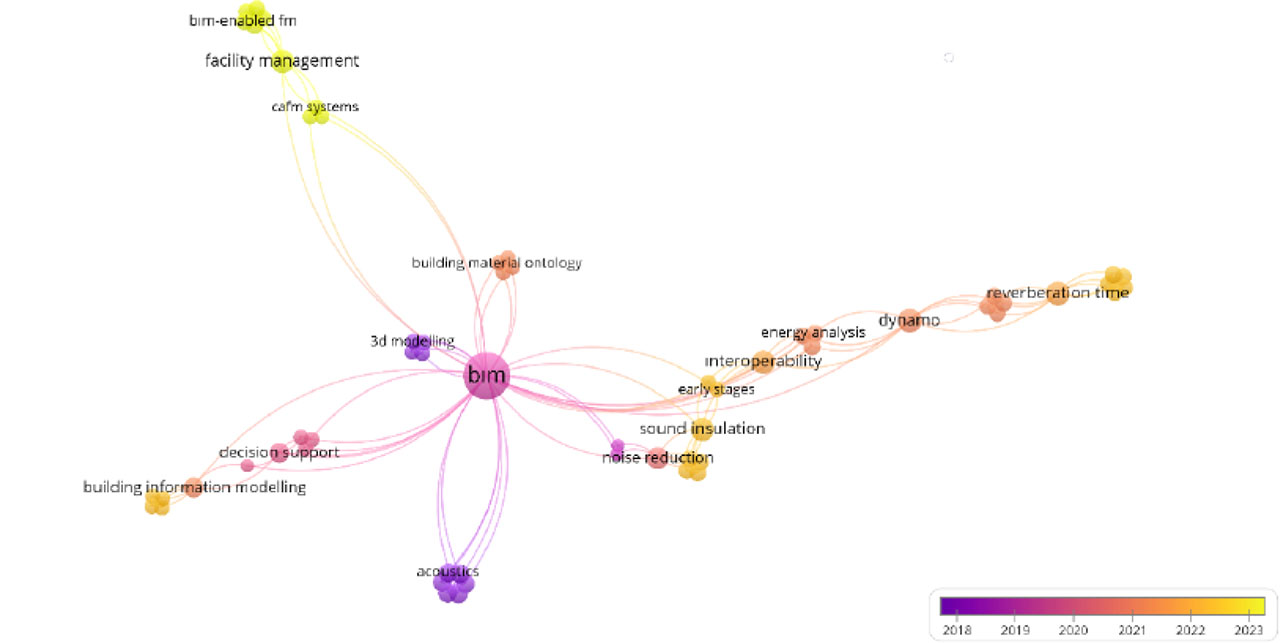
Figure 2.
Keywords and year distribution in BIM and acoustics
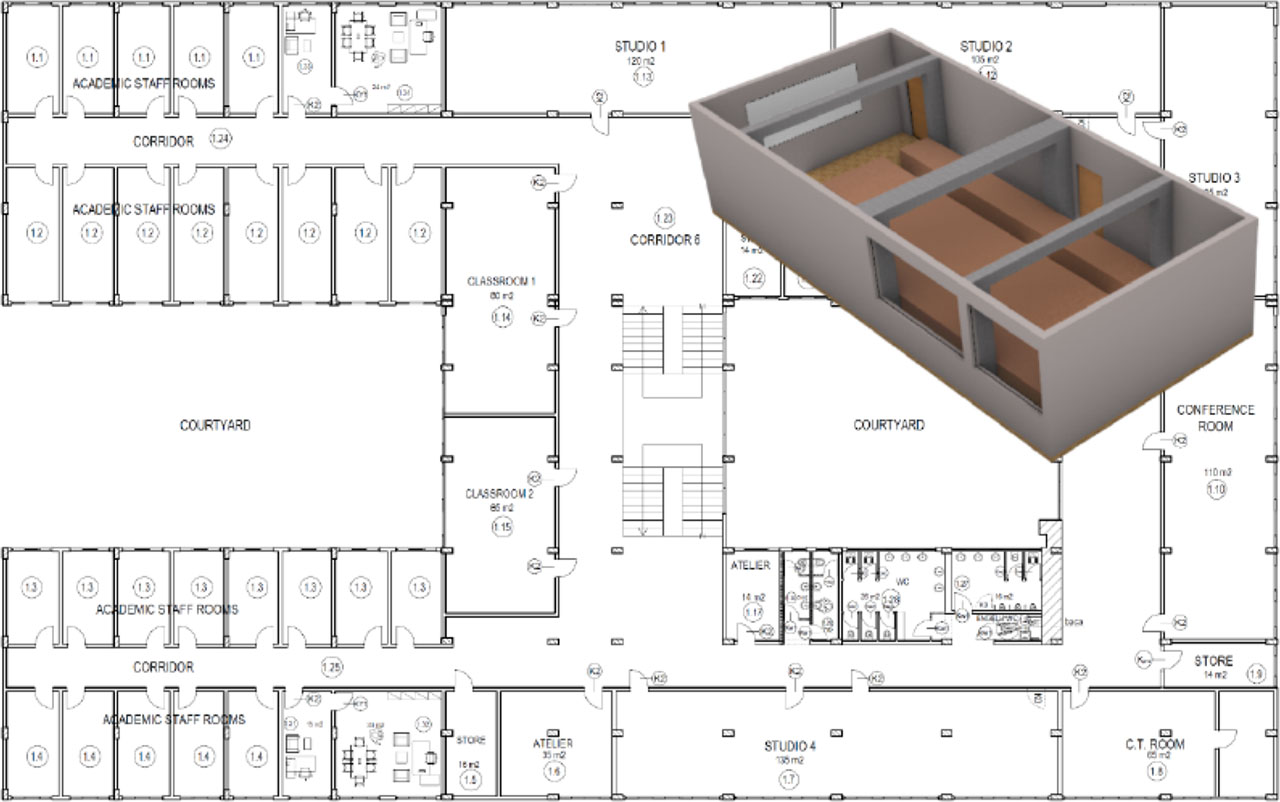
Figure 3.
Classroom on the first floor and 3D model
Table 1.
Sound absorption coefficients of current materials in the BIM tool
| Building Materials* (Current Materials) | 63 Hz | 125 Hz | 250 Hz | 500 Hz | 1.000 Hz | 2.000 Hz | 4.000 Hz | 8.000 Hz | 16.000 Hz |
|---|---|---|---|---|---|---|---|---|---|
| Floor (Ceramic) | 0,00 | 0,00 | 0,01 | 0,01 | 0,02 | 0,03 | 0,07 | 0,07 | 0,04 |
| Walls (Brick + Plaster + Paint) | 0,10 | 0,07 | 0,03 | 0,02 | 0,02 | 0,02 | 0,03 | 0,02 | 0,03 |
| Ceiling (Concrete + Plaster + Paint) | 0,01 | 0,02 | 0,02 | 0,02 | 0,03 | 0,04 | 0,05 | 0,06 | 0,06 |
| Windows (Double Glass) | 0,12 | 0,10 | 0,06 | 0,04 | 0,03 | 0,03 | 0,03 | 0,04 | 0,04 |
| Doors (Wooden) | 0,44 | 0,41 | 0,35 | 0,25 | 0,20 | 0,15 | 0,14 | 0,13 | 0,12 |
| Blackboard (Laminate Surface) | 0,19 | 0,18 | 0,14 | 0,12 | 0,10 | 0,07 | 0,09 | 0,11 | 0,11 |
| Lecturer and Students | Classroom density was entered as 80%. | ||||||||
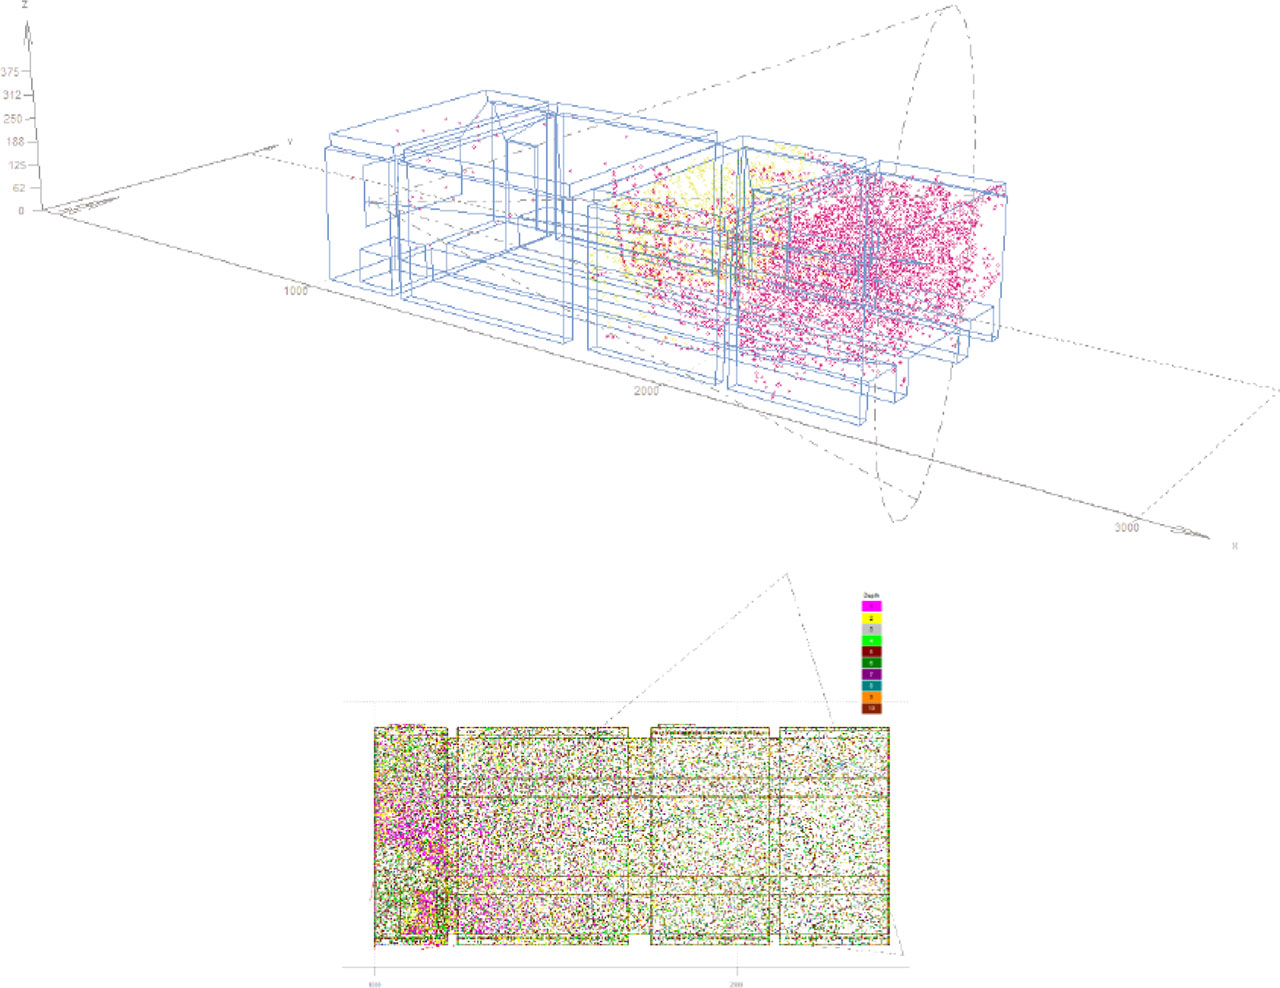
Figure 4.
Propagation of sound rays as particles, 3D model, and plan
Table 2.
Sound absorption coefficients of new materials in the BIM tool
| Building Materials* | 63 Hz | 125 Hz | 250 Hz | 500 Hz | 1.000 Hz | 2.000 Hz | 4.000 Hz | 8.000 Hz | 16.000 Hz |
|---|---|---|---|---|---|---|---|---|---|
| Walls (Sound Absorption Panel) | 0,06 | 0,06 | 0,13 | 0,47 | 0,91 | 0,94 | 0,78 | 0,74 | 0,70 |
| Ceiling (Sound Absorption Panel) | 0,45 | 0,45 | 0,80 | 0,65 | 0,72 | 0,78 | 0,74 | 0,74 | 0,68 |
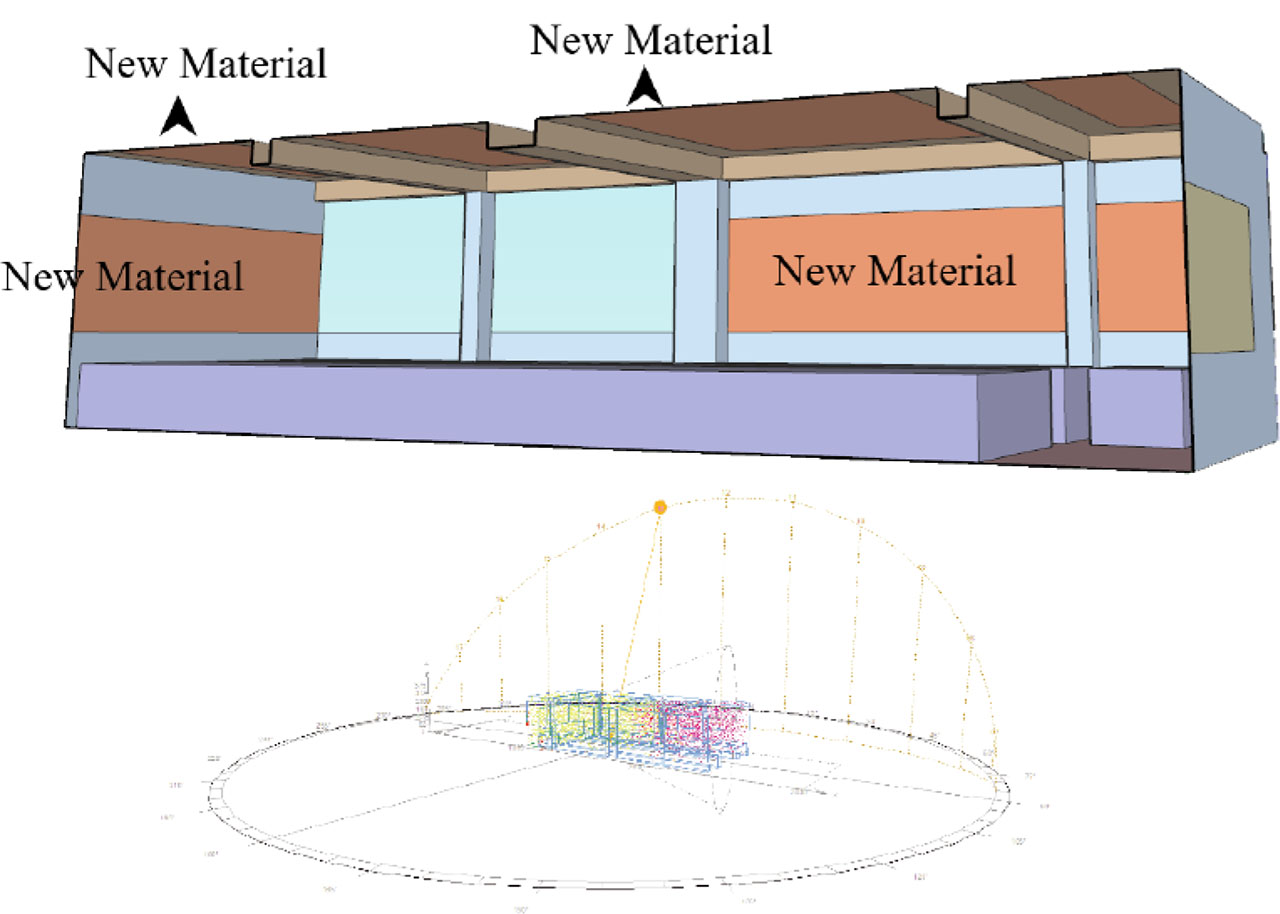
Figure 5.
Recommendations for acoustic improvements and the position of the 3D model