
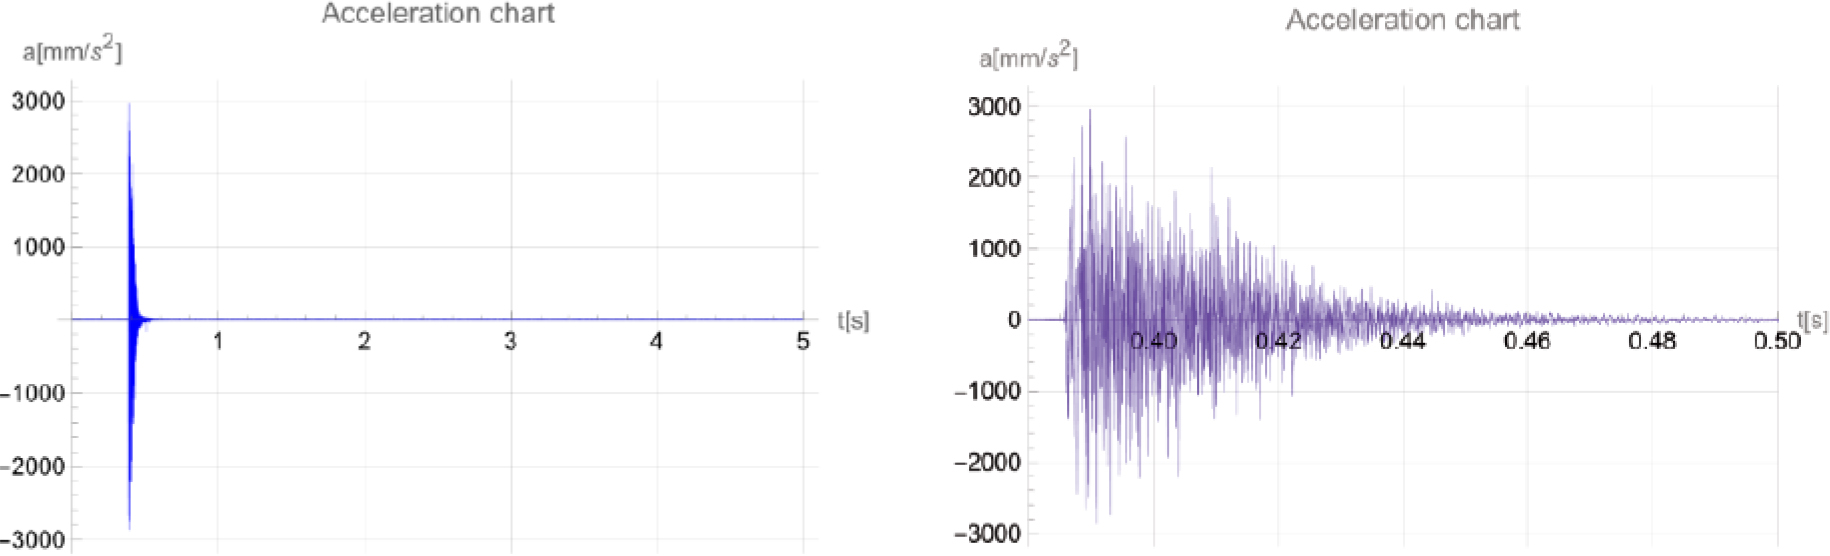
Figure 1.
Accelerogram in the entire measurement range and in the subrange of high accelerations
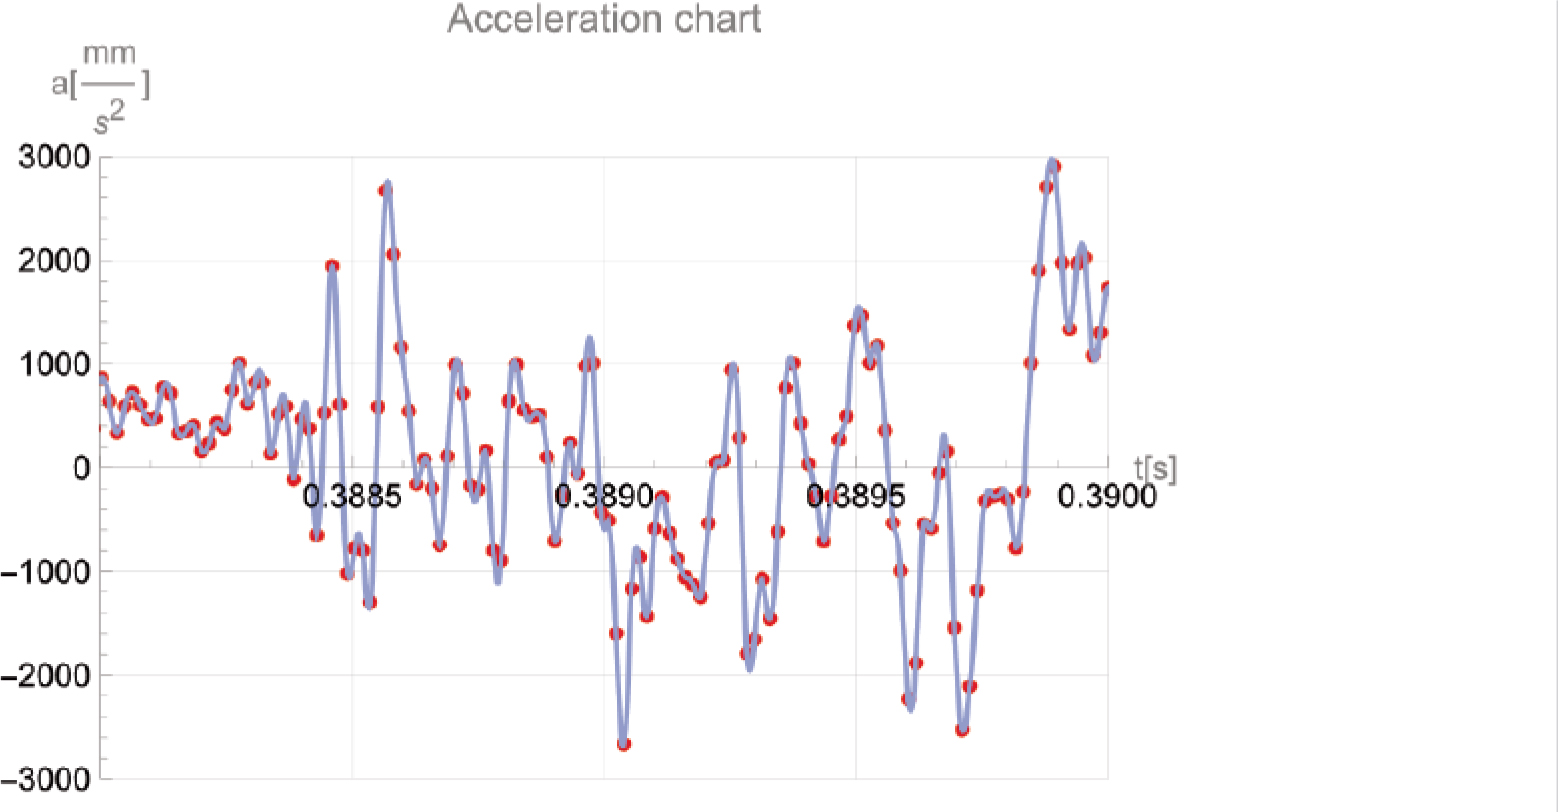
Figure 2.
Interpolation of measurement data in the range of extremal accelerations
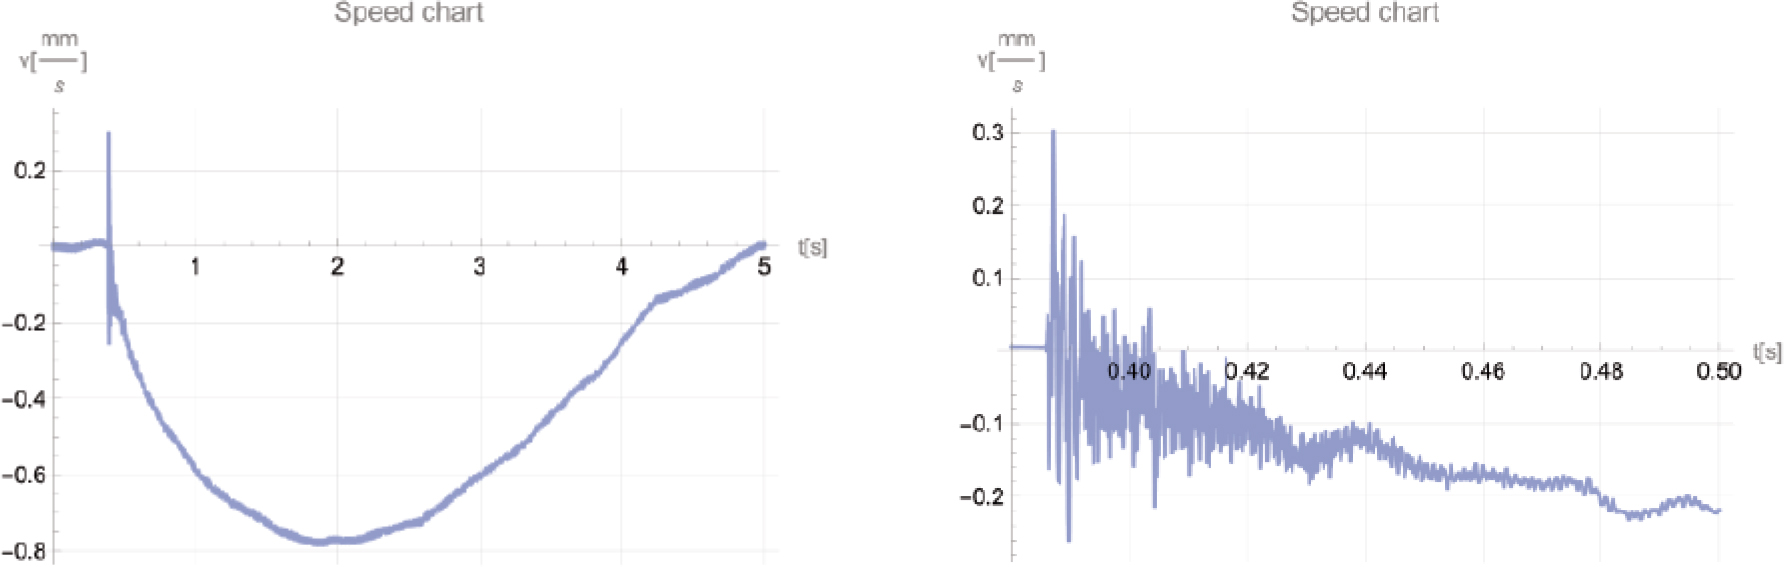
Figure 3.
Speed chart in the entire measurement range and in the subrange of high accelerations
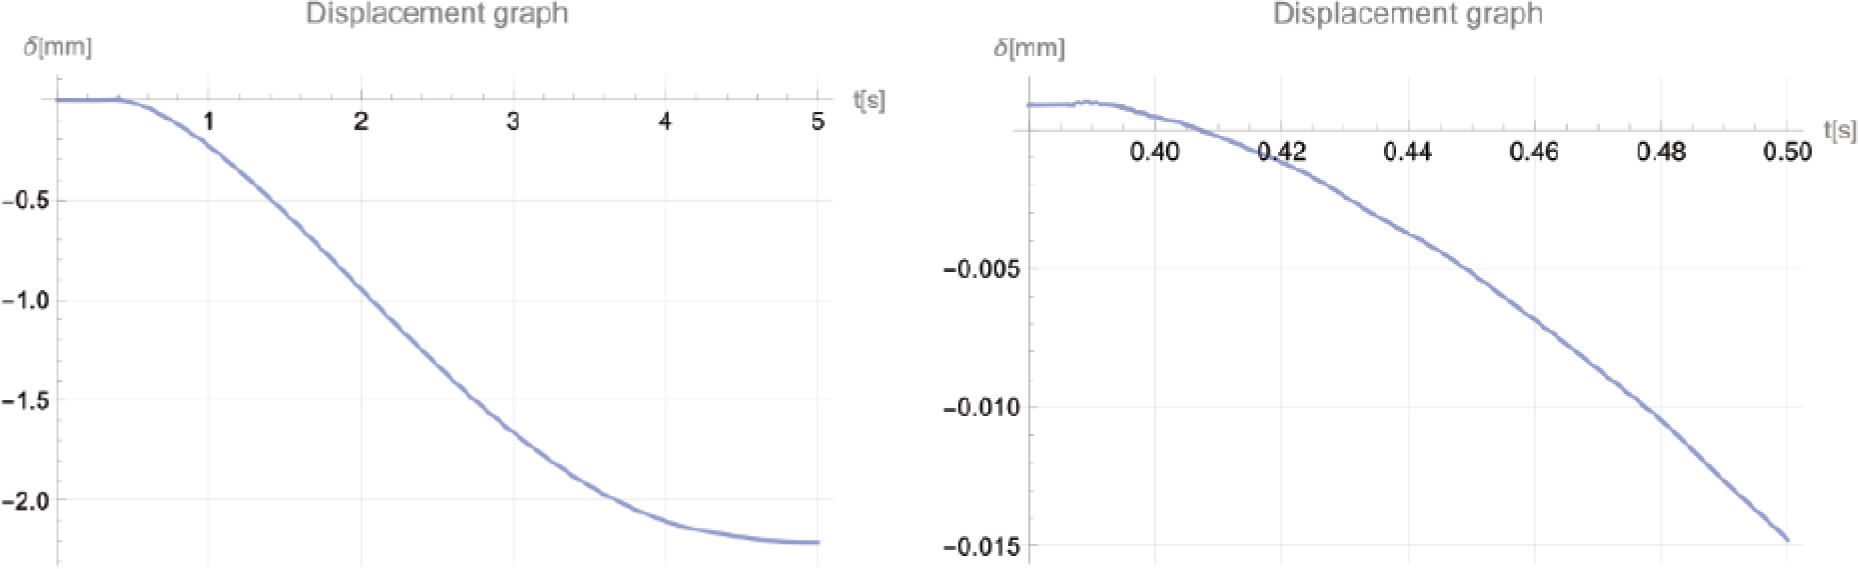
Figure 4.
Displacement graph in the entire measurement range and in the subrange of high accelerations
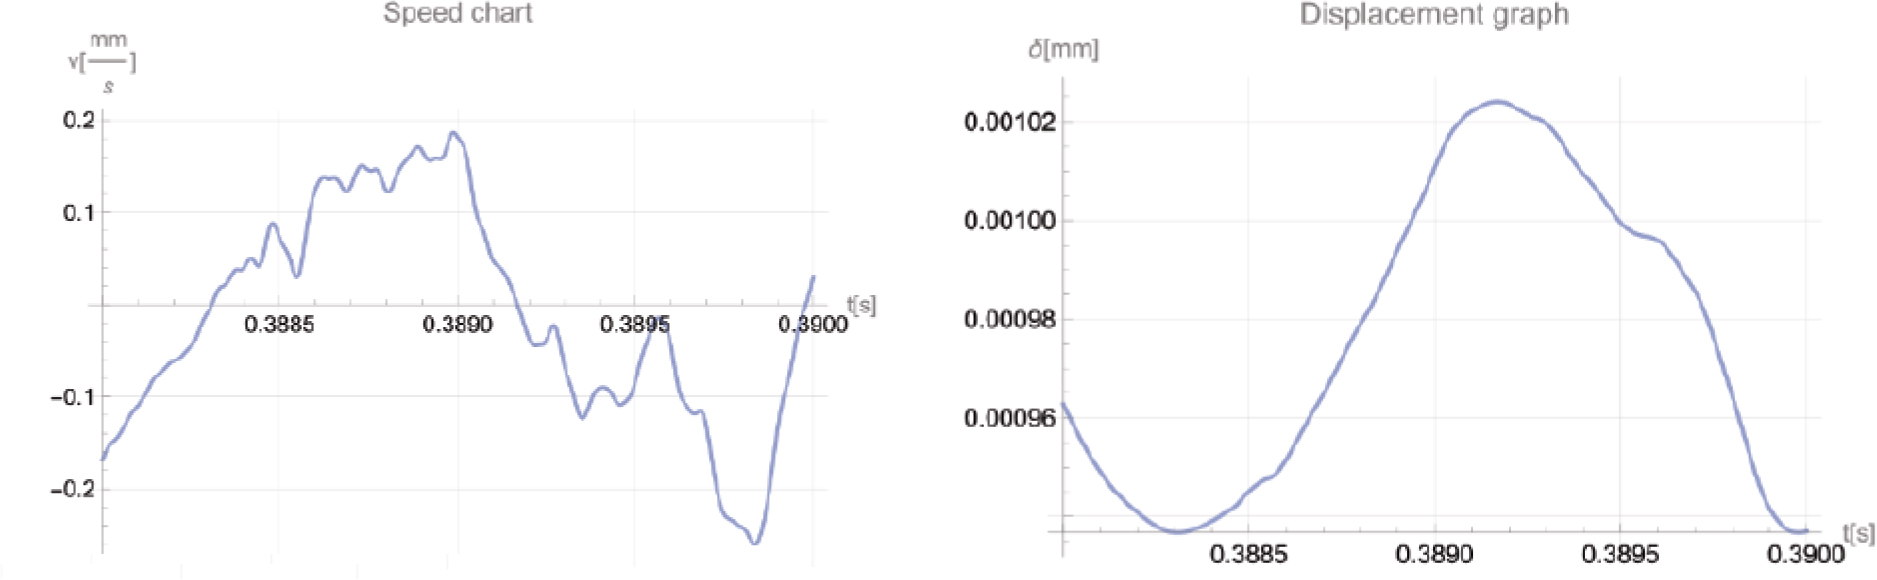
Figure 5.
Velocity and displacement diagrams of displacements in the range as in Fig. 2
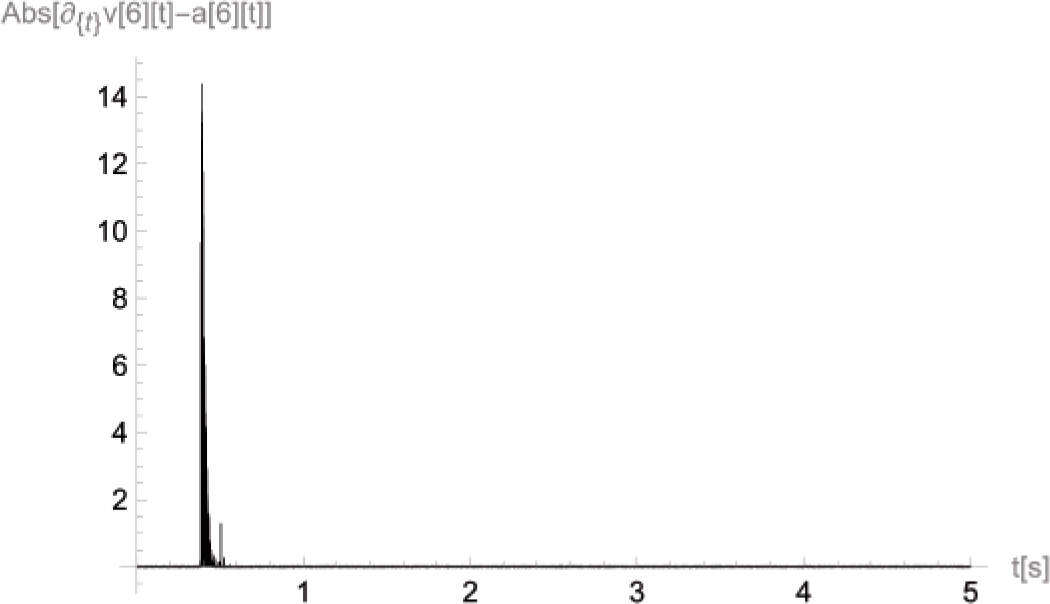
Figure 6.
Absolute error of interpolation


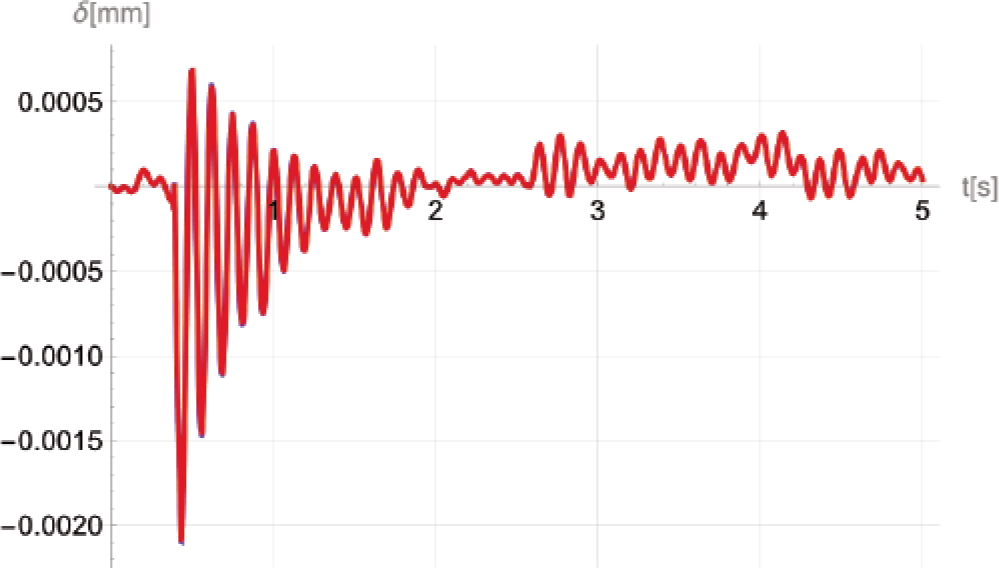
Figure 7.
Result of integration of the equation of motion