
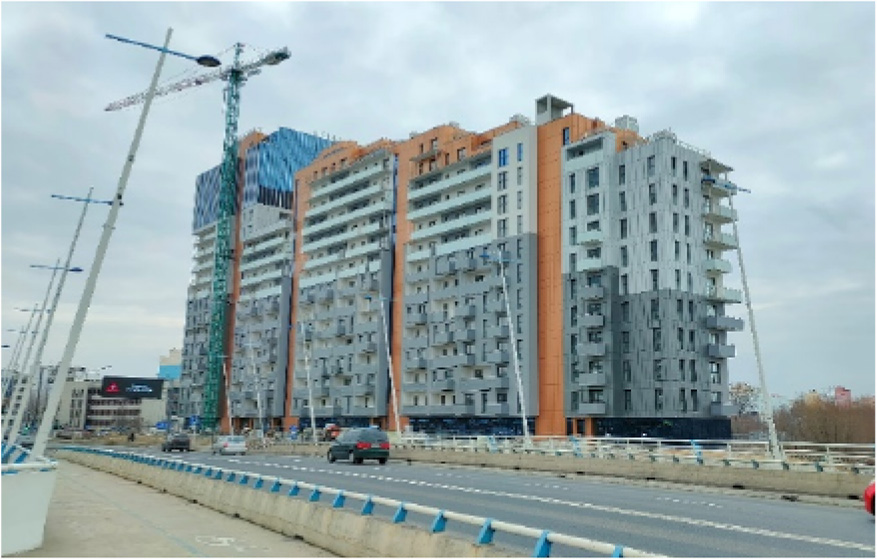
Figure 1.
The building on which the measurements were carried out
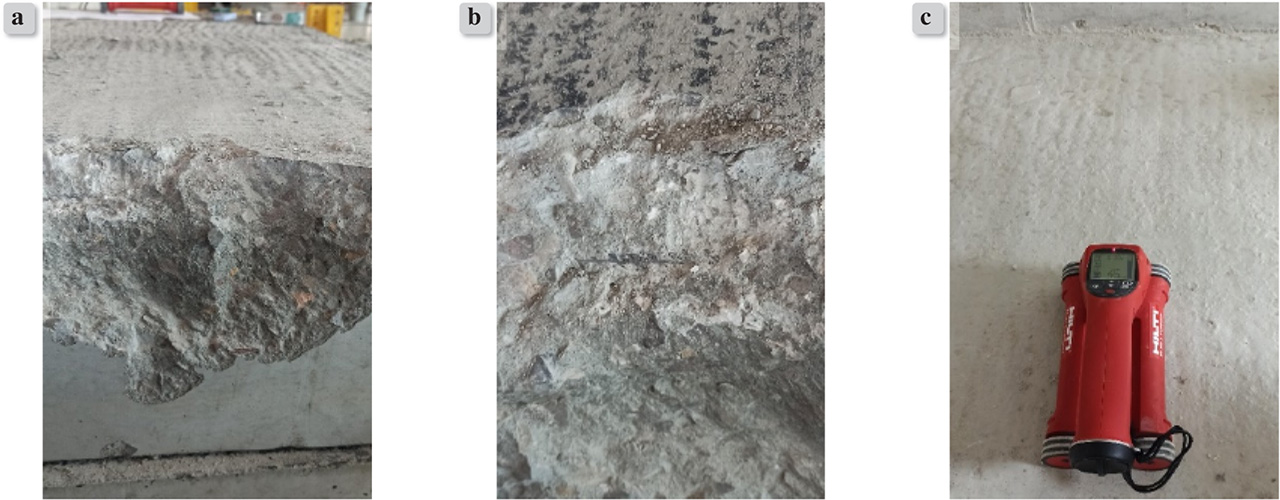
Figure 2.
Reinforcement visible after concrete stripping (a, b) and HILTI PS200 Ferroscan (c)
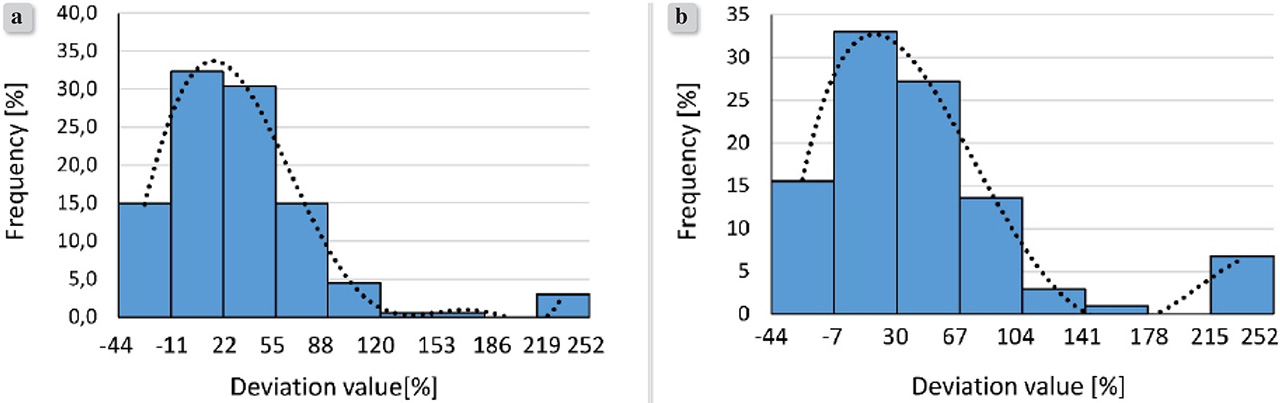
Figure 3.
Histogram of the frequency of results depending on the deviation value a) for all results, b) for results with a design reinforcement cover value of 25 mm
Table 1.
Reinforcement selected for the considered slabs
| Lp. | Span [m] | Section height [mm] | MEd [kNm] | As [cm2] |
|---|---|---|---|---|
| 1. | 3.2 | 80 | 7.55 | 3.87 (ϕ 8/13cm) |
| 2. | 4.8 | 120 | 17.00 | 5.03 (ϕ 8/10cm) |
| 3. | 7.2 | 180 | 38.24 | 6.54 (ϕ 10/12cm) |
| 4. | 8.0 | 200 | 47.21 | 7.14 (ϕ 10/11cm) |
Table 2.
Parameters of random variables
| Lp. | Variable | Mean value | Standard deviation | Distribution |
|---|---|---|---|---|
| 1. | fc | 33 MPa | 4.86 MPa | lognormal |
| 2. | fy | 535.2 MPa | 42.8 MPa | lognormal |
| 3. | g | 1.27 N/mm | 0.08 N/mm | normal |
| 4. | p | 1.87 N/mm | 0.56 N/mm | normal |
| 5. | c | 36.51 mm | 16.1 mm | lognorma |
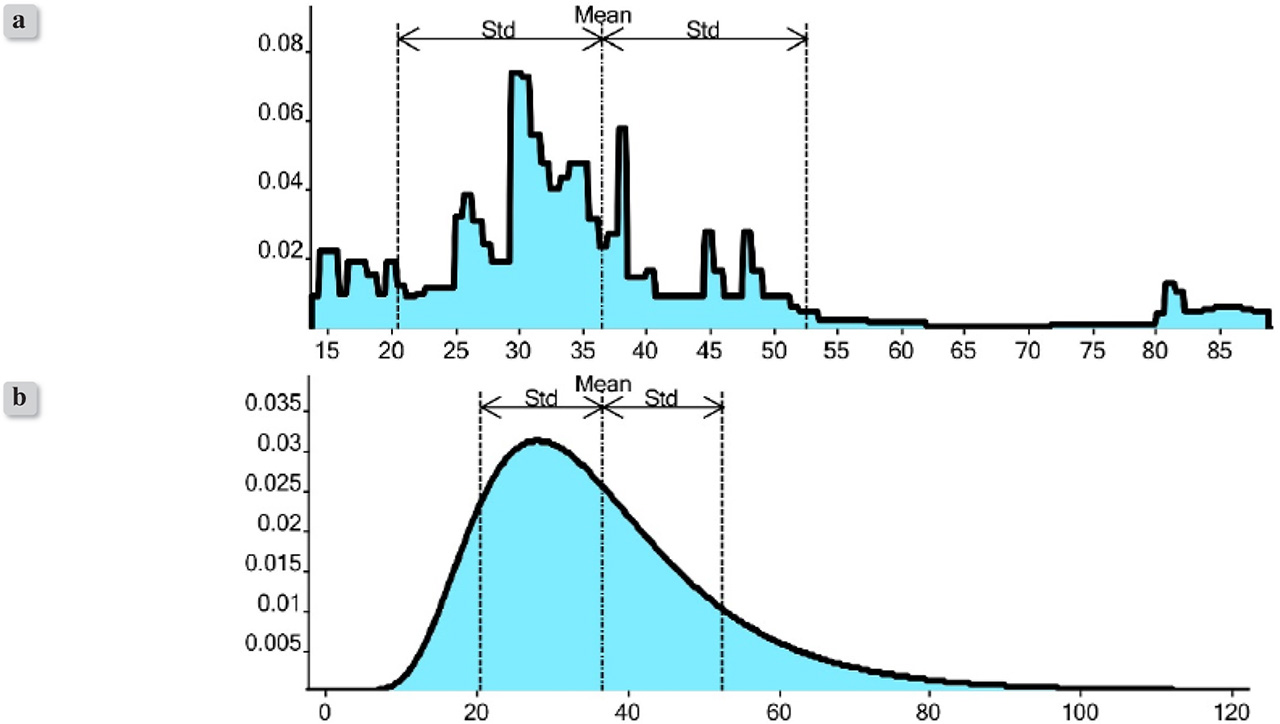
Figure 4.
a) Histogram taking into account the measured values, b) Log-normal distribution fitted on the basis of the measured values
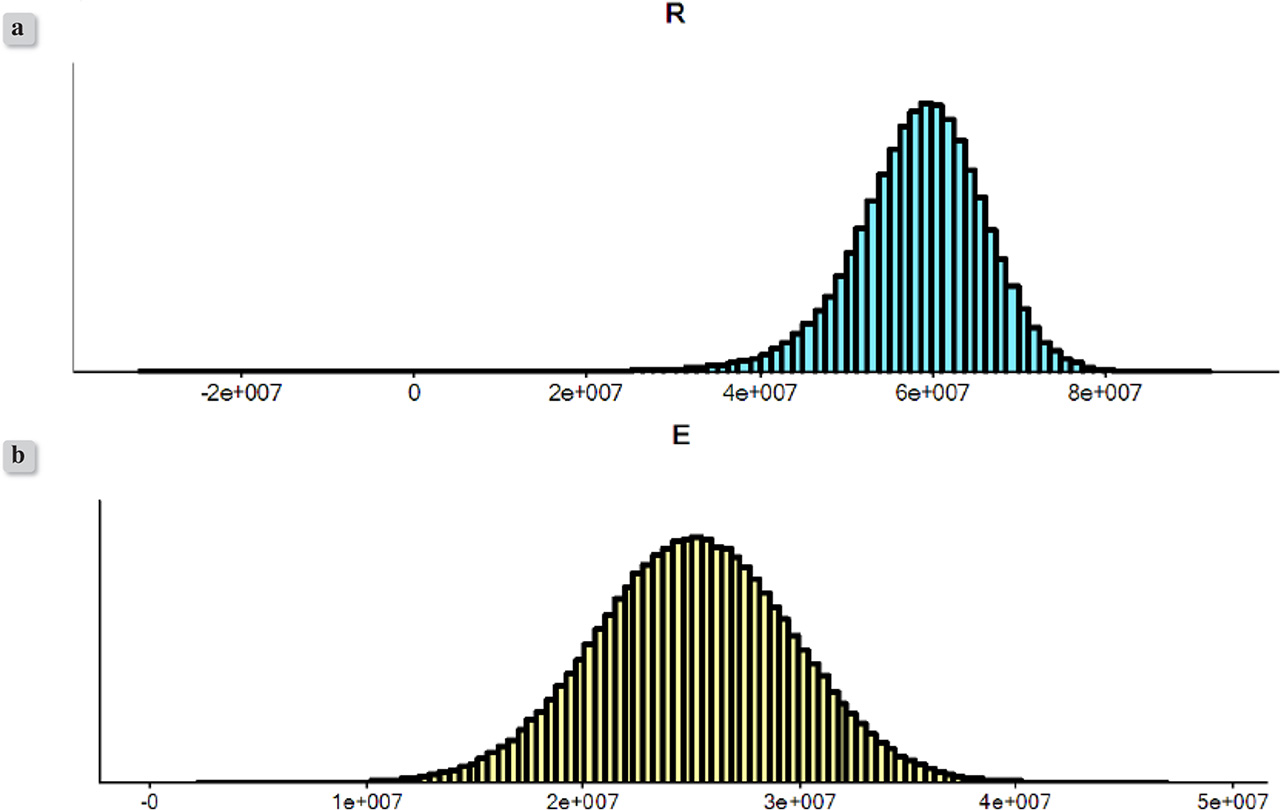
Figure 5.
a) Distribution of the slab resistance, b) distribution of the effect of actions
Table 3.
Determined failure probability and reliability index values for assumed slab thicknesses.
| Lp. | Slab thickness [mm] | β | Pf |
|---|---|---|---|
| 1. | 80 | 1.01 | 0.16 |
| 2. | 120 | 2.29 | 10.9·10−3 |
| 3. | 180 | 3.43 | 2.97·10−4 |
| 4. | 200 | 3.74 | 9.34·10−5 |
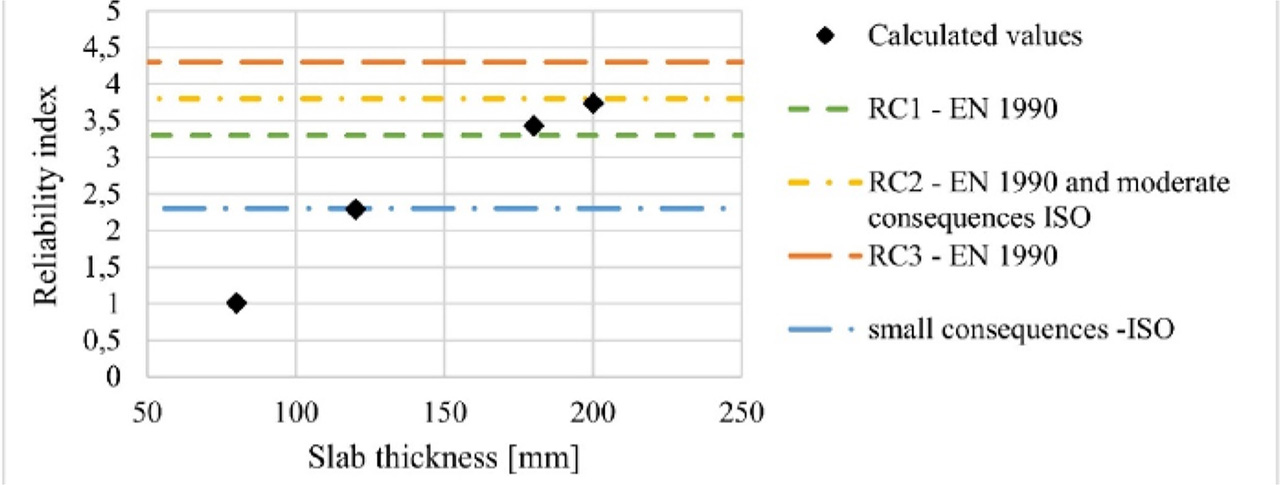
Figure 6.
Comparison of calculated reliability index values with standard values