
Table 1.
Chemical and phase composition of tested fly ash (FA)
| Phase-mineral composition (%) | Chemical composition (%) | ||
|---|---|---|---|
| SiO2 | 43.28 | Si | 22.37 |
| Al2O3 | 31.81 | Al | 15.80 |
| Fe2O3 | 1.82 | C | 3.49 |
| CaO | 1.10 | K | 2.46 |
| MgO | 2.16 | Fe | 1.87 |
| K2O | 3.42 | Mg | 0.97 |
| TiO2 | 0.63 | Ca | 0.81 |
| LOI | 12.45 | Ti | 0.56 |
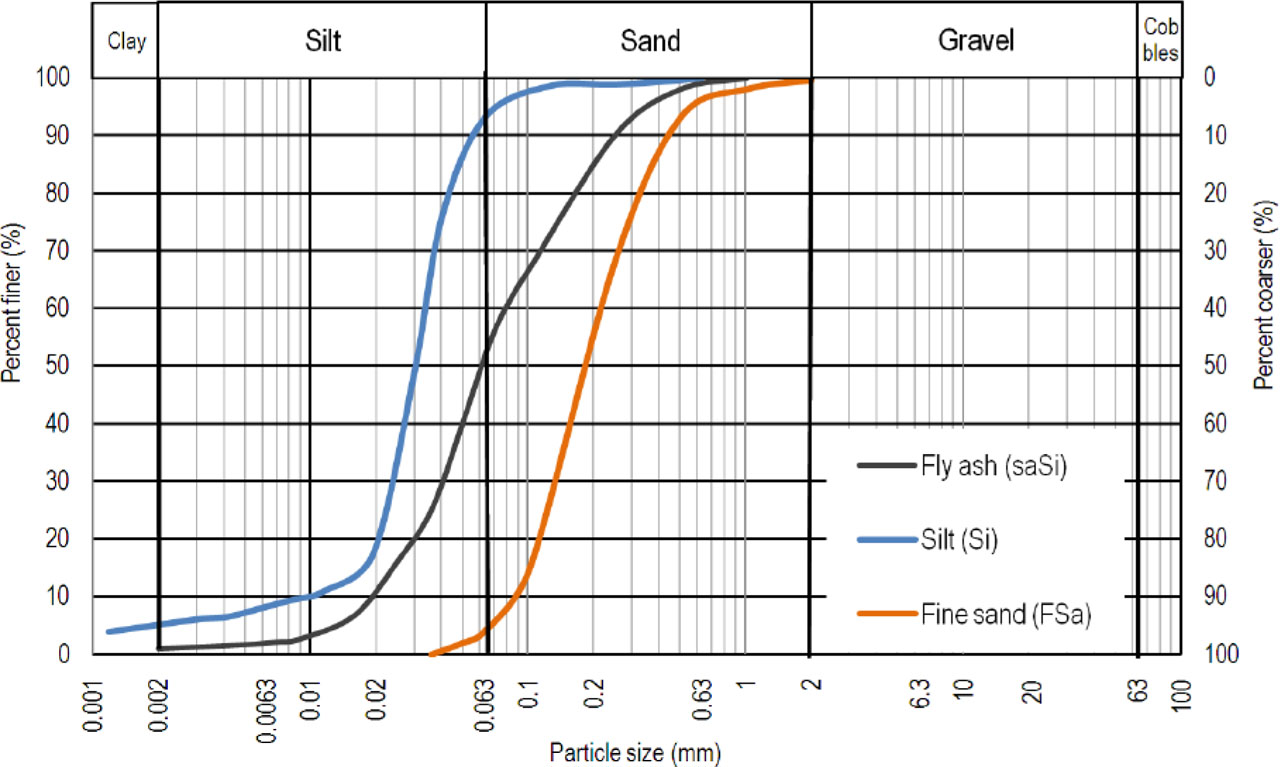
Figure 1.
Grain size distribution curves of tested materials
Table 2.
The parameters of tested soils
| Material | D50 (mm) | ρs (g/cm3) | Ip (%) |
|---|---|---|---|
| Silt (Si) | 0.031 | 2.67 | 7.7 |
| Fine sand (FSa) | 1.90 | 2.65 | – |
| Fly ash (FA) | 0.060 | 2.18 | – |
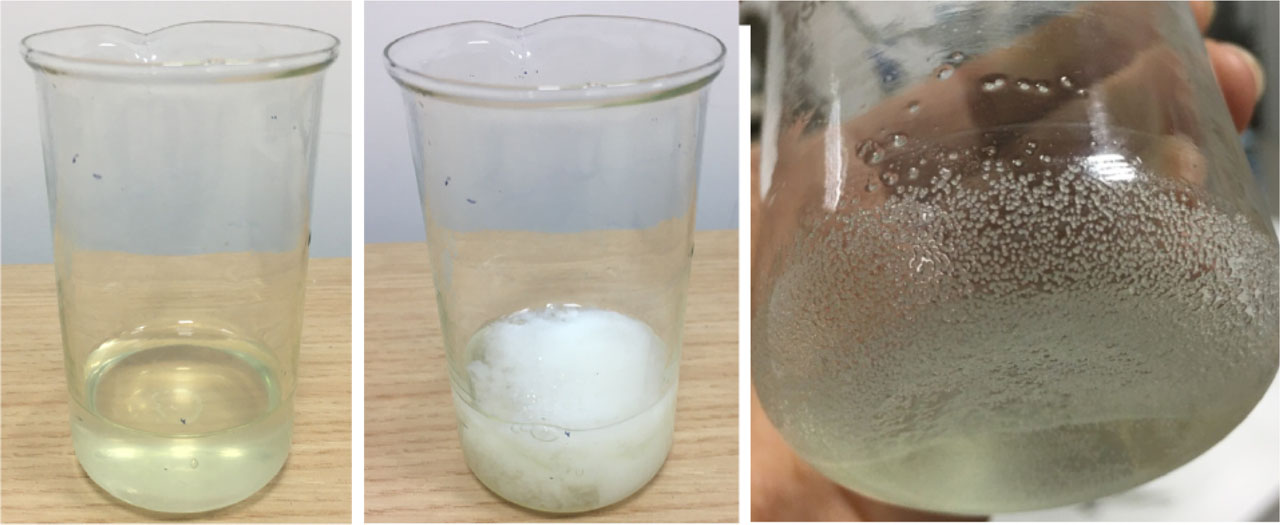
Figure 2.
The process of biomineralization in a flask: a) bacterial solution, b) bacterial solution right after CaCl2-urea solution added, c) calcite crystals precipitated at the bottom of the flask, where bacterial solution and cementation solution were mixed (after a few days of storing at room temperature)
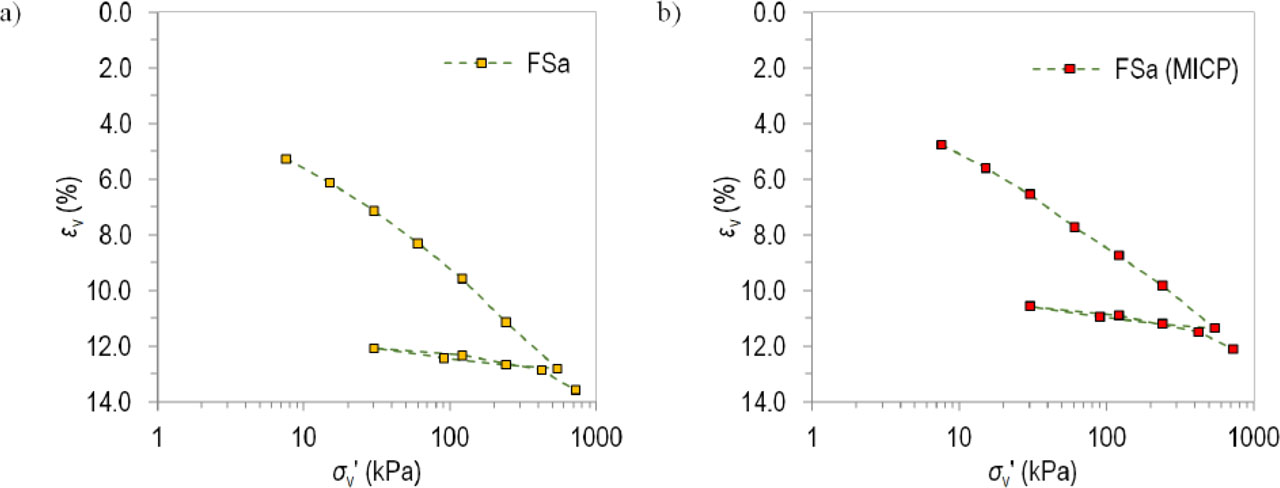
Figure 3.
Results of oedometric tests of: a) untreated fine sand (FSa), b) fine sand (FSa) improved with the MICP method
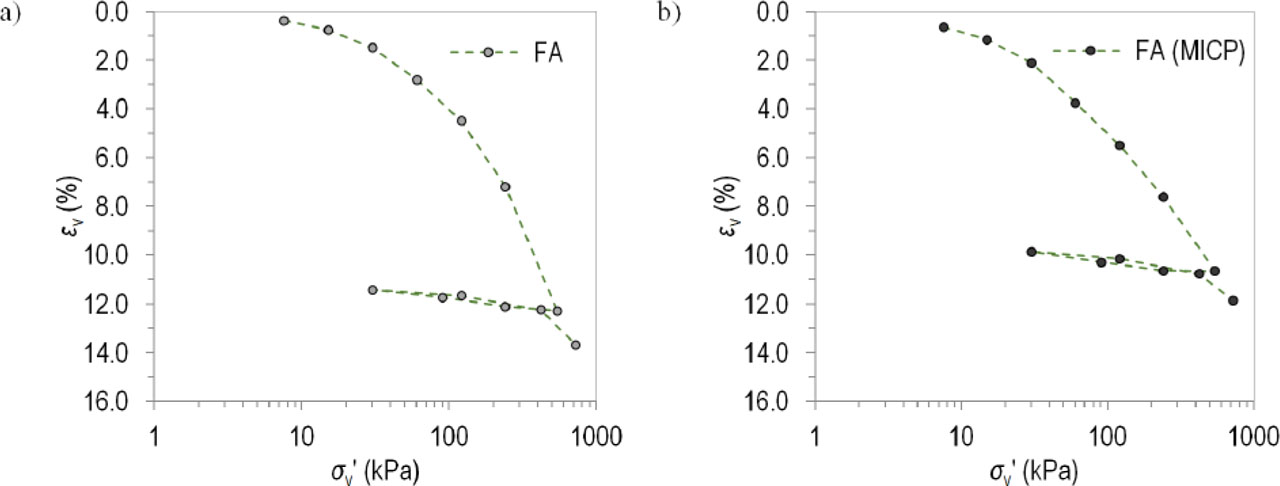
Figure 4.
Results of oedometric tests of: a) untreated fly ash (FA), b) fly ash (FA) improved with the MICP method
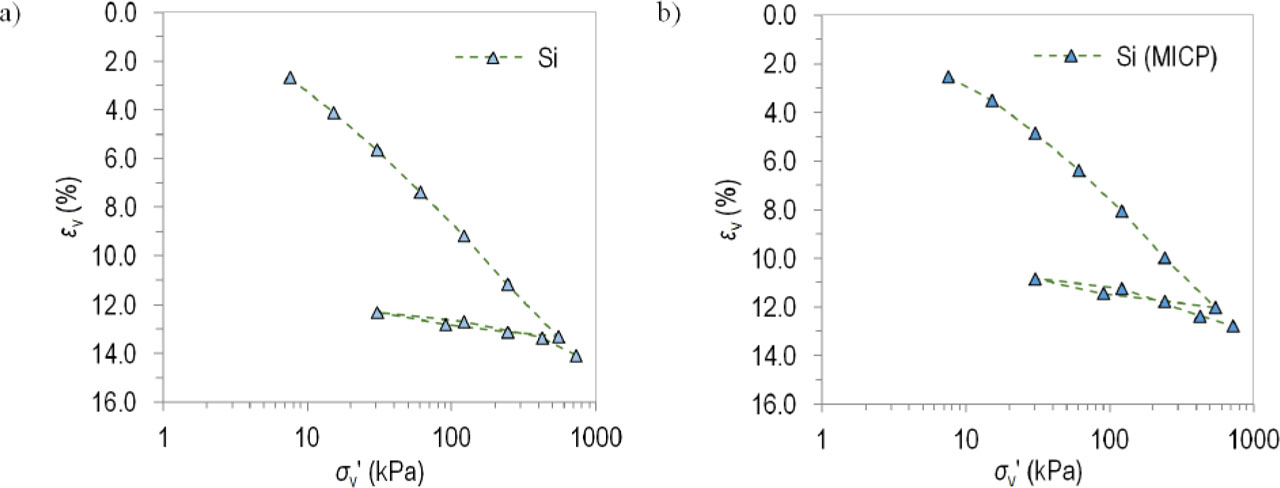
Figure 5.
Results of oedometric tests of: a) untreated silt (Si), b) silt (Si) improved with the MICP method