
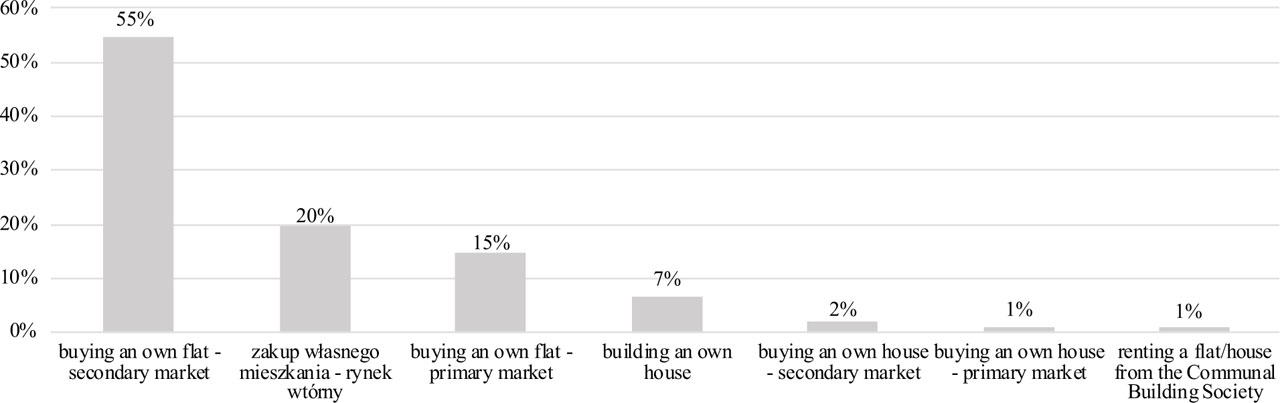
Figure 1
Housing plans of young people within 3 years after completion of studies (graduation). A. Gawlak
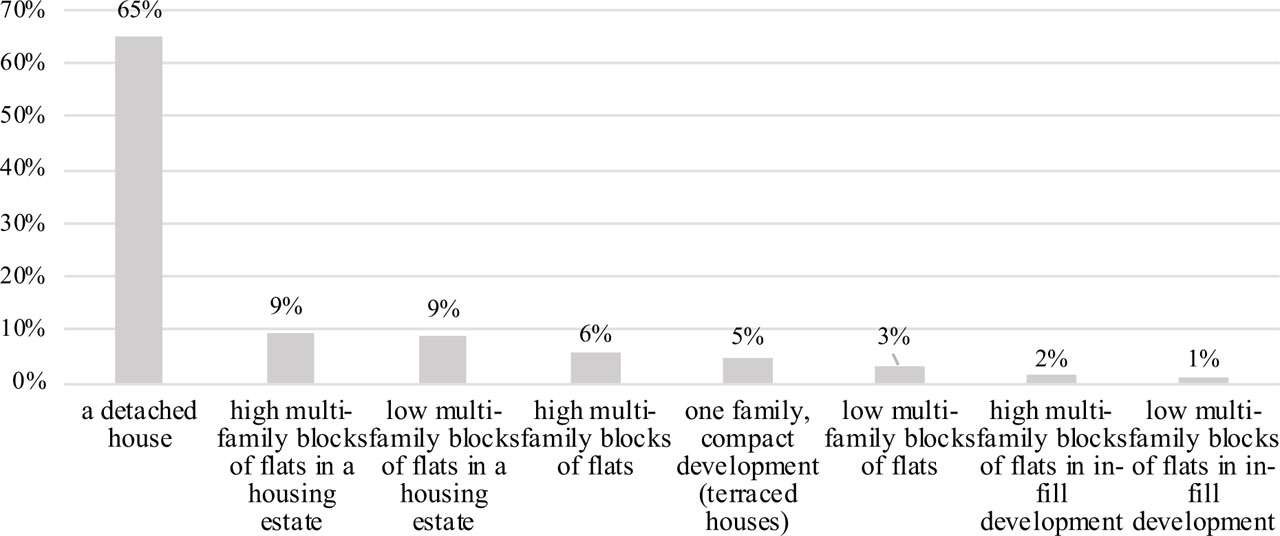
Figure 2
Preferred forms of residential development. Prepared by: A. Gawlak
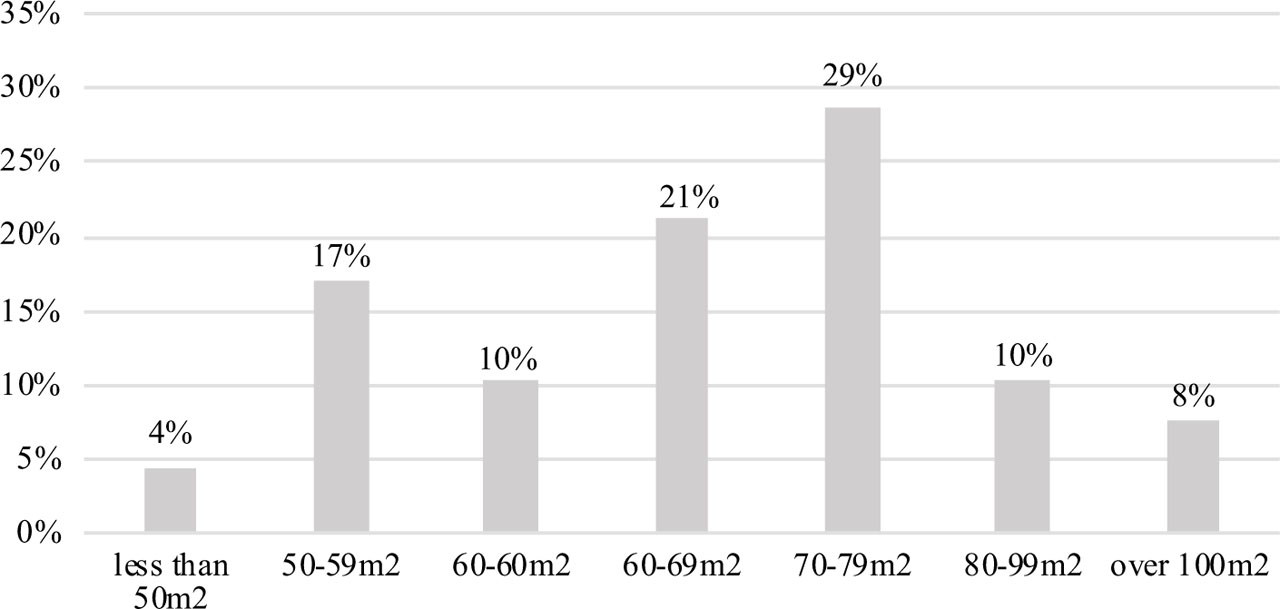
Figure 3
Optimum flat size as per the preferences of young people. A. Gawlak
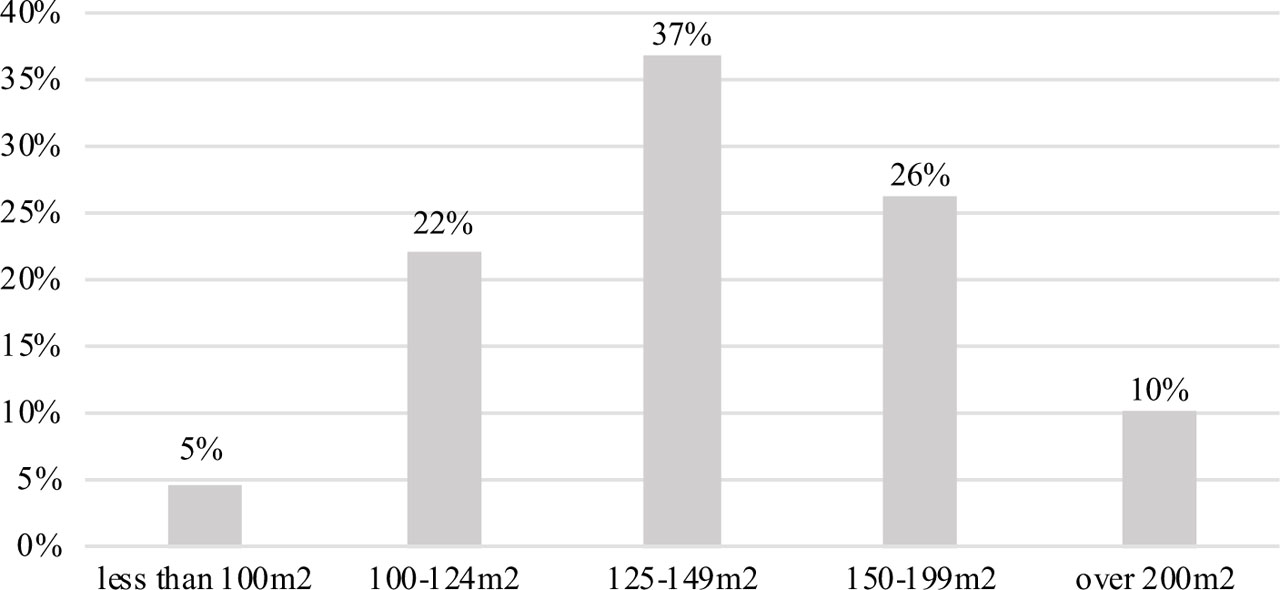
Figure 4
Optimum house size as per the preferences of young people. A. Gawlak
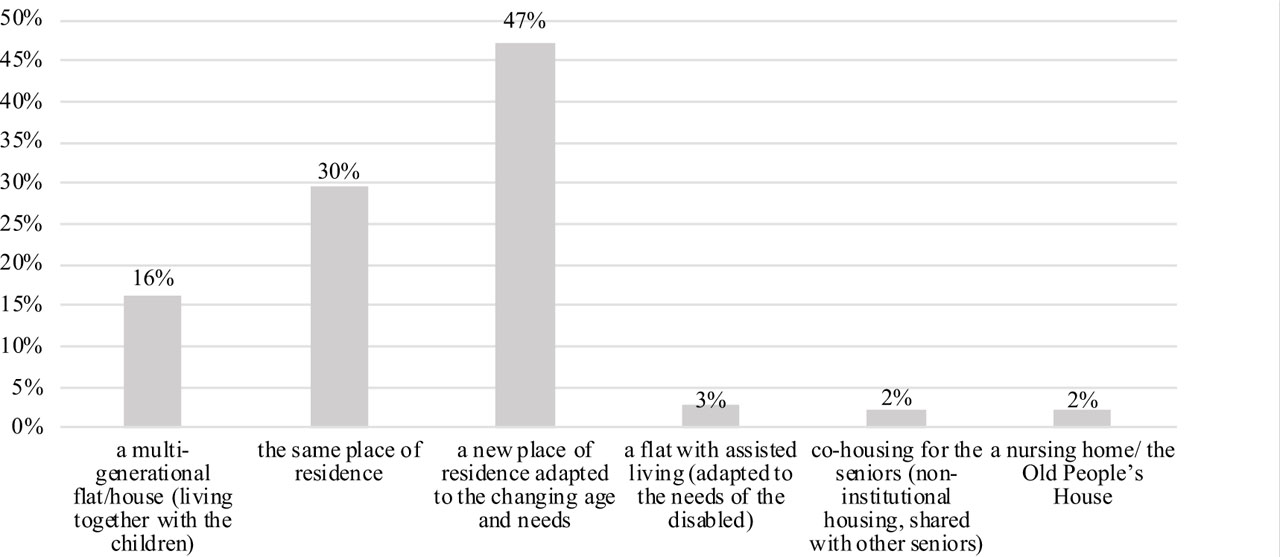
Figure 5
Expectations of young people regarding their place of residence at an old age. A. Gawlak
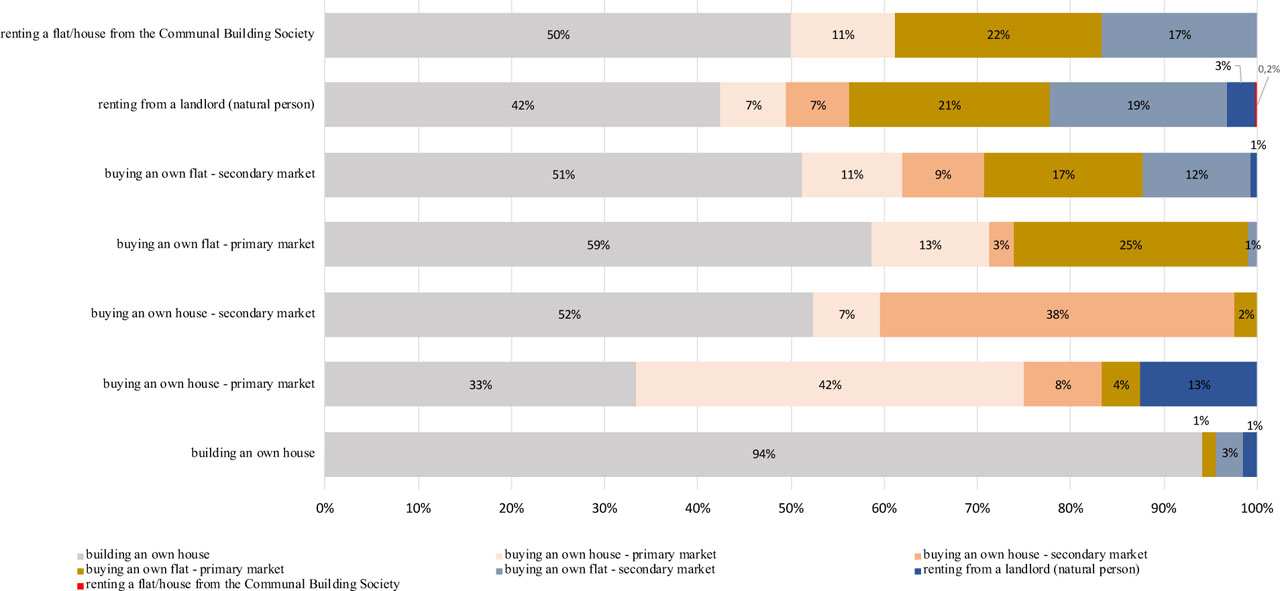
Figure 6
Interdependencies between housing plans in the 3 year period after completion of studies and housing plans in the long term perspective. A. Gawlak
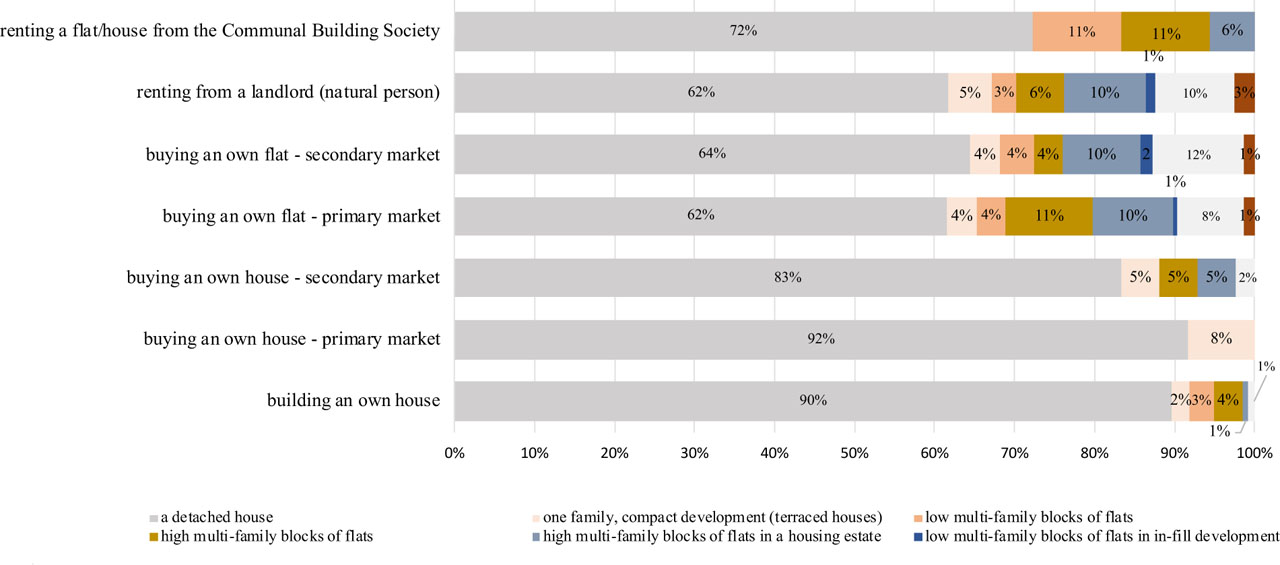
Figure 7
Interdependencies between housing plans in the 3 year period after completion of studies and preferred forms of residential development. A. Gawlak
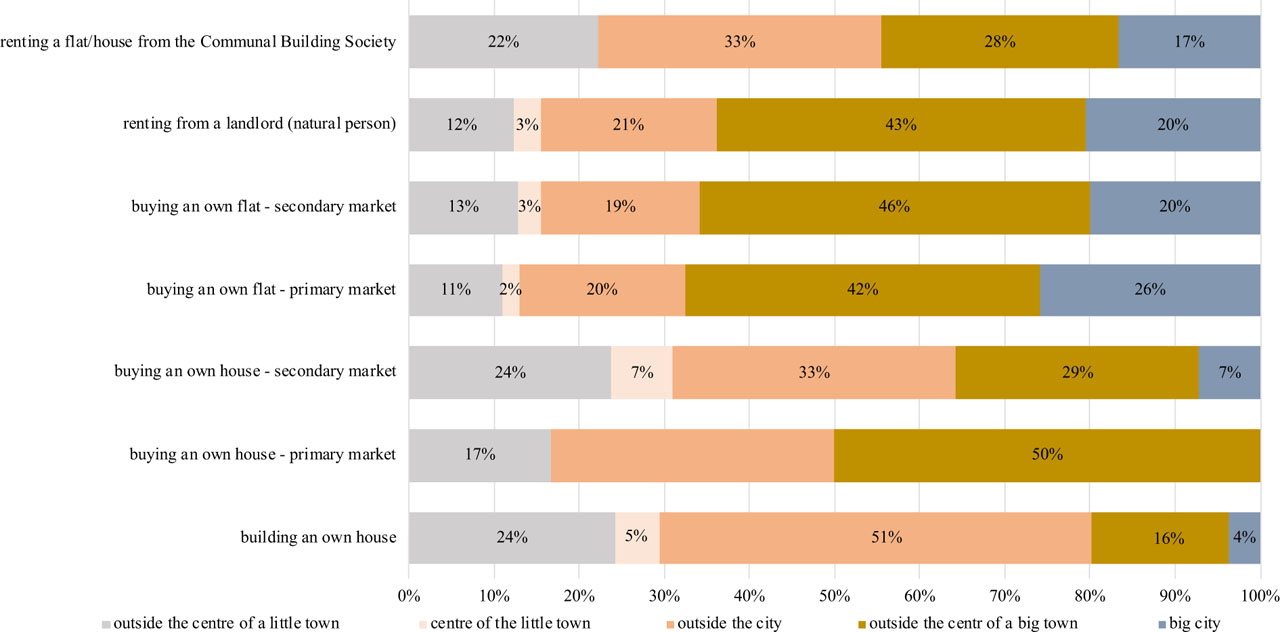
Figure 8
Interdependencies between housing plans in the 3 year period after completion of studies and preferred location of the place of residence. A. Gawlak
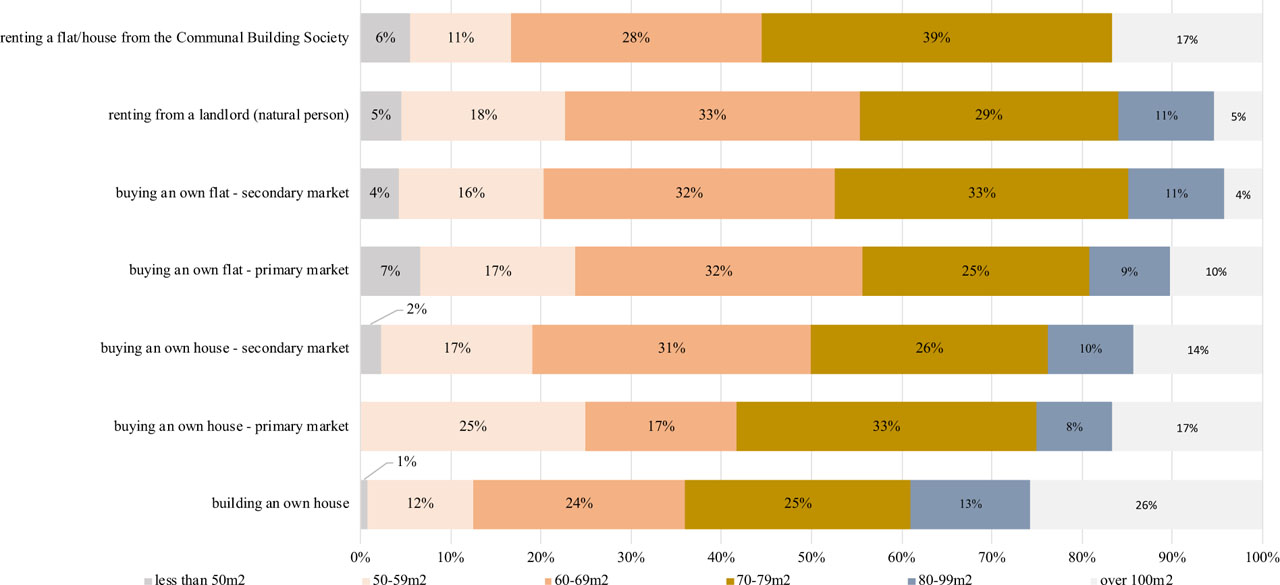
Figure 9
Interdependencies between housing plans in the 3 year period after completion of studies and the preferred flat size. A. Gawlak
Table 1
Comparative analysis of the results of the research conducted in 2007, 2011 and 2020 (question 1)
| Indicate your place of residence during your studies | year | p | |||
|---|---|---|---|---|---|
| 2021 n=2034 | 2011 n=516 | 2007 n=617 | 2021–2011 | 2021–2007 | |
| with the family members | 2% | 1% | 2% | 0.1268 | 1.0000 |
| in an independently rented flat | 3% | 4% | 13% | 0.2492 | <0.0001 |
| in the own flat | 7% | 11% | 13% | 0.0025 | <0.0001 |
| in a dormitory | 14% | 10% | 11% | 0.0165 | 0.0546 |
| in a rented room | 17% | 10% | 11% | 0.0001 | 0.0003 |
| with parents | 25% | 51% | 47% | <0.0001 | <0.0001 |
| in a rented flat shared with other students | 31% | 13% | 0% | <0.0001 | <0.0001 |
| other | - | 0.4% | 3% | 0.0043 | <0.0001 |
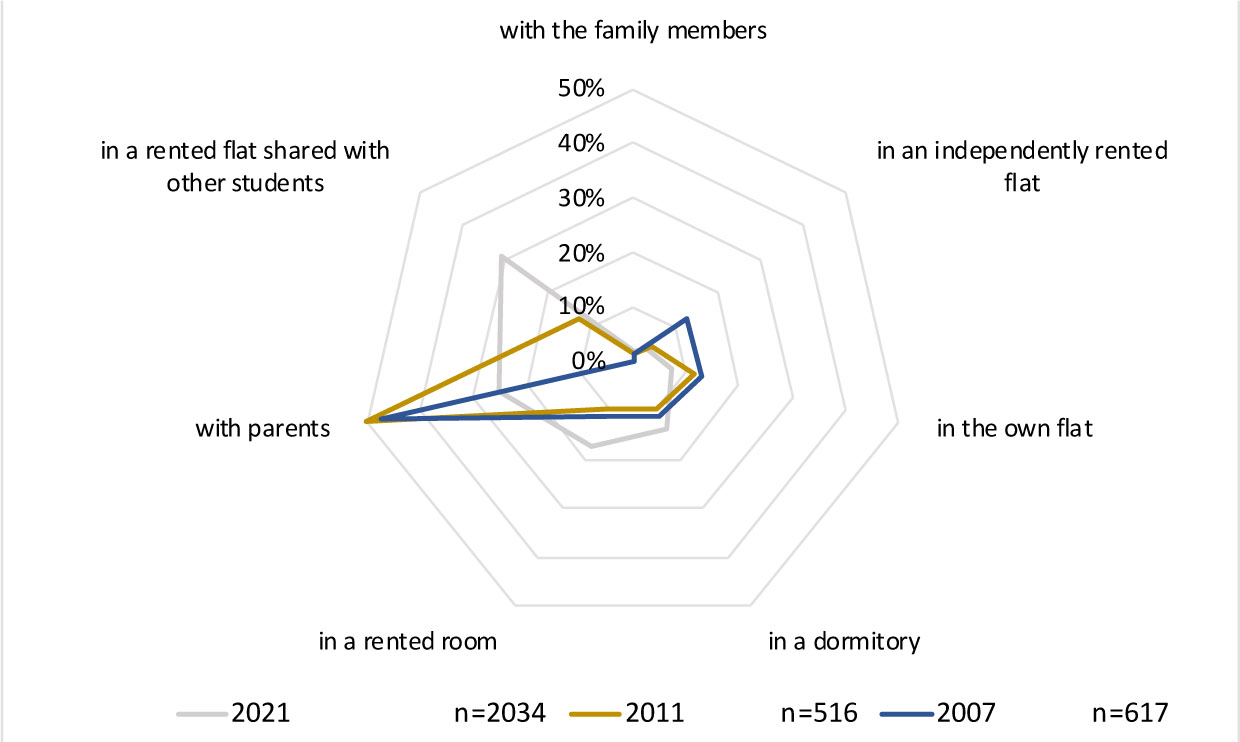
Figure 10
Comparative analysis of the results of the research conducted in 2007, 2011 and 2020 (question 1). A. Gawlak
Table 2
Comparative analysis of the results of the research conducted in 2007, 2011 and 2020 (question 4)
| Indicate which, in your opinion, is the optimum size of a flat | year | p | |||
|---|---|---|---|---|---|
| 2021 n=2034 | 2011 n=516 | 2007 n=617 | 2021–2011 | 2021–2007 | |
| less than 50 m2 | 4% | 6% | 7% | 0.0480 | 0.0020 |
| 50–59 m2 | 17% | 13% | 14% | 0.0276 | 0.0772 |
| 60–69 m2 | 32% | 23% | 20% | 0.0001 | <0.0001 |
| 70–79 m2 | 29% | 17% | 18% | <0.0001 | <0.0001 |
| 80–99 m2 | 10% | 21% | 20% | <0.0001 | <0.0001 |
| over 100 m2 | 8% | 21% | 21% | <0.0001 | <0.0001 |
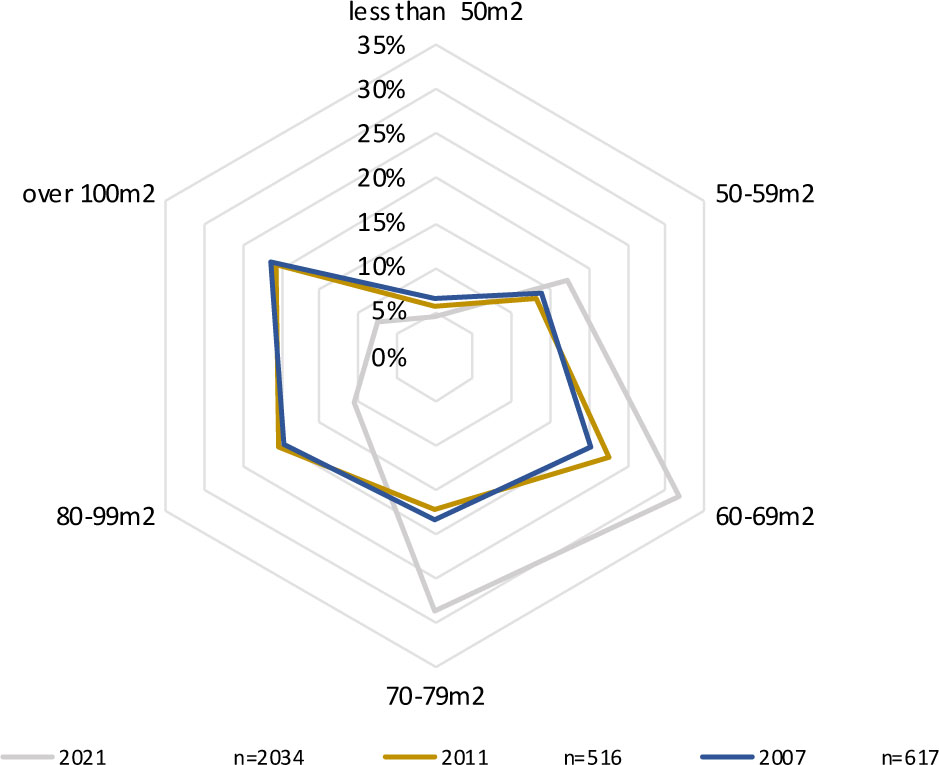
Figure 11
Comparative analysis of the results of the research conducted in 2007, 2011 and 2020 (question 4). A. Gawlak