
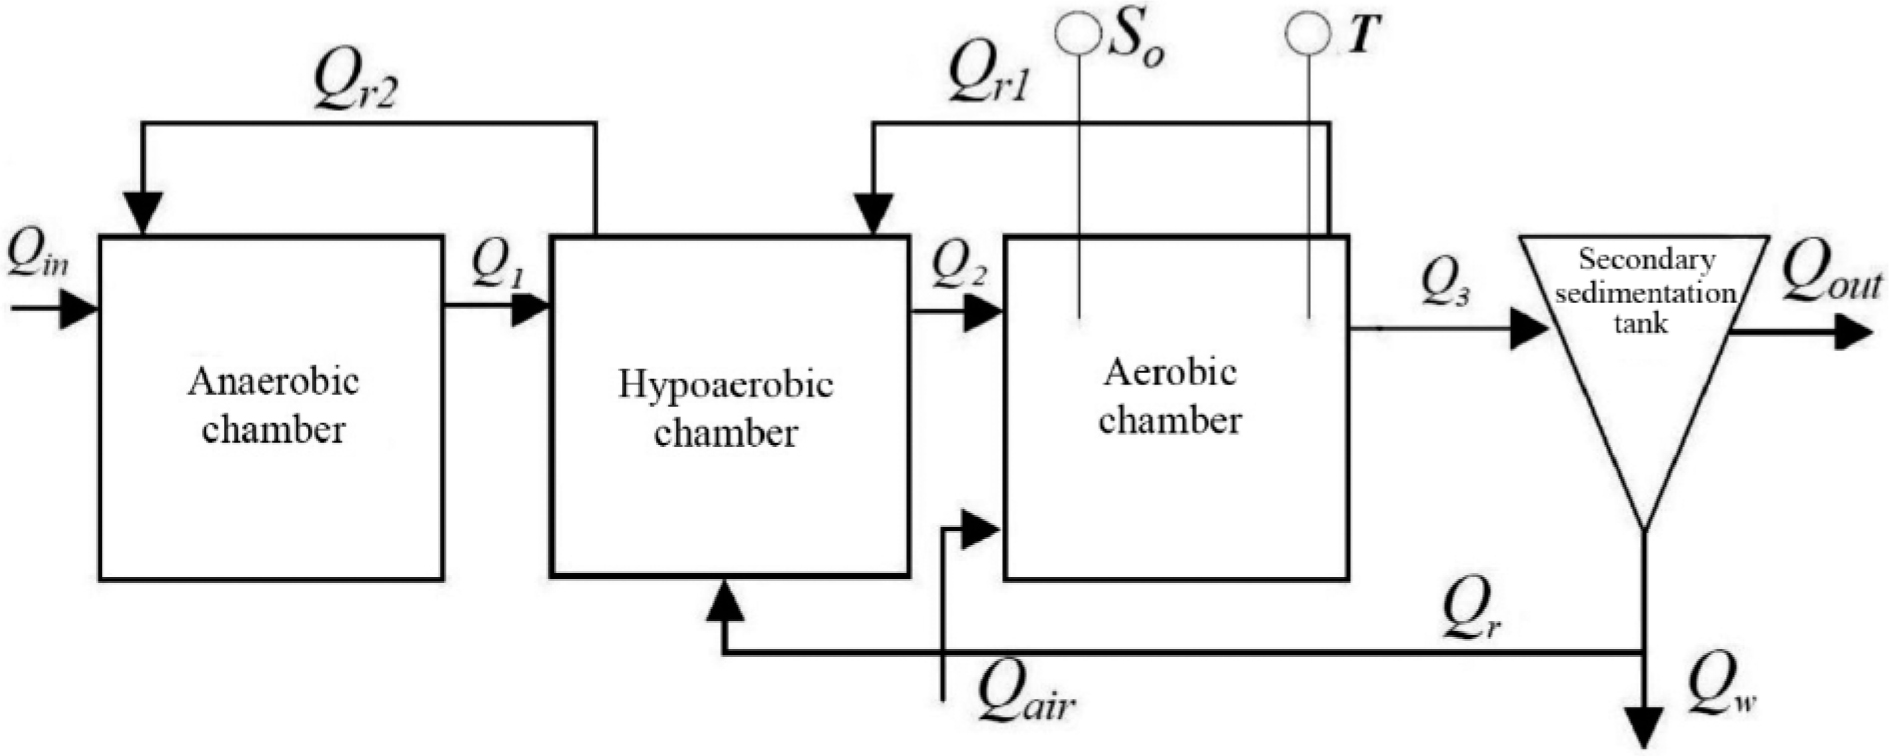
Figure 1.
Biological reactor with the system of internal and external
Table 1.
Monthly concentrations of pollutants in untreated and treated sewage in
| Month | Total nitrogen mgN·dm-3 | BOD5 mgO2·dm-3 | CODCr mgO2·dm-3 | Total phosphorus mgP·dm-3 | Total suspension [mg·dm-3] | ||||||||||
|---|---|---|---|---|---|---|---|---|---|---|---|---|---|---|---|
| UW | PTE | TW | UW | PTE | TW | UW | PTE | TW | UW | PTE | TW | UW | PTE | TW | |
| January | 69.54 | 63.26 | 7.10 | 407 | 293 | 4.78 | 940 | 614 | 25.2 | 13.64 | 12.68 | 0.38 | 383 | 187 | 9.77 |
| February | 66.49 | 61.41 | 7.30 | 397 | 299 | 4.67 | 853 | 578 | 44.7 | 10.16 | 7.18 | 0.37 | 363 | 194 | 10.25 |
| March | 61.68 | 60.14 | 8.81 | 267 | 209 | 4.49 | 1109 | 829 | 42.5 | 8.51 | 7.39 | 0.39 | 435 | 178 | 10.92 |
| April | 76.33 | 72.10 | 8.54 | 322 | 276 | 4.09 | 1079 | 824 | 55.0 | 6.72 | 6.52 | 0.46 | 334 | 167 | 6.25 |
| May | 73.53 | 70.15 | 7.34 | 545 | 263 | 5.36 | 1123 | 796 | 49.5 | 5.39 | 4.83 | 0.43 | 472 | 192 | 7.15 |
| June | 44.76 | 39.73 | 4.75 | 310 | 245 | 3.23 | 521 | 301 | 23.8 | 3.89 | 2.81 | 0.14 | 337 | 140 | 6.89 |
| July | 65.28 | 63.77 | 6.44 | 286 | 263 | 5.72 | 583 | 466 | 48.1 | 6.35 | 5.08 | 0.23 | 371 | 158 | 7.53 |
| August | 62.05 | 59.23 | 6.62 | 390 | 252 | 4.62 | 1458 | 801 | 39.0 | 7.46 | 7.10 | 0.36 | 316 | 194 | 10.42 |
| September | 60.39 | 59.90 | 5.63 | 330 | 284 | 4.14 | 720 | 531 | 32.2 | 6.78 | 6.07 | 0.41 | 343 | 203 | 10.65 |
| October | 70.62 | 60.49 | 8.62 | 356 | 268 | 5.11 | 820 | 528 | 49.3 | 9.24 | 7.70 | 0.62 | 454 | 190 | 7.11 |
| November | 77.11 | 75.53 | 8.10 | 368 | 287 | 2.78 | 1160 | 832 | 49.0 | 9.04 | 7.89 | 0.35 | 343 | 131 | 9.75 |
| December | 78.58 | 76.82 | 8.23 | 383 | 291 | 3.04 | 985 | 793 | 47.8 | 9.14 | 8.04 | 0.36 | 325 | 124 | 8.76 |
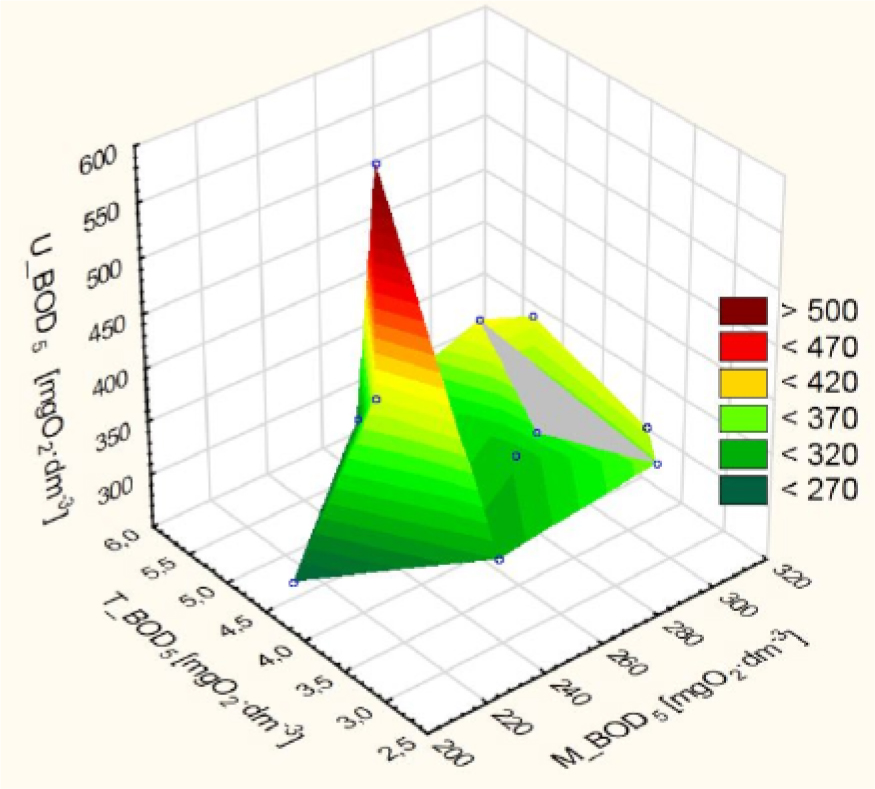
Figure 2.
Mutual correlations for BOD5 in the wastewater treatment process
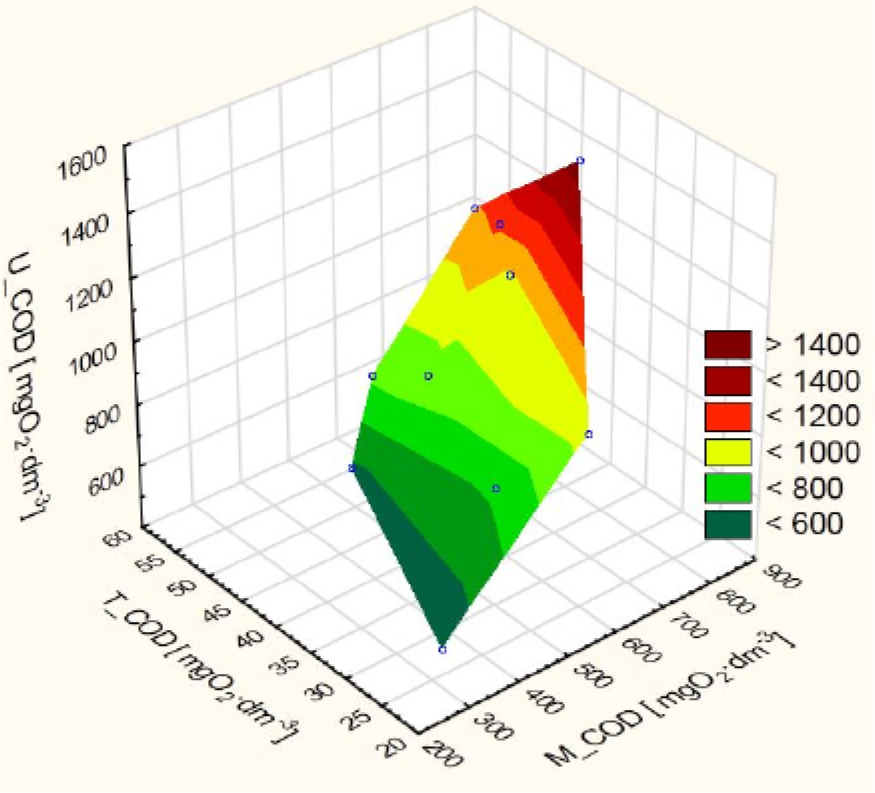
Figure 3.
Mutual correlations of COD parameters in the wastewater treatment process
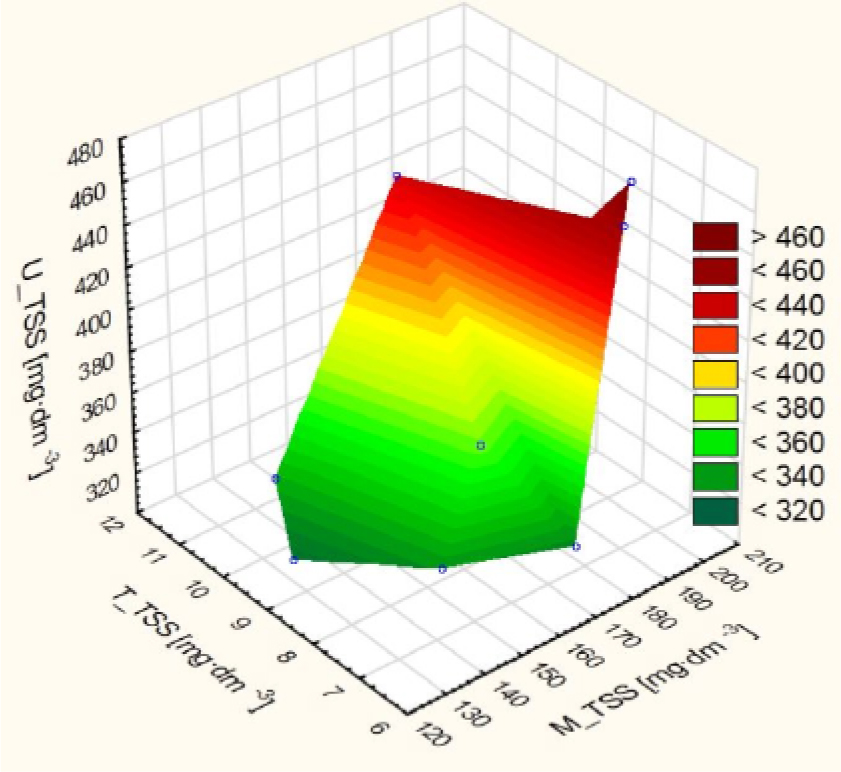
Figure 4.
Mutual correlations for total suspended solids in the wastewater treatment process
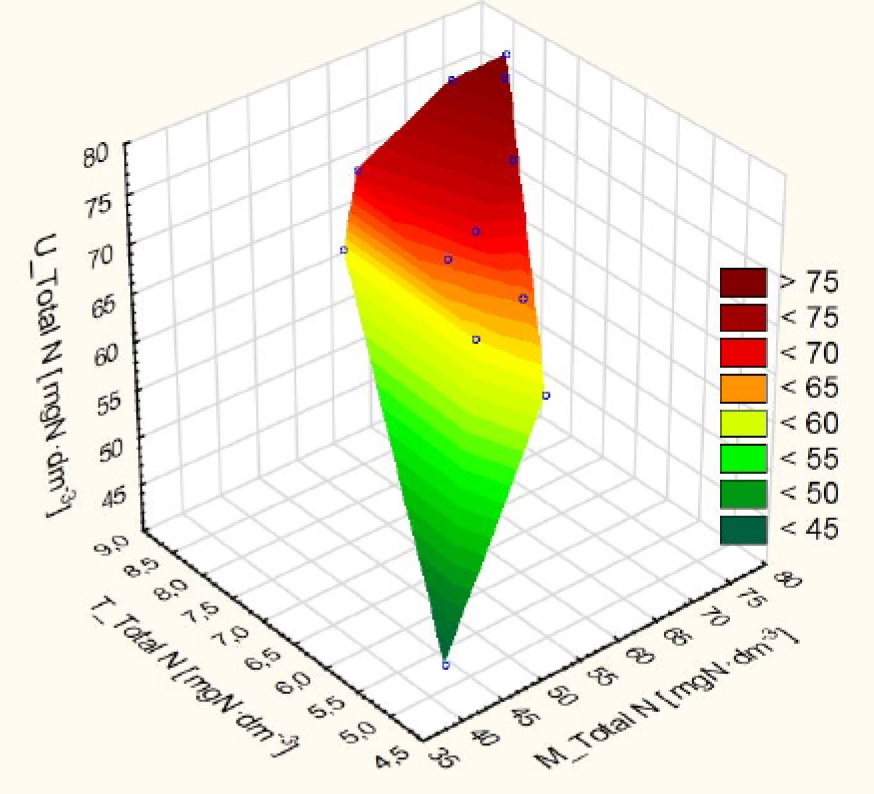
Figure 5.
Mutual correlations of total nitrogen parameters in the wastewater treatment process
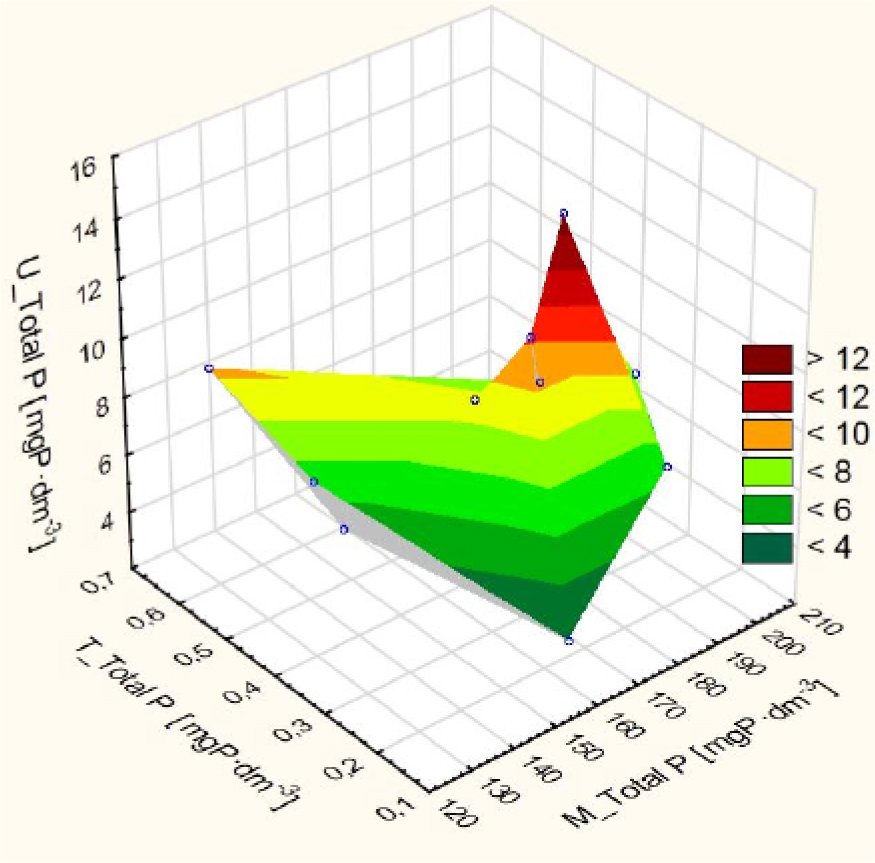
Figure 6.
Mutual correlations of total phosphorus concentrations in the wastewater treatment process
Table 2.
Comparison of N-NH4+ loads at the corresponding points of the technological cycle
| No | Name of substance | Unit | Concentration value in untreated sewage | Concentration value in treated sewage | Scope of concentration reduction of a given substance [%] | Minimum required percentage of concentration reduction of a given substance [%] |
|---|---|---|---|---|---|---|
| 1. | Biochemical oxygen demand (BOD5) | mgO2·dm-3 | 361.64 | 4.45 | 98.77 | 90 |
| 2. | Chemical oxygen demand (CODCr) | mgO2·dm-3 | 942.36 | 1.66 | 99.82 | 75 |
| 3. | Total suspension | mg·dm-3 | 377.36 | 8.79 | 97.67 | 90 |
| 4. | Total nitrogen | mgN·dm-3 | 66.16 | 7.20 | 89.12 | 70-80 |
| 5. | Total phosphorus | mgP·dm-3 | 7.93 | 0.38 | 95.21 | 80 |
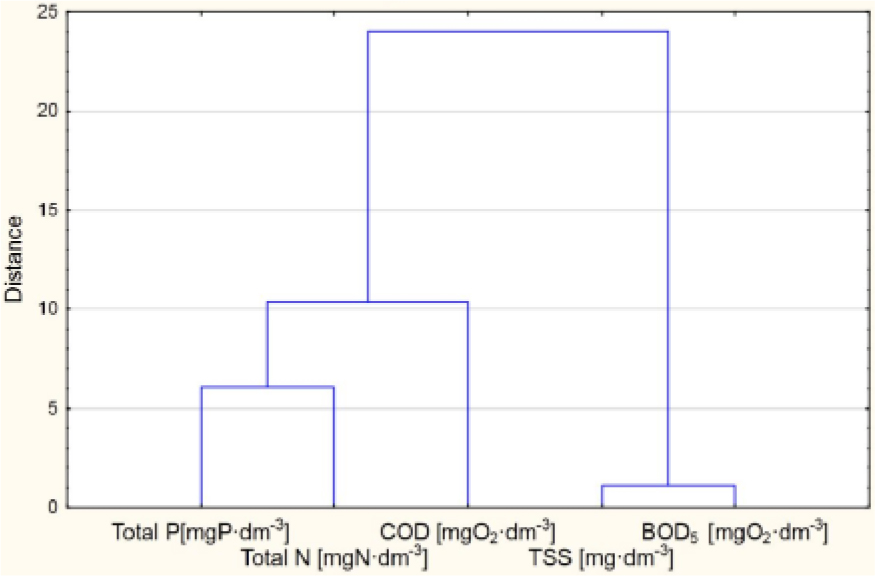
Figure 7.
Dendrogram of the effectiveness of concentration reduction to permissible values in the treated sewage
Table 3.
Scope of load reduction for individual substances contained in untreated and treated sewage
| No | Name of substance | Load in untreated sewage [kg/d] | Load in treated sewage [kg/d] | Reduction scope of load of a given substance [%] |
|---|---|---|---|---|
| 1. | Biochemical oxygen demand (BOD5) | 9216 | 117 | 98.73 |
| 2. | Chemical oxygen demand (CODCr) | 23228 | 1065 | 95.41 |
| 3. | Total suspension | 8966 | 295 | 96.70 |
| 4. | Total nitrogen | 1691 | 168 | 90.06 |
| 5. | Total phosphorus | 193 | 9.1 | 95.28 |
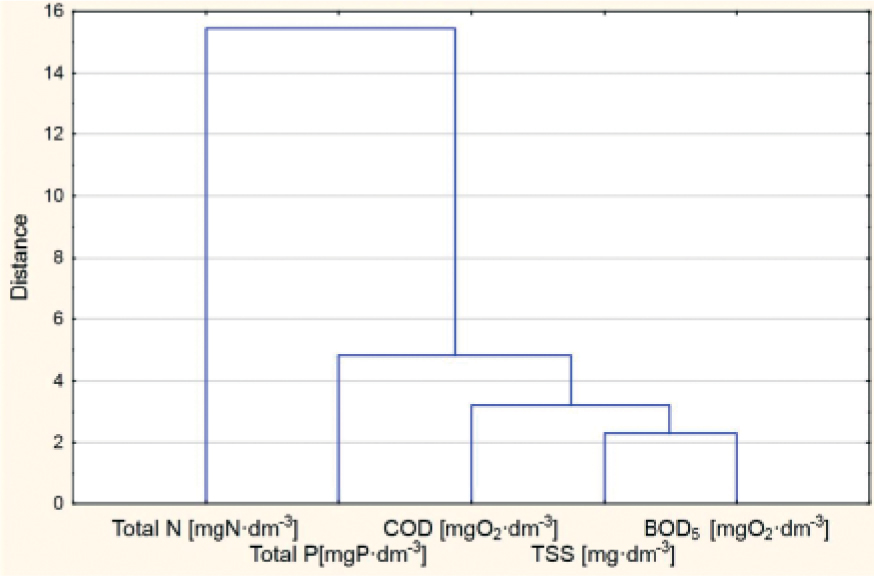
Figure 8.
Dendrogram for the effectiveness of concentration reduction and load reduction in treated sewage