
Table 1
Oligonucleotide sequences of primers used for RT-qPCR analysis
| GENE | PRIMER SEQUENCE (5′–3′) | PRODUCT SIZE (BP) | |
|---|---|---|---|
| DNMT1 | F | GTGAGGACATGCAGCTTTCA | 211 |
| R | AACTTGTTGTCCTCCGTTGG | ||
| DNMT3A | F | CTGAGAAGCCCAAGGTCAAG | 238 |
| R | CAGCAGATGGTGCAGTAGGA | ||
| DNMT3B | F | ACAGGTCGGCTCTTCTTTGA | 245 |
| R | AAAGCCCCTCGTTACCTGTT | ||
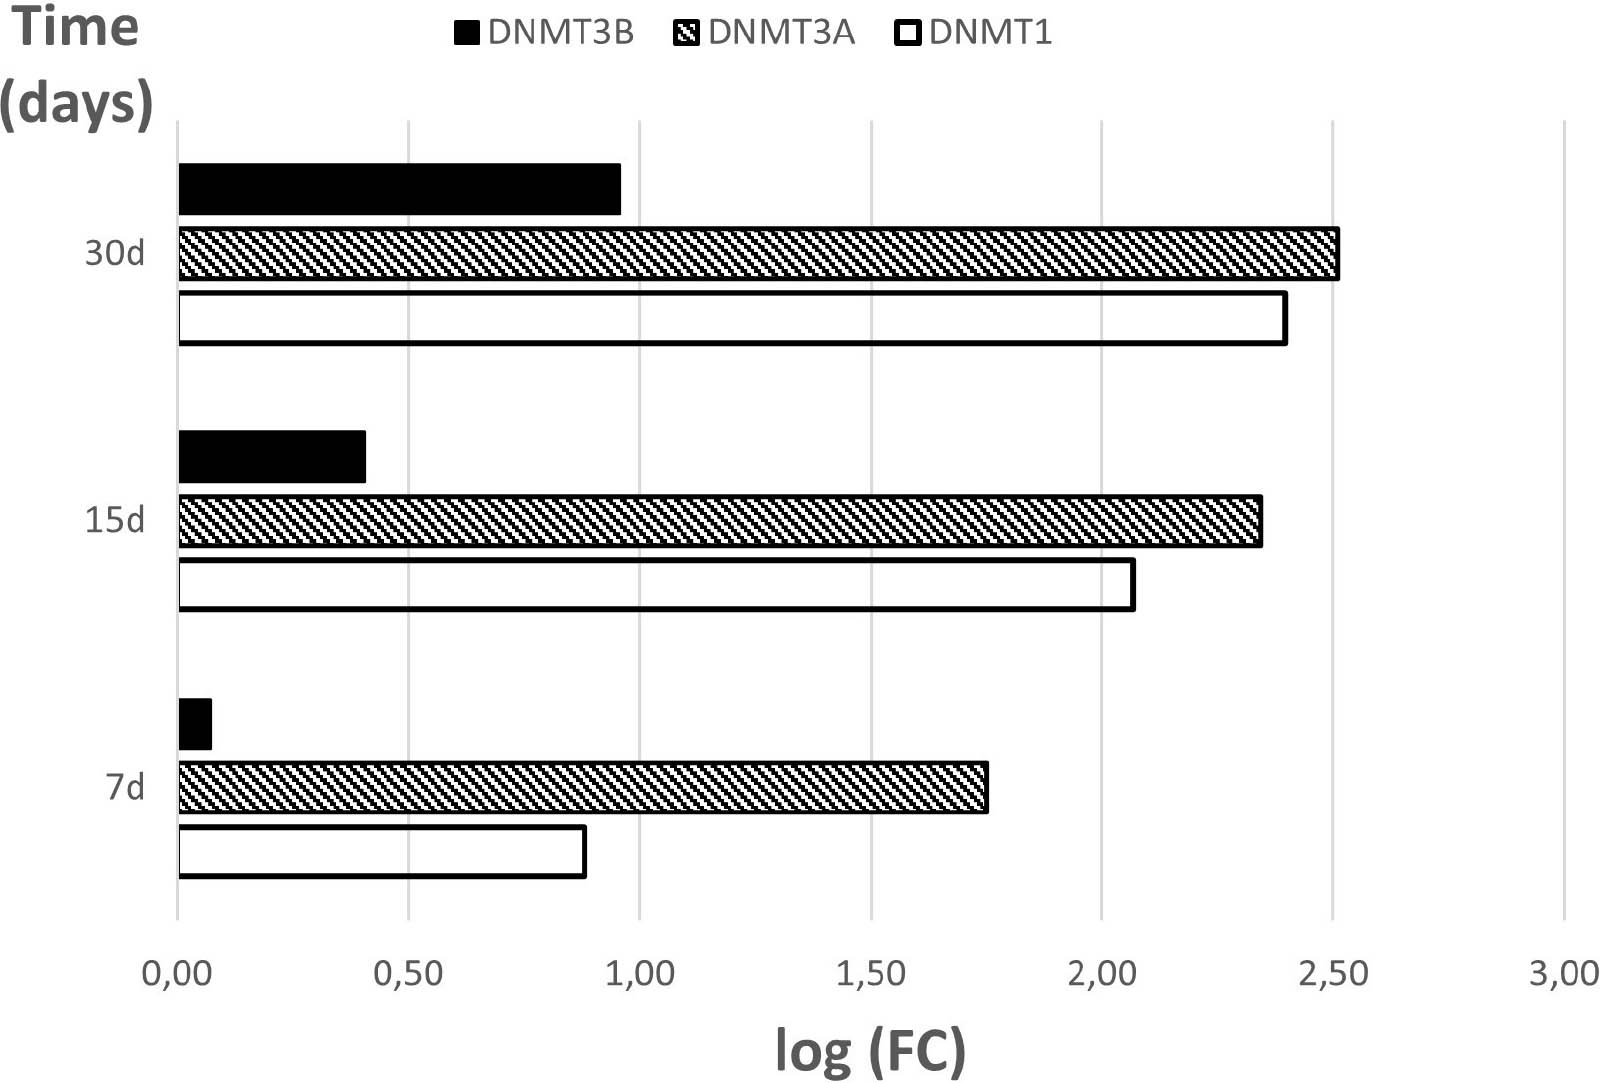
Figure 1
RT-qPCR quantitative relative changes of analyzed DNMTs presented in a form of a bar graph. The graph shows the relative changes in gene expression results for 7, 15 and 30 days of cultivation, in relation to the transcript levels obtained from beginningo of our culture (0d). FC was presented in its logarithmic form to provide clear comparability of the results
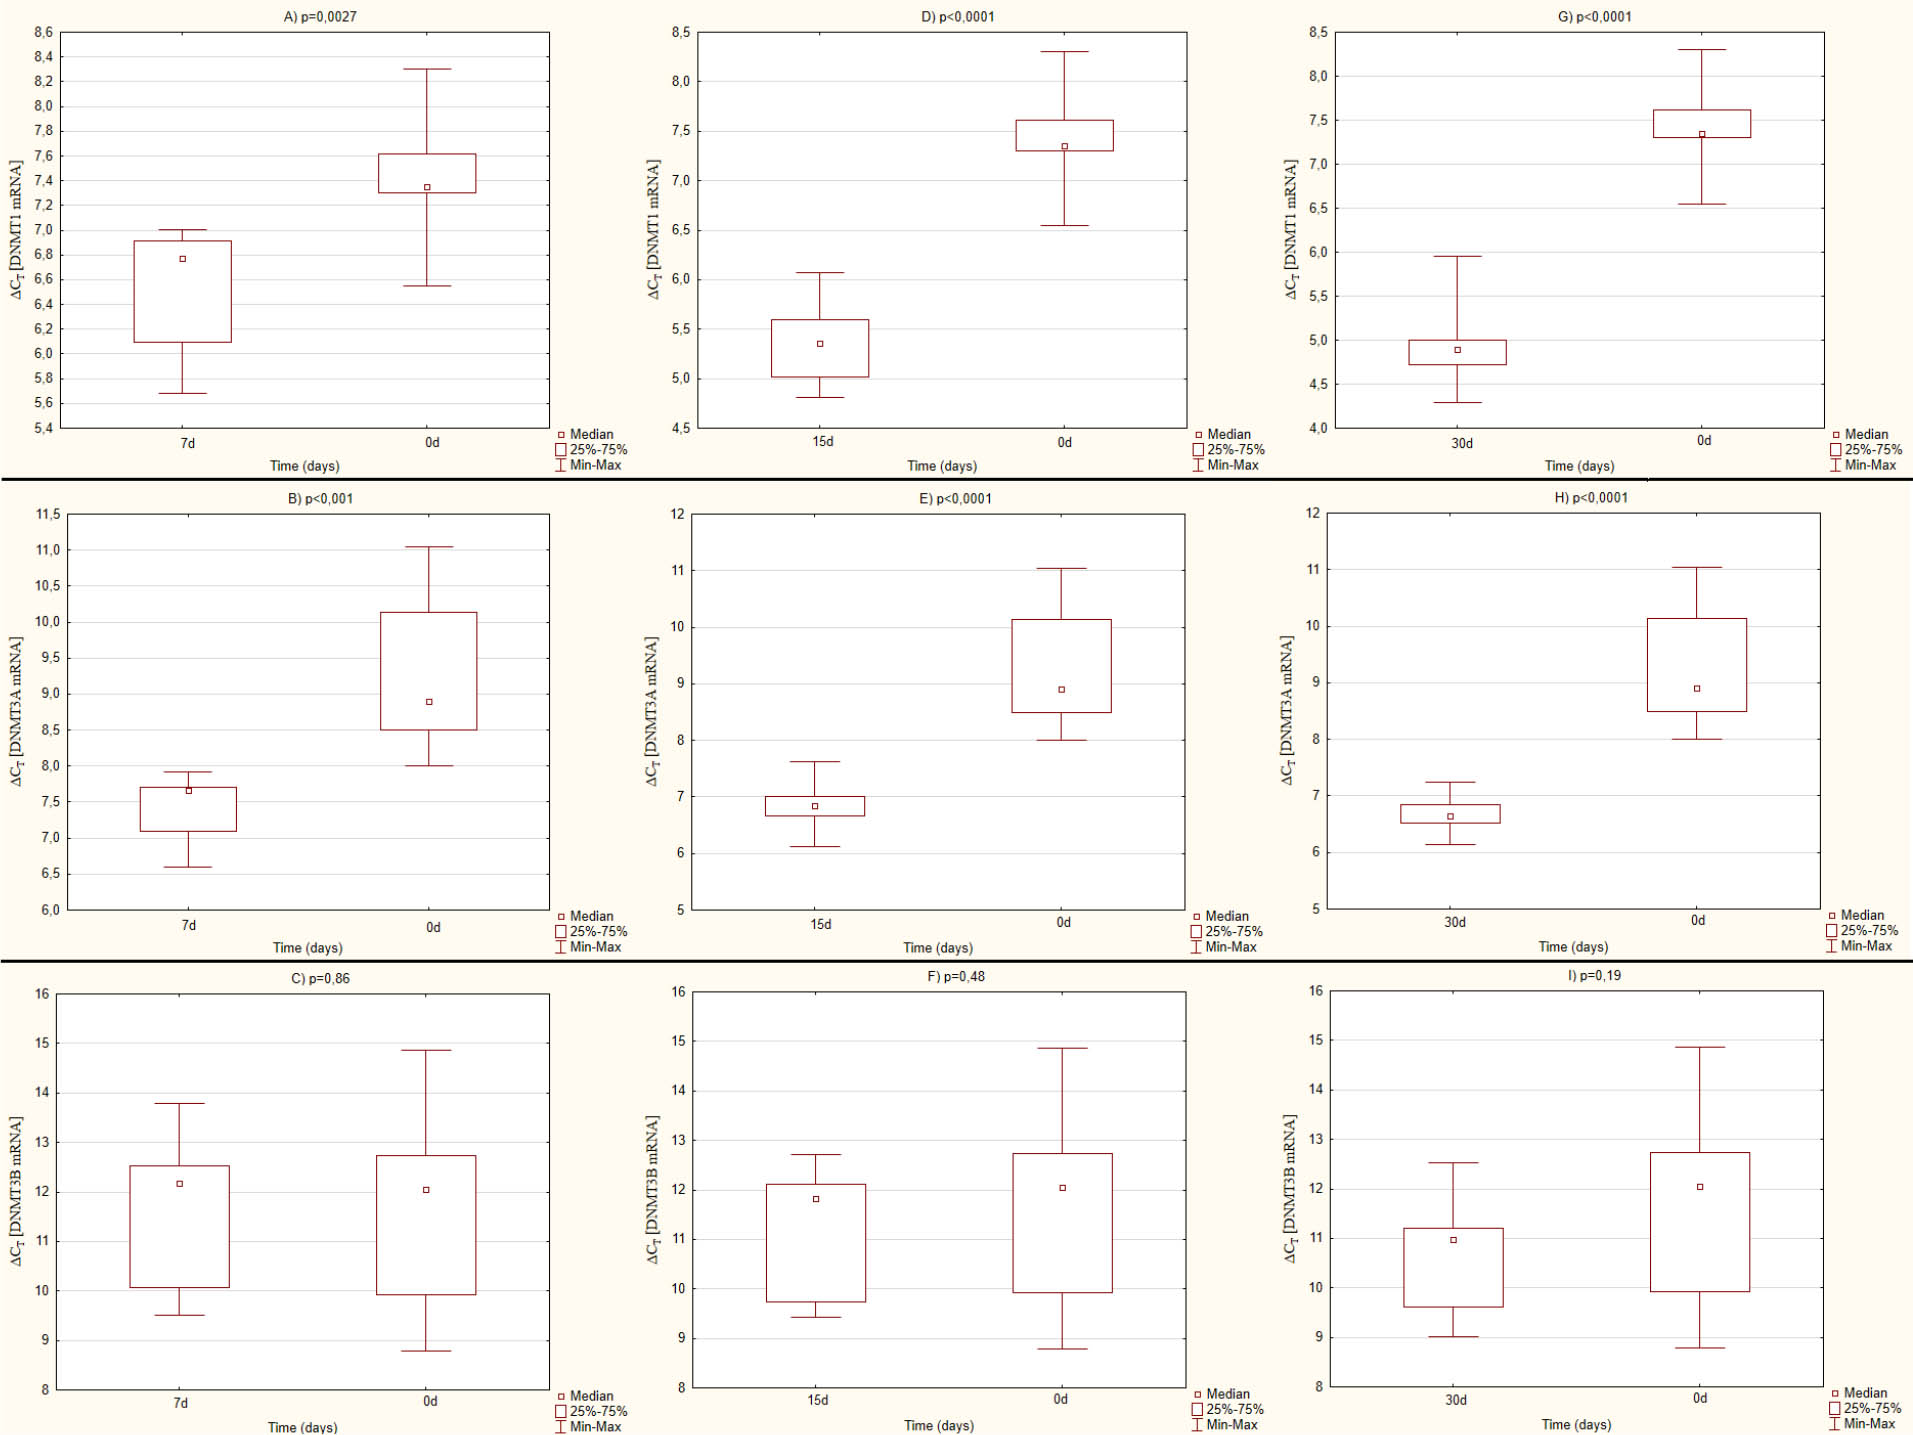
Figure 2
Comparision of ΔCT values for analyzed DNMTs mRNA levels in different stages of culture. All calculations were made in relation to the expression levels for the individual genes at the time of beginning of the culture