
Table 1
Primer sequences were used for the amplification of each gene
| Turkey MyoD1 | Forward: GCTCCAAGACCTGCCTTCTA |
| Reverse: AAACATTGGCCATTTCCCCG | |
| Turkey Myogenin | Forward: ACCGCAACCTCCACTCTCTC |
| Reverse: GCCAGCTCAGTTTTGGACCC | |
| Turkey TERT 1 | Forward: ACTGCTGAAGACAGTGACGGA |
| Reverse: AACCTTCATCGCTTAGTCCAGT | |
| Turkey TERT 2 | Forward: GCTGGCAAGTCTCTGTGACTCTT |
| Reverse: GGAGAGGGAGCTGCTCAGAAC | |
| Turkey MYF5 | Forward: AGCTGCCAGTTCTCCCCATC |
| Reverse: GTGCTCCTCTTCCTCAGGGC | |
| Turkey MRF4 | Forward: TCCGACTTCCTGAGCACCTG |
| Reverse: TTTCTCCACCGCCTCTTCCG | |
| Turkey Pax7 | Forward: TGGCGGATGTGGTTGGGTAA |
| Reverse: TAGAAGTGTCCACCCCGCTG | |
| Turkey β-actin | Forward: TACTCCCACAGCCAGCCATG |
| Reverse: TGGGGTACTTCAGGGTCAGGA | |
| Turkey Dyskerin | Forward: GTTAGCGACTACCCCCGACC |
| Reverse: GTGGAGACCCCGTTCCTACG | |
| Turkey ALDH1 | Forward: AATCGCTCCCTTGCTGTTGA |
| Reverse: AATCGCTCCCTTGCTGTTGA | |
| Turkey ALDH2 | Forward: GCTAGTCGTAAAGACCCCCG |
| Reverse: TCTGGCACGGAAAATGCTCA | |
| Turkey Nanog | Forward: CAGAGCAGAAAACGCCCAGC |
| Reverse: CCTTGTCCCACTCTCACCTTTA | |
| Turkey GAPDH | Forward: TACTCCCACAGCCAGCCATG |
| Reverse: ACGGCAGGTCAGGTCAACAA |
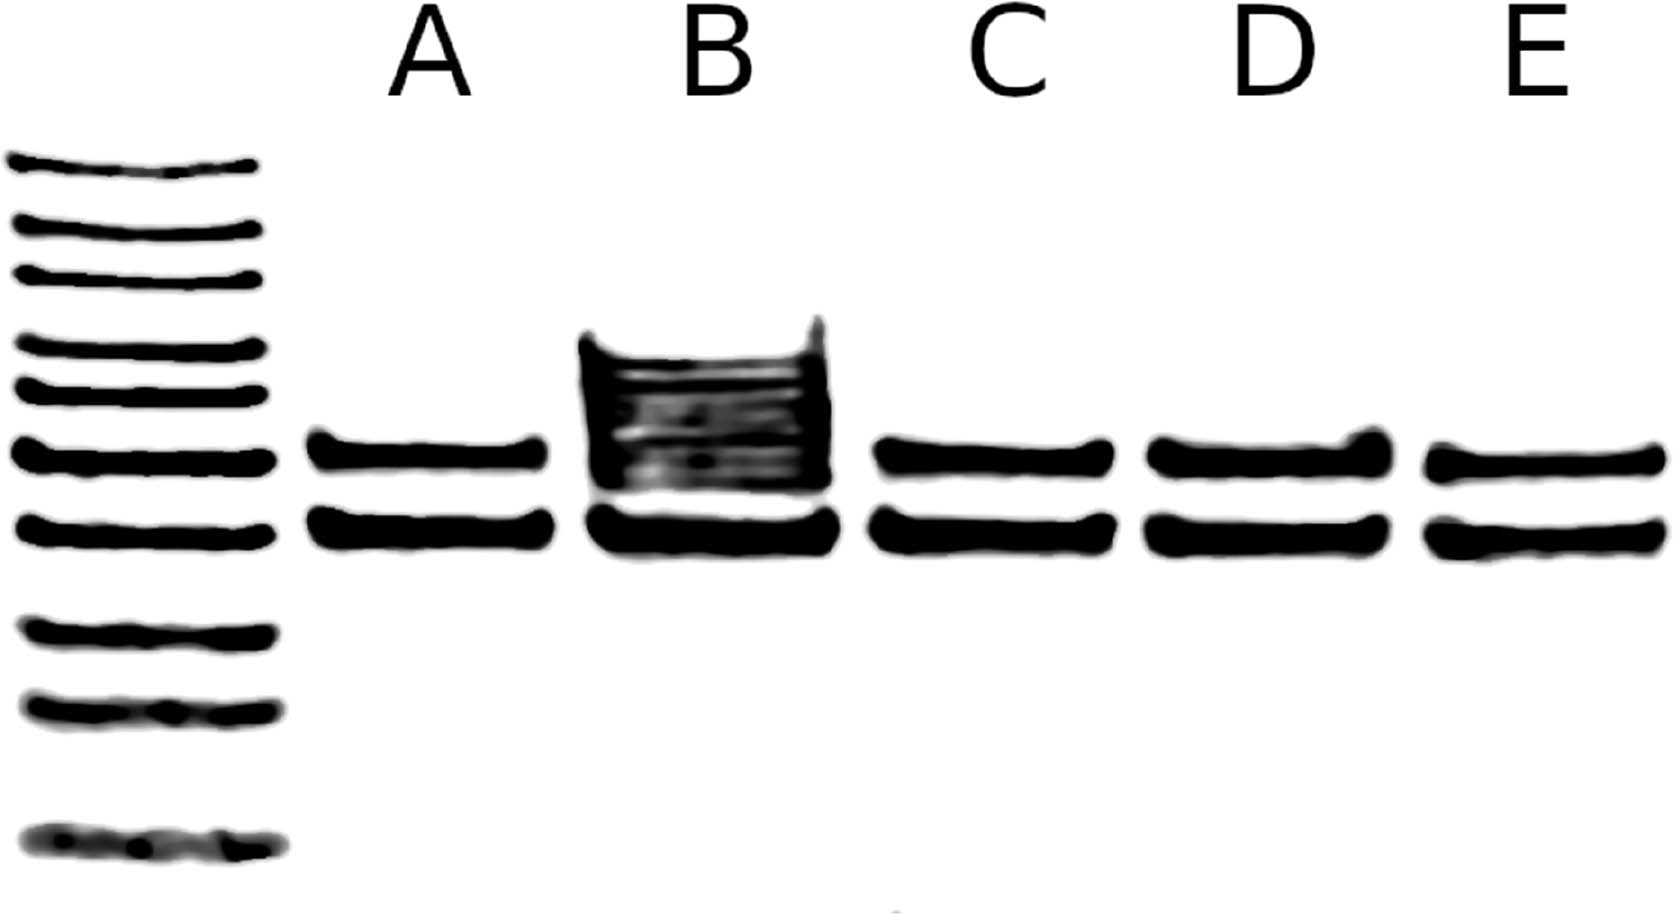
Figure 1
Detection of telomerase in the cultured cells. A: Primer dimer control, B: Cultured Turkey cells, C*: Heat treated cultured turkey cells, D: Rat myoblast cells, E*: Heat treated rat myoblast cells. *Samples were treated with 60° C for one hour to inactivate telomerase enzyme. The image is presented as a contrast adjusted negative to ease readability
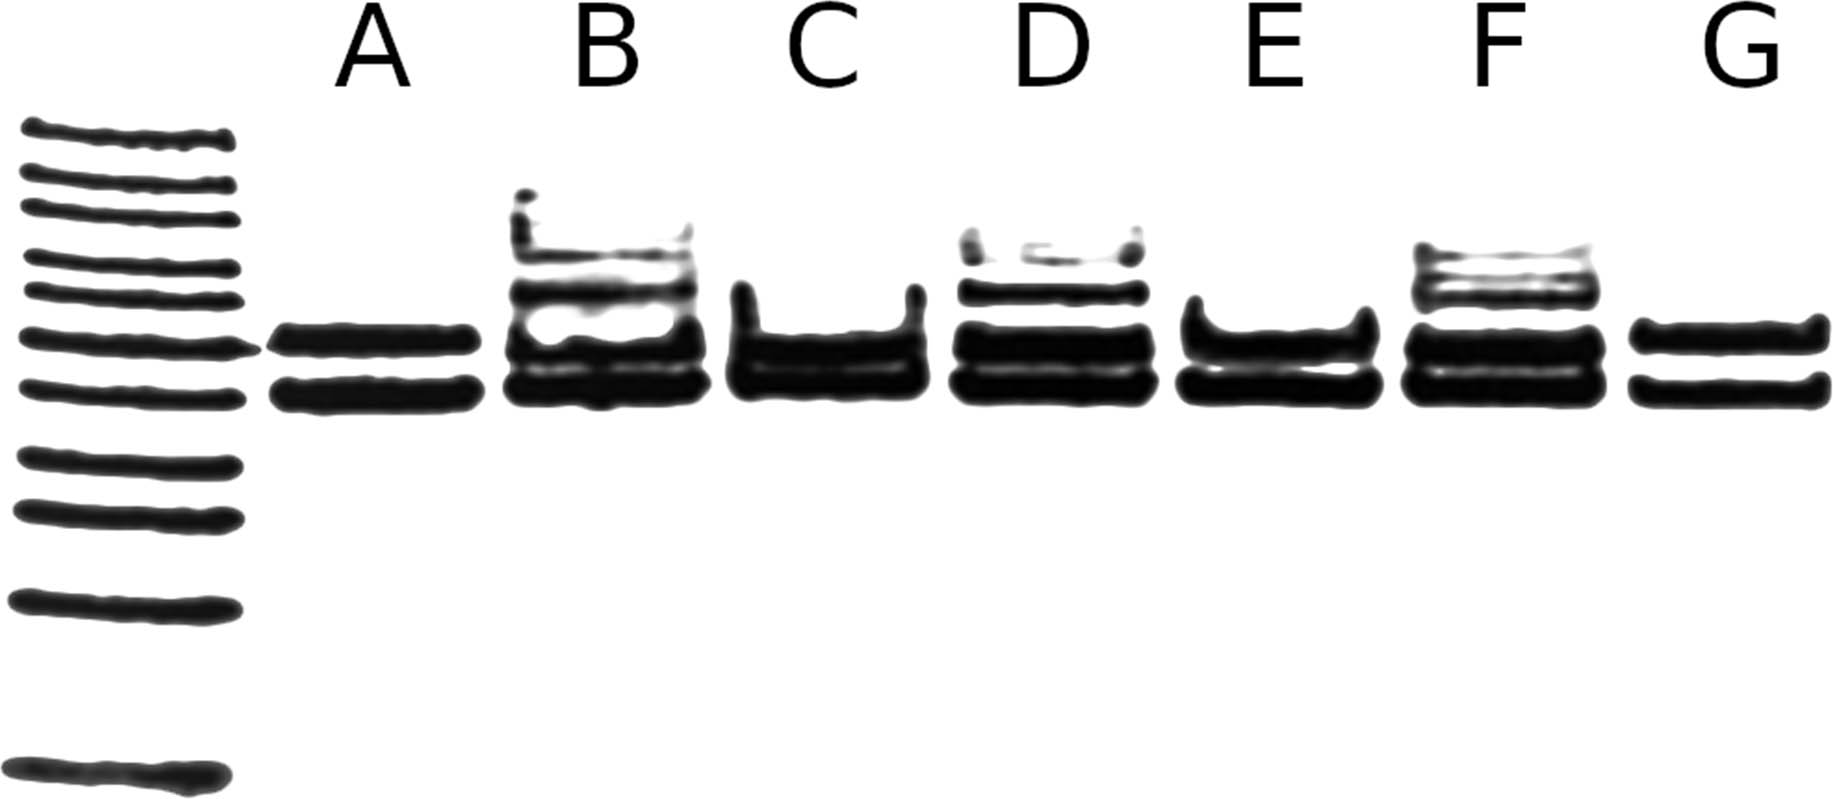
Figure 2
Telomerase detection in undifferentiated versus differentiated cells. A: Primer dimer Control, B: kit positive control, C*: Heat treated kit positive control, D:Undifferentiated cells E*: Heat treated undifferentiated cells, F: Differentiated cells, G*: Heat treated differentiated cells. *Samples were treated with 60° C for one hour to inactivate telomerase enzyme. The image is presented as a contrast adjusted negative to ease readability
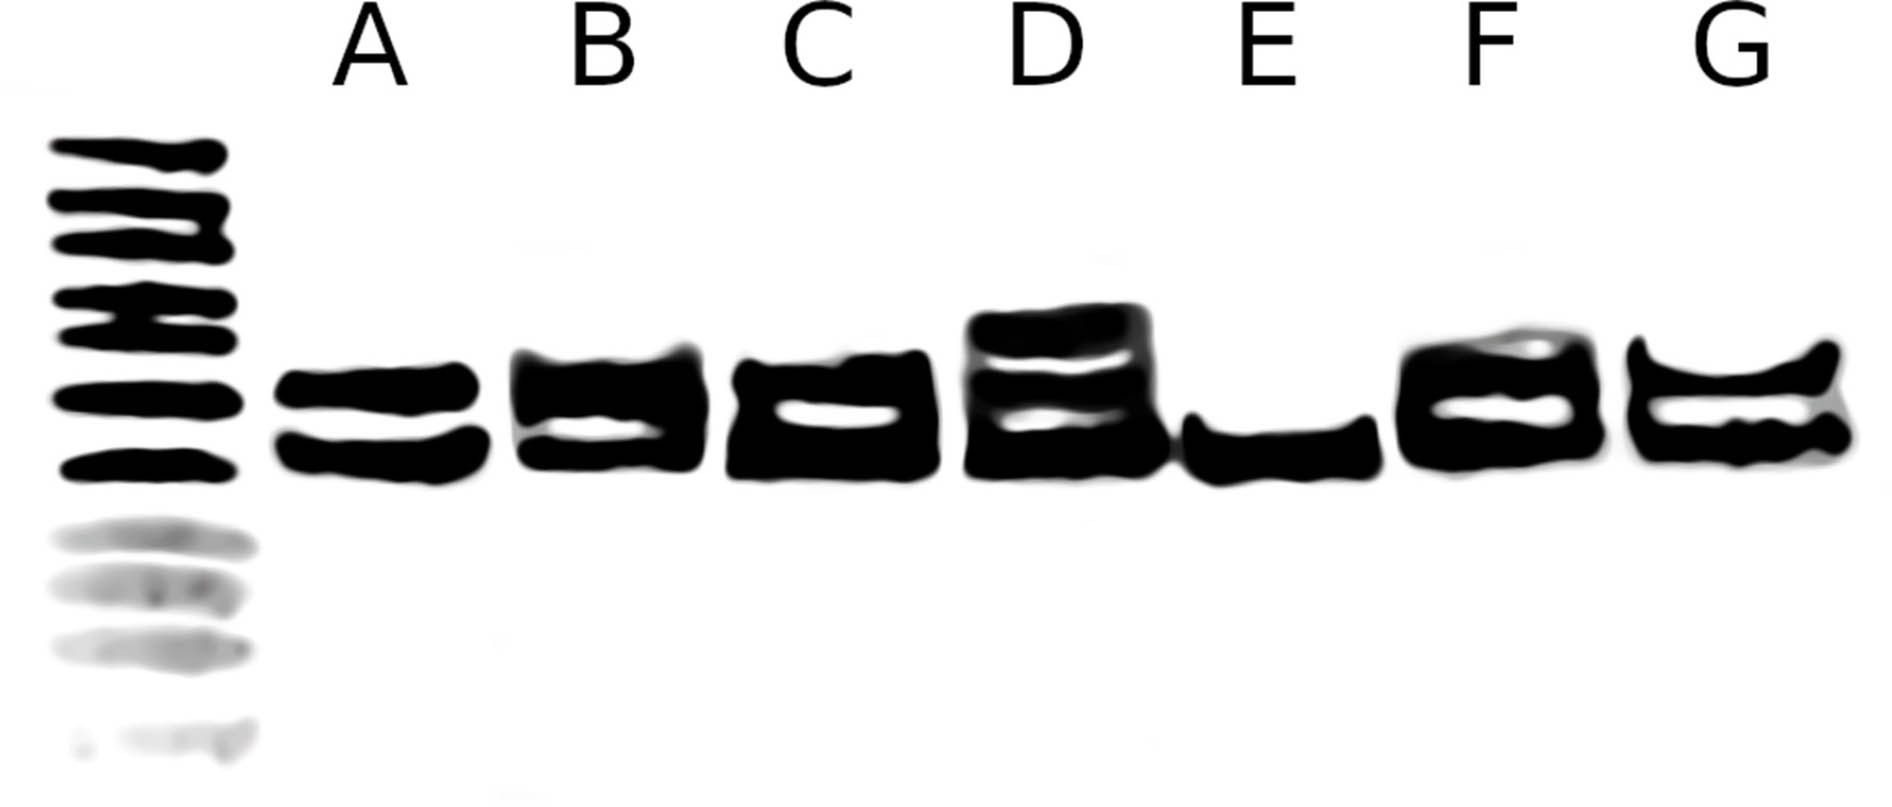
Figure 3
Telomerase detection in suspended myoblasts. A:Primer dimer control, B:kit positive control, C: Heat treated kit positive control, D: Short-term turkey cell culture in suspension, E: Heat treated short-term turkey cell culture in suspension, F:Long-term Turkey cell culture in suspension, G: Heat treated Long-term Turkey cell culture in suspension. *Samples were treated with 60° C for one hour to inactivate telomerase enzyme. The image is presented as a contrast adjusted negative to ease readability
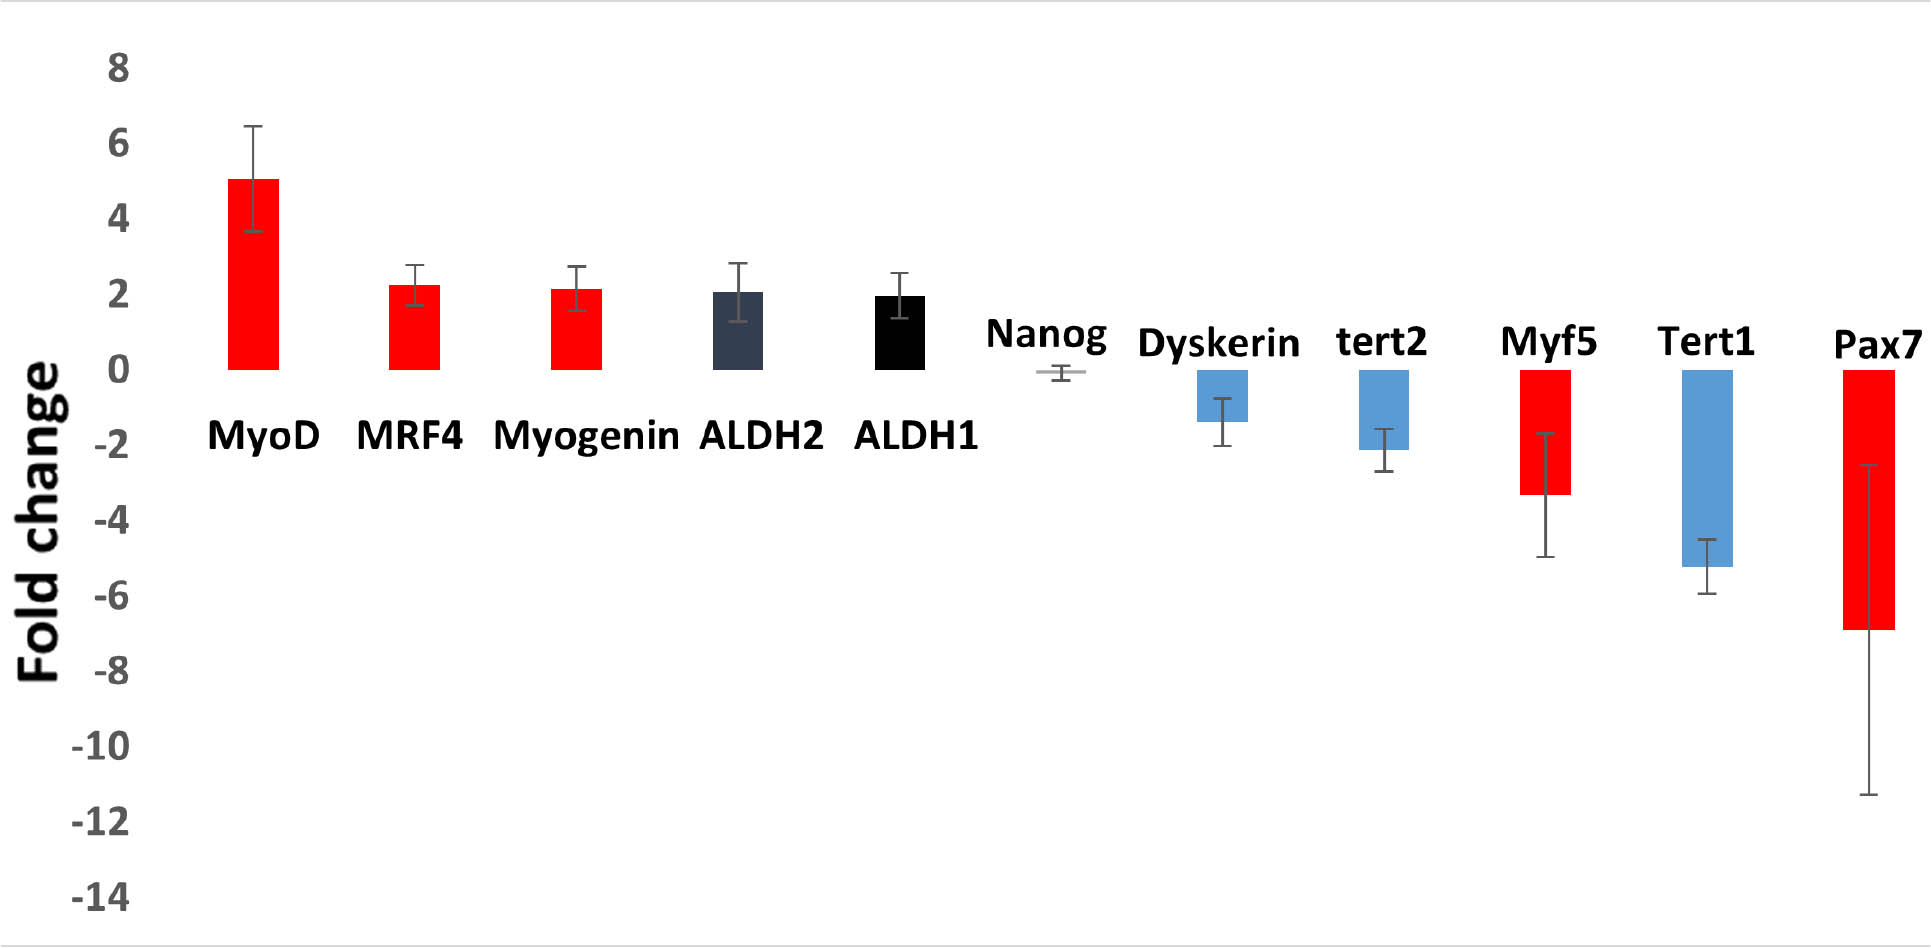
Figure 4
Gene expression in differentiated versus undifferentiated cells. The bar chart shows fold changes of genes measured by quantitative RT-PCR. Mean fold changes are expressed on a log2 scale as myotube cell versus myoblast cell values
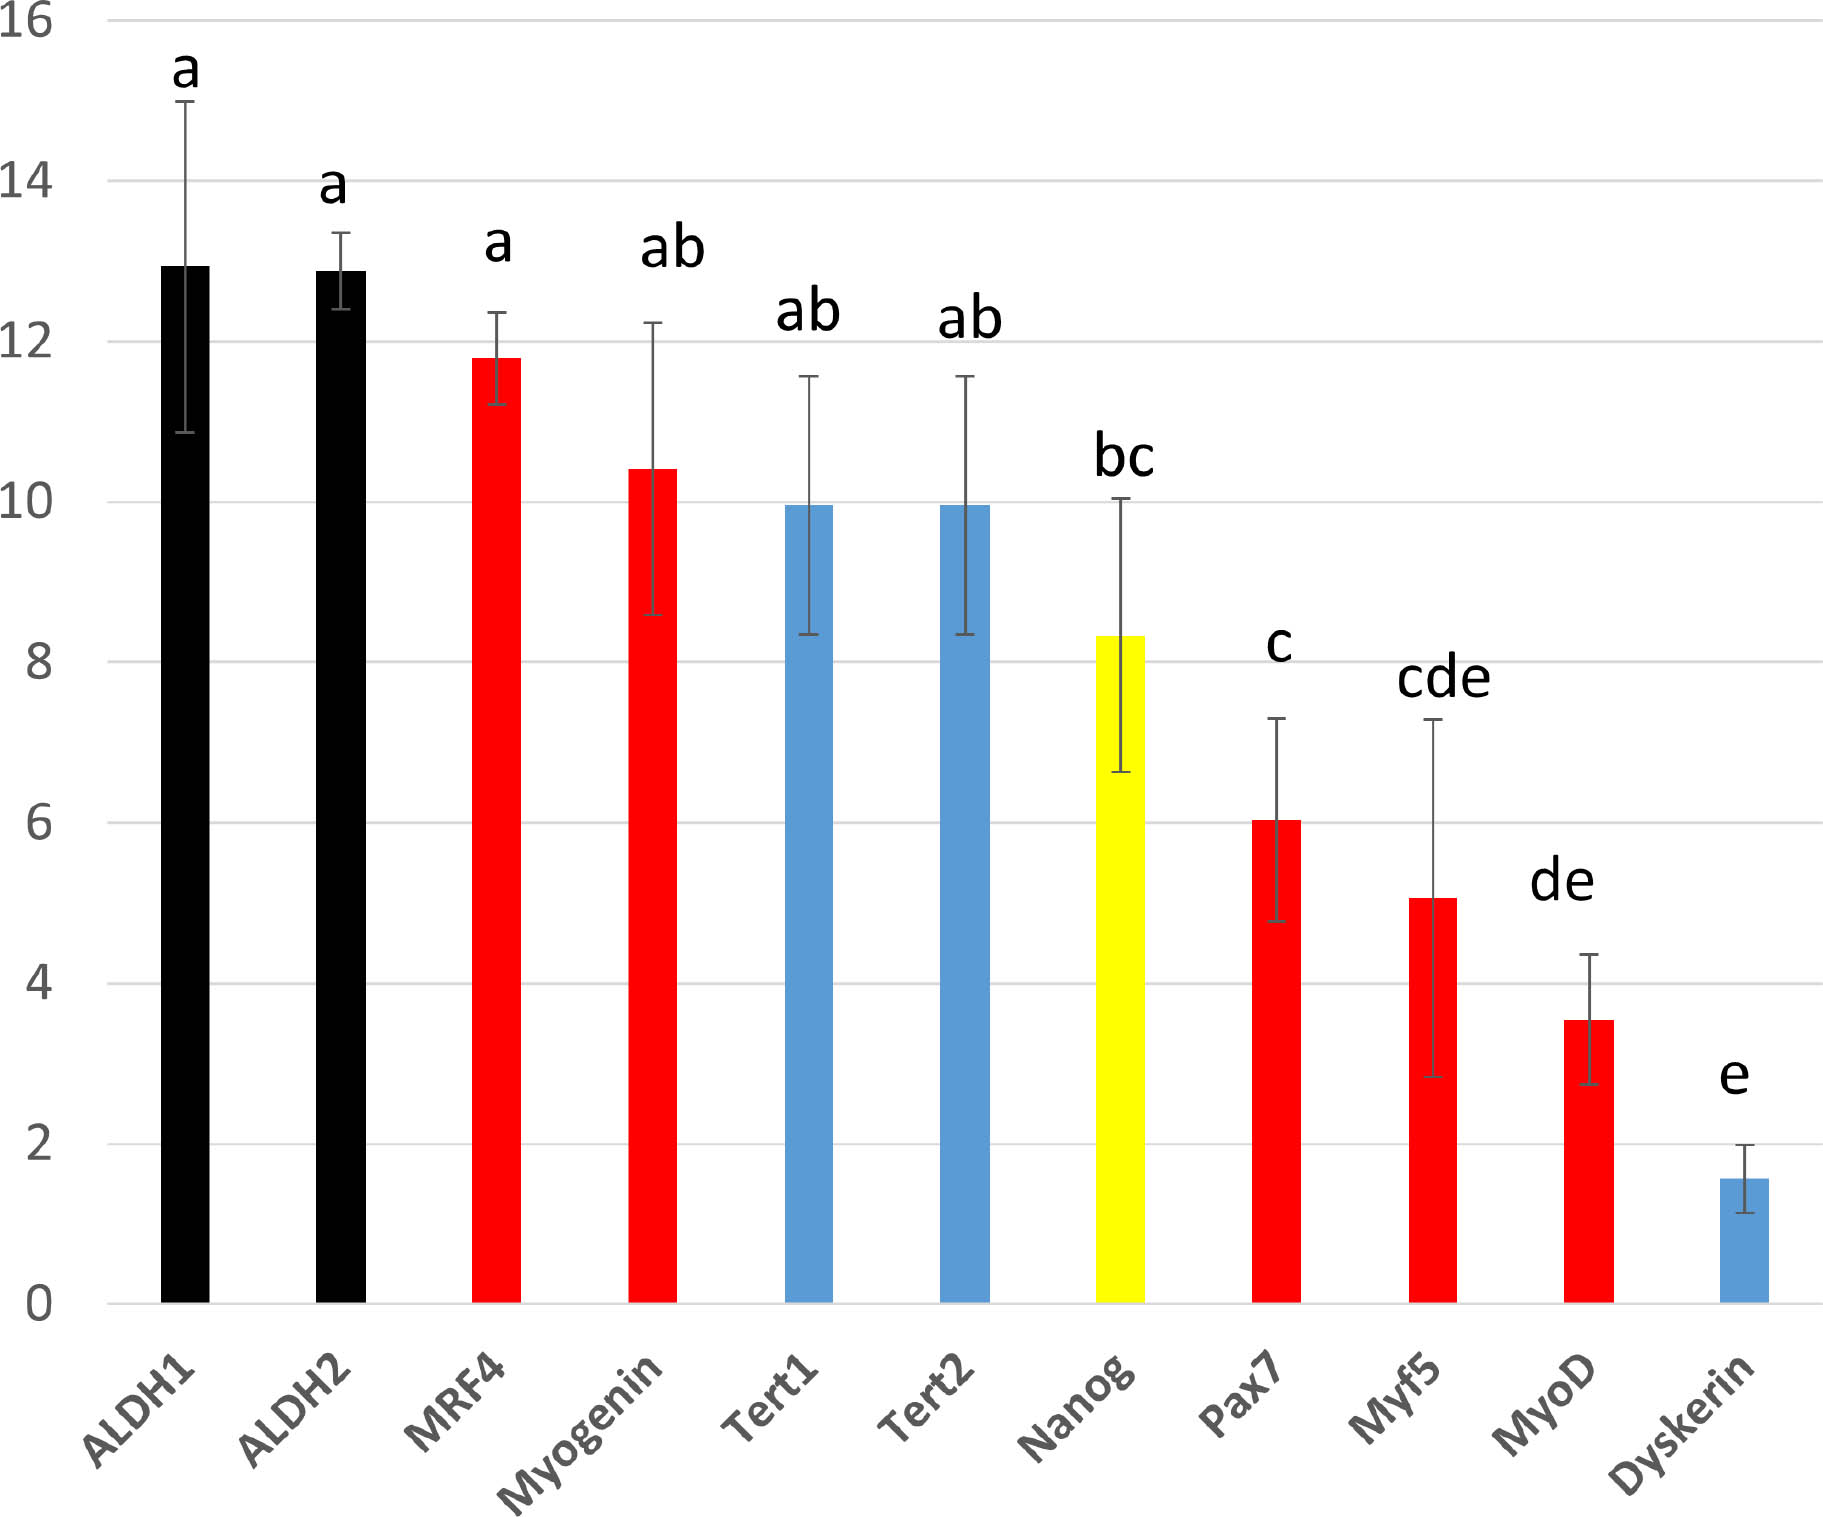
Figure 5
Gene expression in long-term suspension culture versus adherent cells. The bar chart shows fold changes of genes measured by quantitative RT-PCR. Mean fold changes are expressed on a log2 scale as long-term suspended culture versus adherent cells FC values
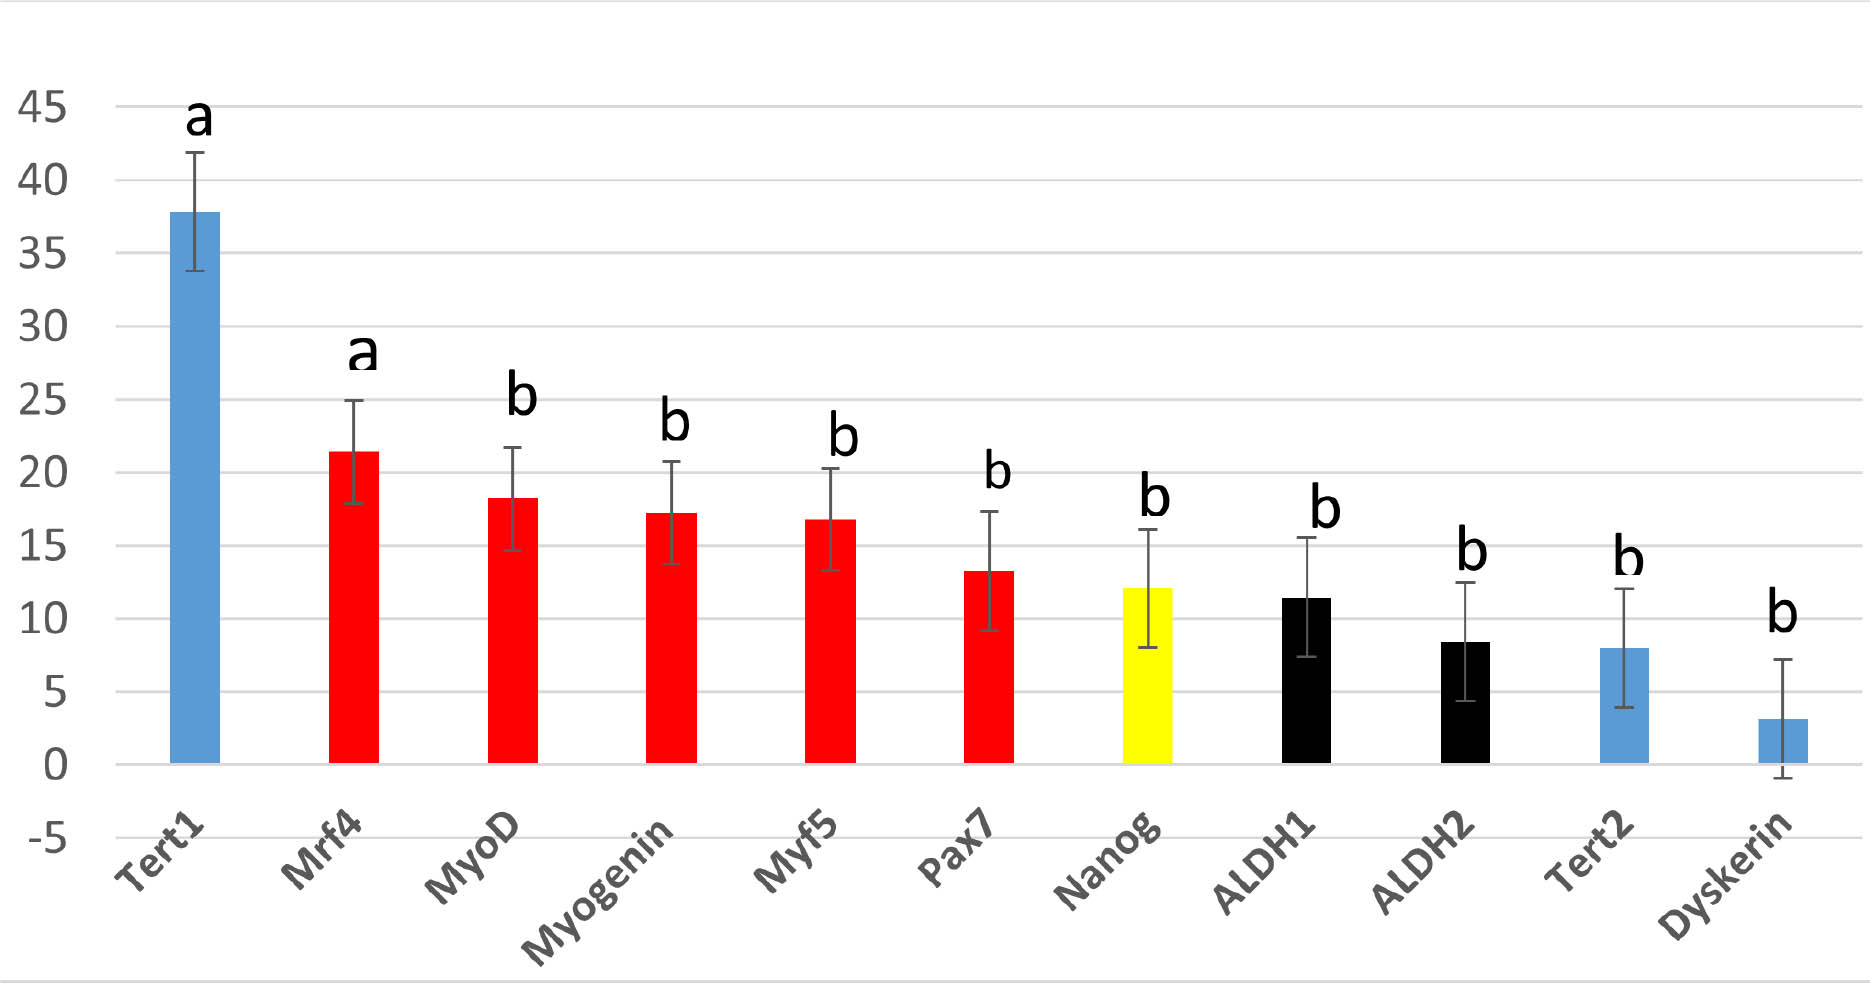
Figure 6
Gene expression in short-term (3 month) versus long-term (12 month) cell culture in suspension. The bar chart shows fold changes of genes measured by quantitative RT-PCR. Mean fold changes are expressed on a log2 scale as short vs long-term suspended culture cell values