
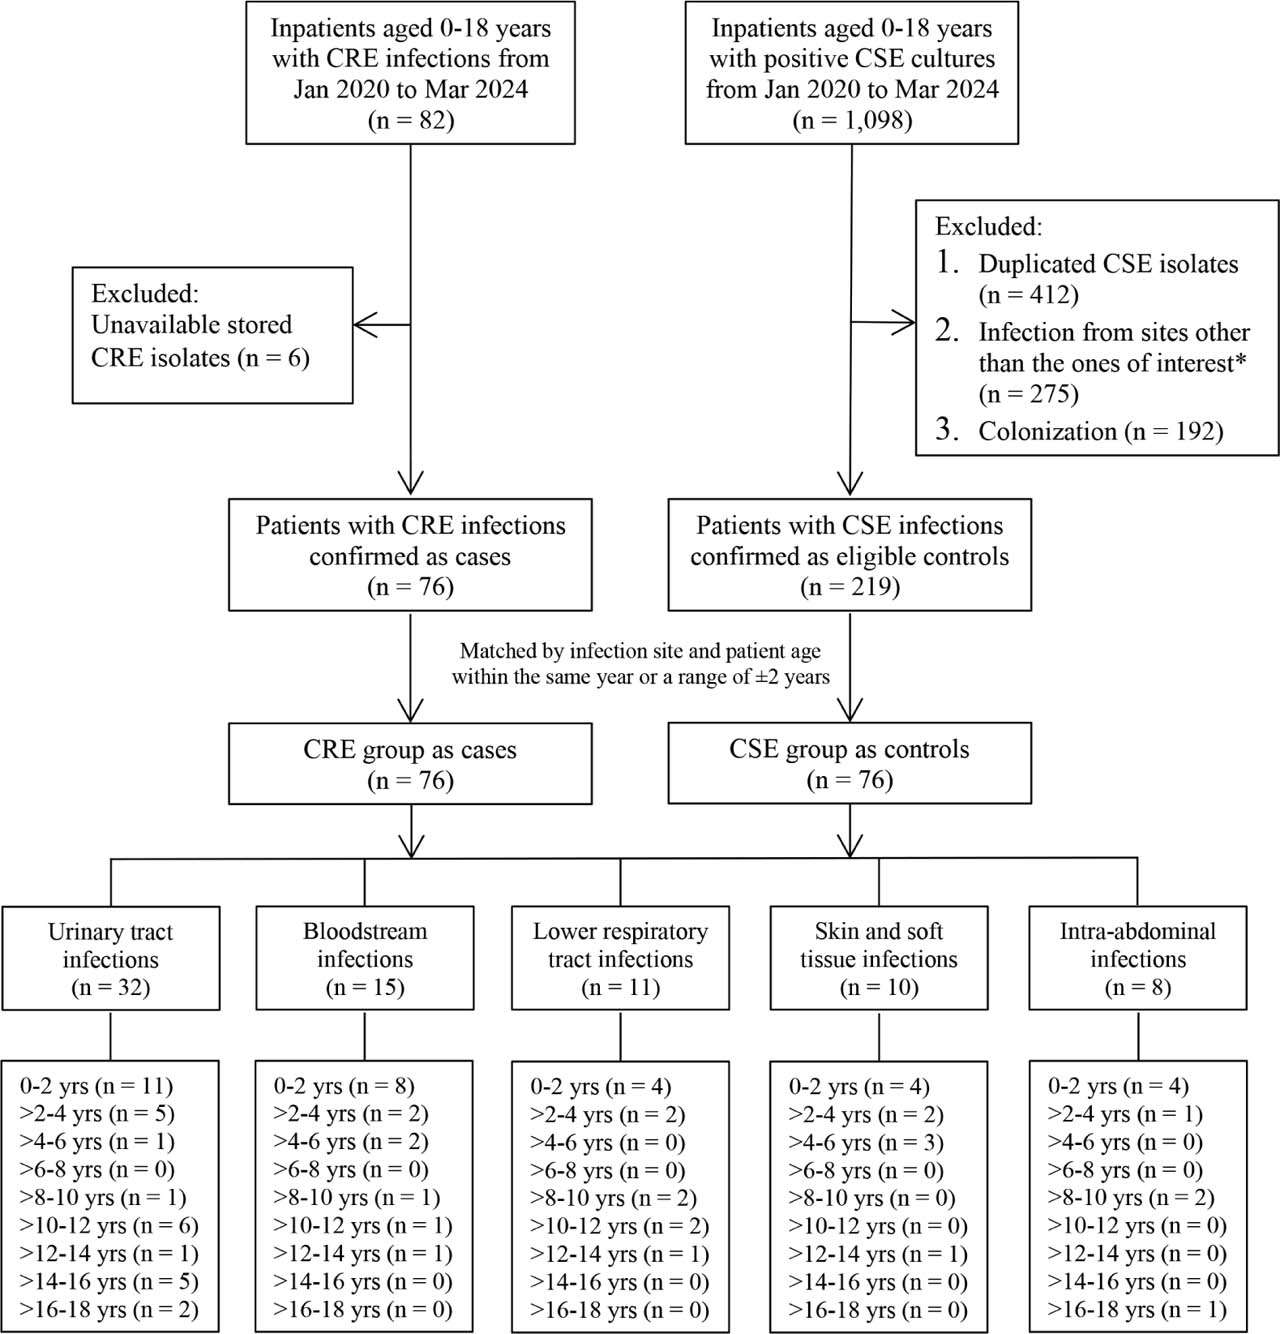
Figure 1.
Flowchart of this matched case-control study. *Infection from sites other than the ones of interest includes upper respiratory tract specimens, cerebrospinal fluid, gastric content, bone marrow, catheter tips, conjunctival swab, pleural fluid, peritoneal dialysis fluid, breast milk, synovial fluid, and vaginal swab. CRE, carbapenem-resistant Enterobacterales; CSE, carbapenem-susceptible Enterobacterales; yrs, years.
Table 1.
Univariate and multivariate analysis to evaluate risk factors associated with CRE infections
| Variables | CRE patients (n = 76) | CSE patients (n = 76) | Univariate analysis | Multivariate analysis | ||
|---|---|---|---|---|---|---|
| OR (95% CI) | P | aOR (95% CI) | P | |||
| Referral from other hospitals | 44 (57.9%) | 22 (28.9%) | 4.14 (1.81–9.45) | 0.001 | 4.32 (1.57–11.96) | 0.005 |
| Intensive care unit | 36 (47.4%) | 23 (30.3%) | 2.86 (1.21–6.75) | 0.017 | ||
| Comorbidities | ||||||
| Malignancies | 13 (17.1%) | 14 (18.4%) | 0.86 (0.29–2.55) | 0.78 | ||
| Genitourinary diseases | 11 (14.5%) | 17 (22.4%) | 0.4 (0.13–1.28) | 0.12 | ||
| Hepatobiliary or gastrointestinal diseases | 21 (27.6%) | 11 (14.5%) | 3.0 (1.09–8.25) | 0.03 | ||
| Cardiovascular or respiratory diseases | 17 (22.4%) | 11 (14.5%) | 2.5 (0.78–7.97) | 0.12 | ||
| Neurological or cutaneous diseases | 13 (17.1%) | 8 (10.5%) | 1.83 (0.66–4.96) | 0.23 | ||
| Antibiotic exposure in the past 6 months | ||||||
| • Carbapenems | 47 (61.8%) | 16 (21.1%) | 11.0 (3.37–35.87) | <0.001 | 7.24 (1.06–25.42) | 0.002 |
| • Older β-lactam/β-lactamase inhibitors¶ | 48 (63.2%) | 28 (36.8%) | 3.86 (1.68–8.86) | <0.001 | ||
| • 3rd generation cephalosporins | 47 (61.8%) | 23 (30.3%) | 4.29 (1.88–9.76) | <0.001 | 3.68 (1.32–10.25) | 0.013 |
| • Fluoroquinolones | 26 (34.2%) | 11 (14.5%) | 4.0 (1.5–10.66) | 0.01 | ||
| • Aminoglycosides | 23 (30.3%) | 11 (14.5%) | 3.0 (1.19–7.56) | 0.02 | ||
| Multiple hospitalizations | 37 (48.7%) | 18 (23.7%) | 3.25 (1.47–7.18) | <0.001 | ||
| Undergoing major surgery | 37 (48.7%) | 26 (34.2%) | 1.71 (0.89–3.31) | 0.11 | ||
| Indwelling medical devices | ||||||
| • Central line | 44 (57.9%) | 24 (31.6%) | 4.33 (1.78–10.53) | <0.001 | ||
| • Arterial line | 17 (22.4%) | 11 (14.5%) | 2.0 (0.75–5.33) | 0.17 | ||
| • Nasogastric or orogastric tube | 42 (55.3%) | 24 (31.6%) | 2.7 (1.31–5.58) | 0.01 | ||
| • Abdominal drainage | 21 (27.6%) | 11 (14.5%) | 2.11 (0.96–4.67) | 0.06 | ||
| Mechanical ventilation | 27 (35.5%) | 16 (21.1%) | 2.83 (1.12–7.19) | 0.03 | ||
Table 2.
Prevalence of ESBL and carbapenemase genes among 76 CRE isolates
| Genes | CPE (n = 58) | Non-CP-CRE (n = 18) | Total (n = 76) |
|---|---|---|---|
| Extended-spectrum beta-lactamase | |||
| blaSHV | 27 (46.6%) | 8 (44.4%) | 35 (46.1%) |
| blaTEM | 38 (65.5%) | 11 (61.1%) | 49 (64.5%) |
| blaOXA-1 | 17 (29.3%) | 6 (33.3%) | 23 (30.3%) |
| blaCTX-M | 53 (91.4%) | 14 (77.8%) | 67 (88.2%) |
| blaVEB | 0 (0.0%) | 0 (0.0%) | 0 (0.0%) |
| Carbapenemase | |||
| blaNDM | 35 (60.3%) | - | 35 (46.1%) |
| blaOXA-48 | 30 (51.7%) | - | 30 (39.5%) |
| blaNDM + blaOXA-48 | 7 (12.1%) | - | 7 (9.2%) |
| blaIMP | 0 (0.0%) | - | 0 (0.0%) |
| blaVIM | 0 (0.0%) | - | 0 (0.0%) |
| blaKPC | 0 (0.0%) | - | 0 (0.0%) |
Table 3.
Antibiotic susceptibility profiles of CRE and CSE isolates
| CRE isolates (n = 76) | CSE isolates (n = 76) | |
|---|---|---|
| Amikacin (AMK) | 53 (69.7%) | 75 (98.7%) |
| Gentamicin (GEN) | 38 (50.0%) | 57 (75.0%) |
| Ciprofloxacin (CIP) | 4 (5.3%) | 32 (42.1%) |
| Ceftriaxone (CRO) | 2 (2.6%) | 48 (63.2%) |
| Cefepime (FEP) | 6 (7.9%) | 58 (76.3%) |
| Imipenem (IPM) | 8 (10.5%) | 76 (100.0%) |
| Meropenem (MEM) | 17 (22.4%) | 76 (100.0%) |
| Ertapenem (ETP) | 3 (3.9%) | 76 (100.0%) |
| Trimethoprim/sulfamethoxazole (SXT) | 15 (19.7%) | 35 (46.1%) |
| Piperacillin/tazobactam (TZP) | 1 (1.3%) | 66 (86.8%) |
| Amoxicillin/clavulanate (AMC) | 0 (0.0%) | 46 (60.5%) |
Table 4.
Susceptibility rates for selected antibiotics in CRE isolates, categorized into CPE based on carbapenemase genes and non-CP-CRE
| Antibiotic agents | blaNDM (n = 35) | blaOXA-48 (n = 30) | blaNDM + blaOXA-48 (n = 7) | Total CPE (n = 58) | Non-CP-CRE (n = 18) | P |
|---|---|---|---|---|---|---|
| AMK | 26 (74.3%) | 16 (53.3%) | 5 (71.4%) | 37 (63.7%) | 16 (88.9%) | 0.043 |
| GEN | 18 (51.4%) | 12 (40.0%) | 2 (28.6%) | 28 (48.3%) | 10 (55.6%) | 0.589 |
| IPM | 0 (0.0%) | 0 (0.0%) | 0 (0.0%) | 0 (0.0%) | 8 (44.4%) | <0.001 |
| MEM | 0 (0.0%) | 4 (13.3%) | 0 (0.0%) | 4 (6.9%) | 13 (72.2%) | <0.001 |
| ETP | 0 (0.0%) | 0 (0.0%) | 0 (0.0%) | 0 (0.0%) | 3 (16.7%) | 0.002 |
| CZA | 1 (2.9%) | 19 (63.3%) | 0 (0.0%) | 20 (34.5%) | 18 (100.0%) | <0.001 |
| CST# | 31 (88.6%) | 27 (90.0%) | 5 (71.4%) | 53 (91.4%) | 14 (77.8%) | 0.119 |
| TGC | 5 (14.3%) | 4 (13.3%) | 1 (14.3%) | 8 (13.8%) | 2 (11.1%) | 0.769 |
| FOF | 15 (42.9%) | 9 (30.0%) | 3 (42.9%) | 21 (36.2%) | 2 (11.1%) | 0.043 |
Table 5.
Minimal inhibitory concentrations for selected antibiotics in CRE isolates, categorized as CPE based on carbapenemase genes and non-CP-CRE.
| blaNDM (n = 35) | blaOXA-48 (n = 30) | blaNDM + blaOXA-48 (n = 7) | Non-CP-CRE (n =1 8) | |||||||||
|---|---|---|---|---|---|---|---|---|---|---|---|---|
| MIC50 | MIC90 | MIC range | MIC50 | MIC90 | MIC range | MIC50 | MIC90 | MIC range | MIC50 | MIC90 | MIC range | |
| AMK | 4 | 128 | 1–>512 | 4 | >512 | 0.25–>512 | 4 | 64 | 1–128 | 2 | 4 | 0.5–512 |
| GEN | 2 | 256 | 0.5–>512 | 32 | >512 | 0.25–>512 | 32 | 128 | 2–512 | 1 | 128 | 0.125–512 |
| IPM | 128 | 256 | 4–512 | 16 | 256 | 2–512 | 128 | 256 | 64–512 | 2 | 4 | 0.06–64 |
| MEM | 128 | 128 | 8–256 | 32 | 128 | 0.5–256 | 128 | 128 | 128–128 | 1 | 4 | 0.06–64 |
| ETP | 256 | 512 | 4–>512 | 256 | 512 | 2–>512 | 512 | 512 | 256–512 | 8 | 256 | 0.5–512 |
| CZA | >256/4 | >256/4 | 1/4–>256/4 | 1.5/4 | >256/4 | 0.125/4–>256/4 | >256/4 | >256/4 | >256/4–>256/4 | 1/4 | 2/4 | 0.19/4–2/4 |
| CST# | 1 | 8 | 0.125–16 | 1 | 2 | 0125–32 | 1 | 8 | 1–16 | 0.5 | 8 | 0.25–16 |
| TGC | 2 | 4 | 0.25–8 | 4 | 8 | 0.5–8 | 2 | 4 | 0.5–8 | 2 | 4 | 0.125–4 |
| FOF | 128 | >512 | 1–>512 | 512 | >512 | 2–>512 | >512 | >512 | 4–>512 | 256 | >512 | 2–>512 |
Table S1.
Primers for detection of extended-spectrum beta-lactamase genes
| Genes | Primer name | Sequence (5′-3′) | Product size (bp) |
|---|---|---|---|
| blaSHV-like | SHV-F | AGGATTGACTGCCTTTTTG | 392 |
| SHV-R | ATTTGCTGATTTCGCTCG | ||
| blaTEM-like | TEM-C | ATCAGCAATAAACCAGC | 516 |
| TEM-H | CCCCGAAGAACGTTTTC | ||
| blaOXA-1-like | OXA-F | ATATCTCTACTGTTGCATCTCC | 619 |
| OXA-R | AAACCCTTCAAACCATCC | ||
| blaCTX-M-like | CTXM-A | CGCTTTGCGATGTGCAG | 550 |
| CTXM-B | ACCGCGATATCGTTGGT | ||
| blaVEB-like | VEB-A | CCTTTTGCCTAAAACGTGGA | 216 |
| VEB-B | TGCATTTGTTCTTCGTTTGC |
Table S2.
Primers for detection of carbapenemase genes
| Genes | Primer name | Sequence (5′-3′) | Product size (bp) |
|---|---|---|---|
| blaIMP-like | IMP-F | GGAATAGAGTGGCTTAAYTCT | 188 |
| IMP-R | CCAAACYACTASGTTATCT | ||
| blaVIM-like | VIM-F | GATGGTGTTTGGTCGCATA | 390 |
| VIM-R | CGAATGCGCAGCACCAG | ||
| blaOXA-48-like | OXA-48-F | GCGTGGTTAAGGATGAACAC | 438 |
| OXA-48-R | CATCAAGTTCAACCCAACCG | ||
| blaNDM-like | NDM-F | GGTTTGGCGATCTGGTTTTC | 621 |
| NDM-R | CGGAATGGCTCATCACGATC | ||
| blaKPC-like | KPC-F | CGTCTAGTTCTGCTGTCTTG | 798 |
| KPC-R | CTTGTCATCCTTGTTAGGCG |
Table S3.
Susceptibility rates and minimal inhibitory concentrations for studied antibiotics in CRE isolates, grouped by their species
| Types of CRE | Total isolates | AMK | GEN | CIP | CRO | FEP | IPM | MEM | ETP | SXT | TZP | CZA | CST# | TGC | FOF |
|---|---|---|---|---|---|---|---|---|---|---|---|---|---|---|---|
| Klebsiella pneumoniae | 55 | 35 (63.6%) | 31 (56.4%) | 3 (5.5%) | 1 (1.8%) | 4 (7.3%) | 4 (7.3%) | 12 (21.8%) | 2 (3.6%) | 11 (20.0%) | 1 (1.8%) | 29 (52.7%) | 47 (85.8%) | 3 (5.5%) | 12 (21.8%) |
| MIC50 | 4 | 2 | 128 | >512 | 512 | 64 | 32 | 256 | 64/1216 | >256/4 | 2/4 | 1 | 2 | 256 | |
| MIC90 | >512 | >512 | >512 | >512 | >512 | 256 | 128 | 512 | >512/9728 | >256/4 | >256/4 | 8 | 8 | >512 | |
| MIC range | 0.25–>512 | 0.125–>512 | 0.125–>512 | 1–>512 | 0.125–>512 | 0.06–512 | 0.06–256 | 0.5–>512 | 0.25/4.75–>512/9728 | 4/4–>256/4 | 0.125/4–>256/4 | 0.125–32 | 0.125–8 | 16–>512 | |
| Escherichia coli | 16 | 13 (81.3%) | 5 (31.3%) | 0 (0.0%) | 1 (6.3%) | 1 (6.3%) | 1 (6.3%) | 1 (6.3%) | 0 (0.0%) | 2 (12.5%) | 0 (0.0%) | 4 (25.0%) | 16 (100%) | 7 (43.8%) | 11 (68.8%) |
| MIC50 | 4 | 32 | 256 | >512 | 512 | 64 | 64 | 256 | 128/2432 | >256/4 | >256/4 | 0.5 | 1 | 8 | |
| MIC90 | 64 | 128 | >512 | >512 | >512 | 256 | 128 | 512 | 256/4864 | >256/4 | >256/4 | 1 | 1 | >512 | |
| MIC range | 1–512 | 1–512 | 0.5–>512 | 1–>512 | 2–>512 | 0.5–256 | 0.5–128 | 4–512 | 0.5/9.5–>512/9728 | 32/4–>256/4 | 0.75/4–>256/4 | 0.125–2 | 0.25–2 | 1–>512 | |
| Enterobacter cloacae complex | 5 | 5 (100%) | 2 (40.0%) | 1 (20.0%) | 0 (0.0%) | 1 (20.0%) | 3 (60.0%) | 4 (80.0%) | 1 (20.0%) | 2 (40.0%) | 0 (0.0%) | 5 (100%) | 4 (80.0%) | 0 (0.0%) | 0 (0.0%) |
| MIC50 | 4 | 8 | 16 | 256 | 4 | 0.5 | 1 | 8 | 32/608 | 32/4 | 0.75/4 | 0.5 | 1 | 256 | |
| MIC90 | 4 | 32 | >512 | 512 | 512 | 4 | 4 | 256 | 256/4864 | 256/4 | 2/4 | 16 | 2 | 512 | |
| MIC range | 0.5–4 | 0.125–32 | 0.03–>512 | 64–>512 | 1–>512 | 0.25–4 | 0.125–4 | 0.5–256 | 0.25/4.75–256/4864 | 32/4–256/4 | 0.25/4–2/4 | 0.25–16 | 1–2 | 128–>512 | |
| Total CRE isolates | 76 | 53 (69.7%) | 38 (50.0%) | 4 (5.3%) | 2 (2.6%) | 6 (7.9%) | 8 (10.5%) | 17 (22.4%) | 3 (3.9%) | 15 (19.7%) | 1 (1.3%) | 38 (50.0%) | 67 (88.2%) | 10 (13.2%) | 23 (30.3%) |
| MIC50 | 4 | 8 | 128 | >512 | 512 | 32 | 32 | 256 | 64/1216 | >256/4 | >256/4 | 1 | 2 | 256 | |
| MIC90 | 512 | 512 | >512 | >512 | >512 | 256 | 128 | 512 | >512/9728 | >256/4 | >256/4 | 8 | 4 | 512 | |
| MIC range | 0.25–>512 | 0.125–>512 | 0.03–>512 | 1–>512 | 0.125–>512 | 0.06–512 | 0.06–256 | 0.5–>512 | 0.25/4.75–>512/9728 | 4/4–>256/4 | 0.125/4–>256/4 | 0.125–32 | 0.125–8 | 1–>512 |