
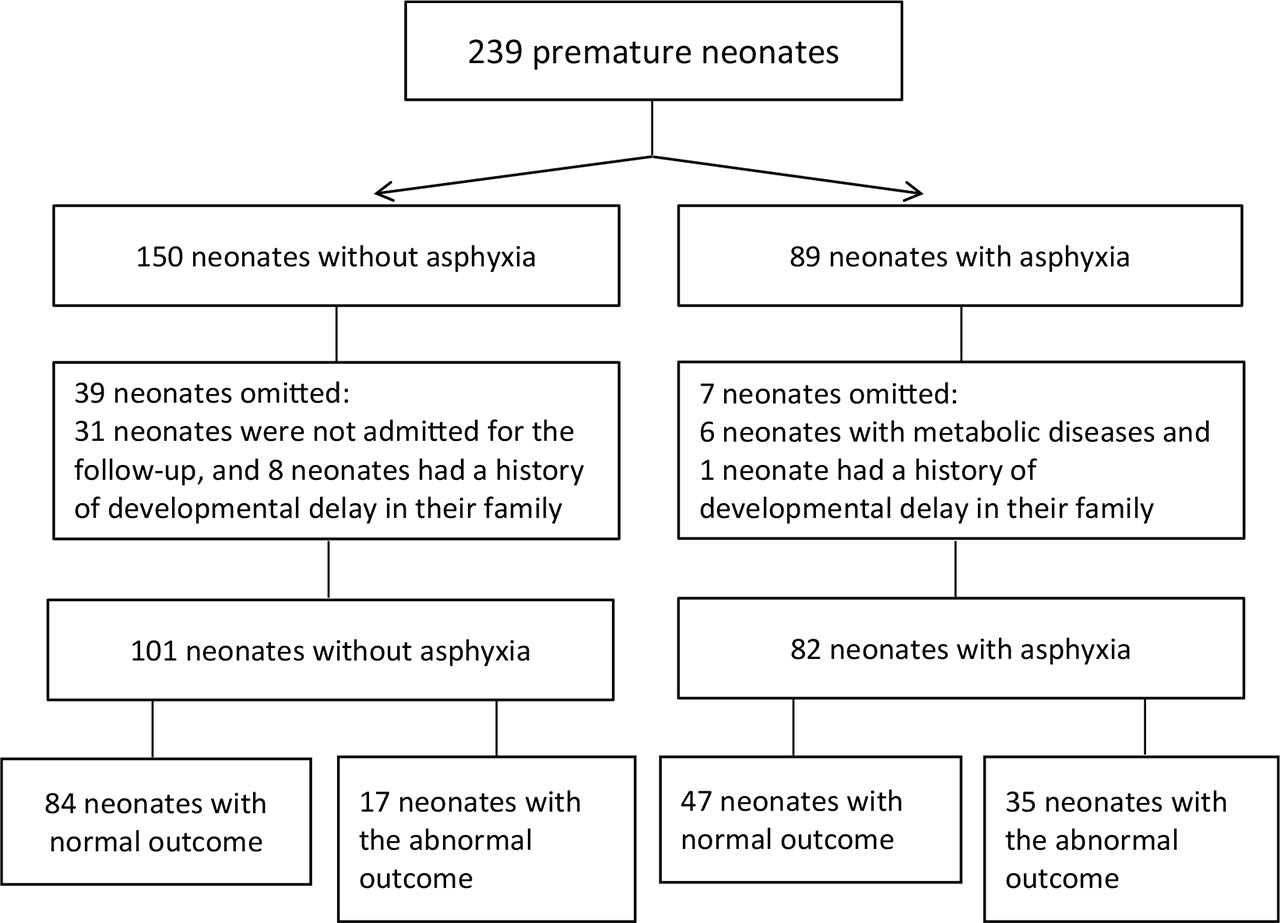
Figure 1.
Selected neonates.
The flowchart presents the division and outcomes of 239 premature neonates into two groups: 150 neonates without asphyxia and 89 neonates with asphyxia.
1. **Neonates without asphyxia**:
- 39 neonates omitted: 31 were not admitted for follow-up, and 8 had a family history of developmental delay.
- 101 neonates without asphyxia remained.
- Outcomes: 84 neonates had normal outcomes, while 17 neonates had abnormal outcomes.
2. **Neonates with asphyxia**:
- 7 neonates omitted: 6 had metabolic diseases, and 1 had a family history of developmental delay.
- 82 neonates with asphyxia remained.
- Outcomes: 47 neonates had normal outcomes, while 35 neonates had abnormal outcomes.
Table 1.
The comparison between clinical and laboratory parameters of mothers and neonates in two groups of neonates with asphyxia and without asphyxia
This table compares neonates with and without asphyxia. Significant differences were found in gestational age, first PH, Apgar scores (1st and 5th minute), and birth weight, with the asphyxia group having lower first PH and Apgar scores but higher birth weight. Mother's age also differed, with younger mothers in the asphyxia group. Parity showed no significant difference.
| Variables Groups | Neonates without asphyxia n = 82 | Neonates with asphyxia n = 101 | P (T–Test) |
|---|---|---|---|
| Mother's age (year) | 7.99 ± 27.12 | 6.50 ± 29.69 | 0.006 |
| Parity | 1.48 ± 2.02 | 1.39 ± 2.18 | 0.368 |
| Gestational age (week) | 32.45 ± 2.48 | 33.55 ± 3.00 | 0.013 |
| First PH | 7.29 ± 0.10 | 7.19 ± 0.13 | 0.000 |
| First minute Apgar Score | 7.20 ± 1.69 | 4.32 ± 1.49 | 0.000 |
| Fifth minute Apgar score | 8.70 ± 1.26 | 6.47 ± 1.81 | 0.000 |
| Birth Weight (gr) | 1575.24 ± 505.61 | 2135.89 ± 749.48 | 0.000 |
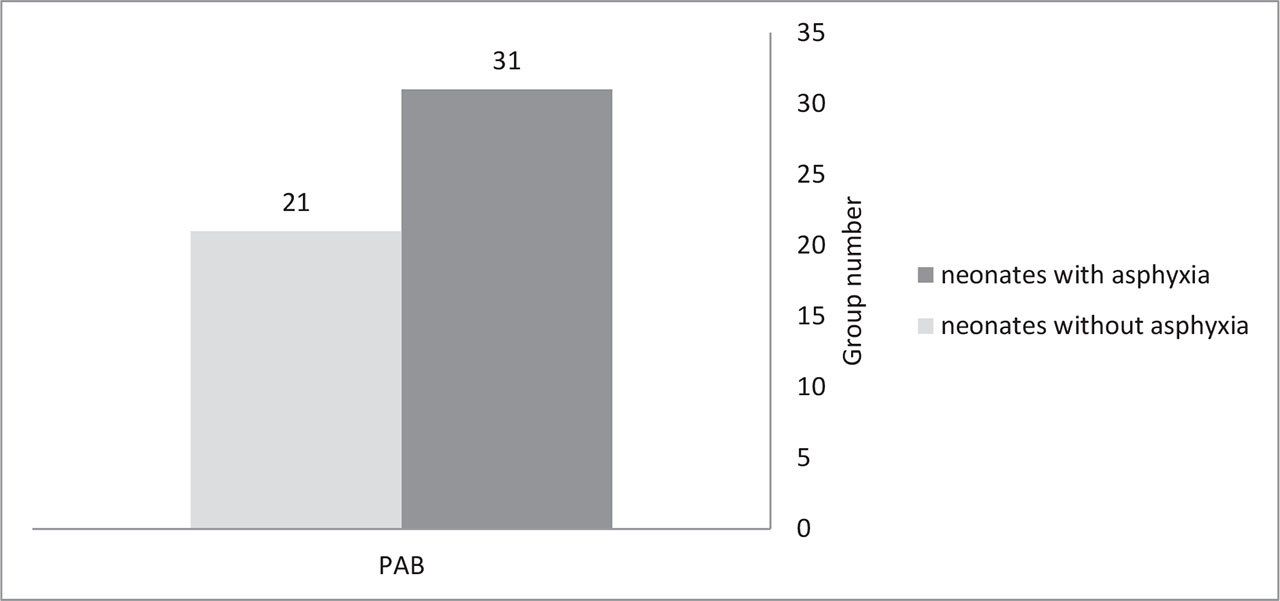
Figure 2.
The comparison of mean PAB in neonates with and without asphyxia. PAB, prooxidant–antioxidant balance.
The bar chart compares the number of neonates with asphyxia and neonates without asphyxia in relation to PAB (presumably some biomarker or condition). The following data points are shown:
- Neonates with asphyxia (dark gray bar): 31 neonates.
- Neonates without asphyxia (light gray bar): 21 neonates.
The Y-axis represents the group number, ranging from 0 to 35, and the X-axis is labeled "PAB."
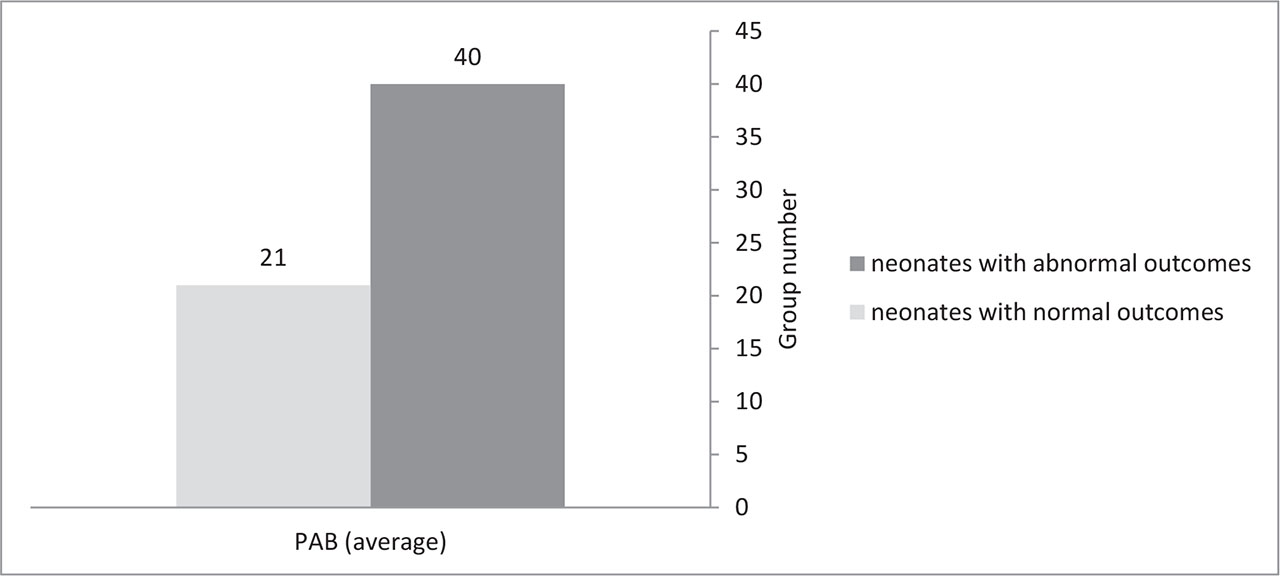
Figure 3.
The comparison of PAB in the two groups of neonates with normal or abnormal outcomes. PAB, prooxidant–antioxidant balance.
The bar chart compares the number of neonates with abnormal outcomes and neonates with normal outcomes in relation to the average PAB value. The following data points are presented:
- Neonates with abnormal outcomes (dark gray bar): 40 neonates.
- Neonates with normal outcomes (light gray bar): 21 neonates.
The Y-axis represents the group number, ranging from 0 to 45, and the X-axis is labeled "PAB (average)."
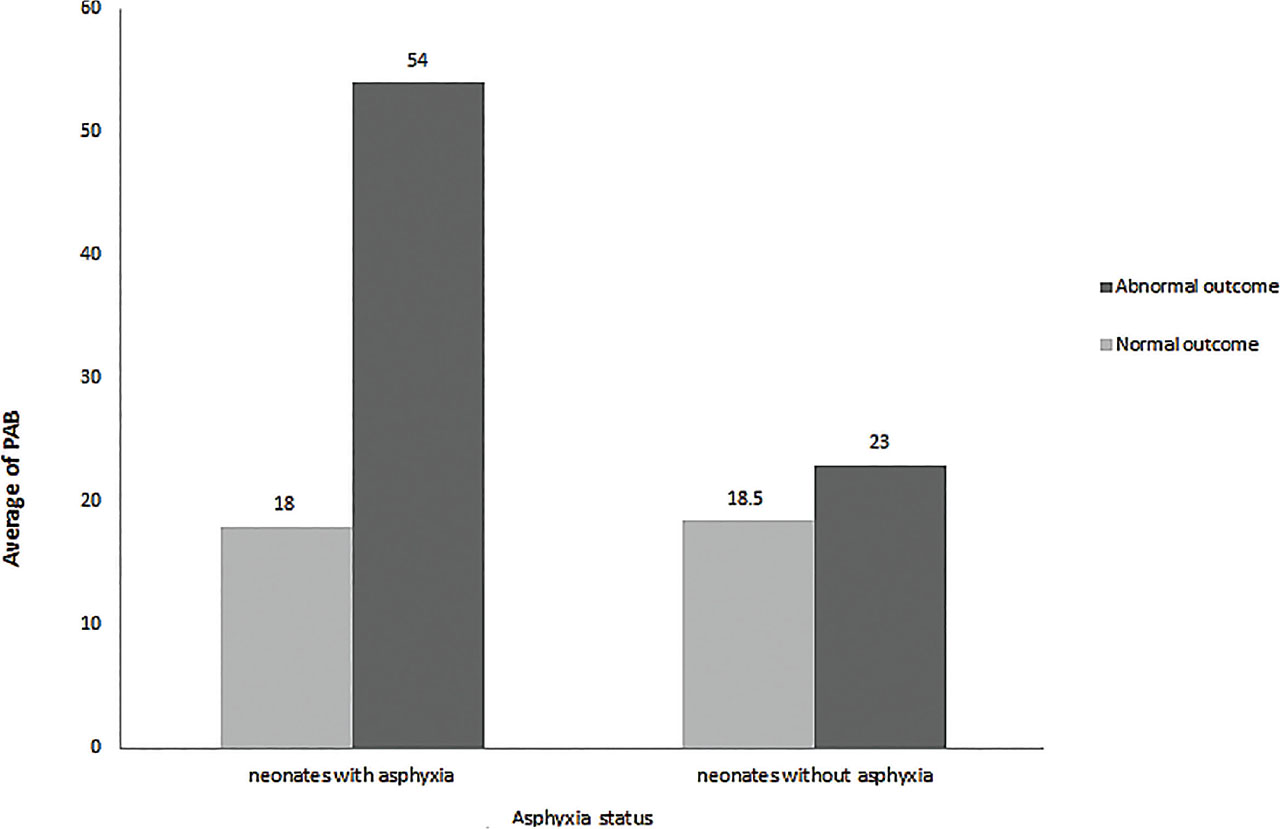
Figure 4.
The comparison of PAB in two groups of neonates based of having or not having asphyxia; having normal or abnormal outcomes. PAB, prooxidant–antioxidant balance.
The bar chart shows the average PAB values for neonates divided by asphyxia status and outcome (normal or abnormal). The following values are presented:
- Neonates with asphyxia:
- Normal outcome: 18 average PAB
- Abnormal outcome: 54 average PAB
- Neonates without asphyxia:
- Normal outcome: 18.5 average PAB
- Abnormal outcome: 23 average PAB
The Y-axis represents the average of PAB, ranging from 0 to 60. The X-axis is labeled "Asphyxia status" and divided into two groups: neonates with asphyxia and neonates without asphyxia. The legend shows dark gray bars for "Abnormal outcome" and light gray bars for "Normal outcome."