
Table 1
Donor patient characteristics and wet weights of cartilage harvested
| Patient characteristic | No. of patients | % of total patients | Mean yield of wet cartilage ± SD (mg) | |
|---|---|---|---|---|
| Age (y) | 50–59 | 1 | 6 | 3430 |
| 60–69 | 6 | 33 | 3760 ± 1489 | |
| 70–79 | 8 | 44 | 4211 ± 1716 | |
| 80–89 | 3 | 17 | 2740 ± 1221 | |
| Sex | Male | 6 | 33 | 3708 ± 1035 |
| Female | 12 | 67 | 3804 ± 1781 | |
| Diagnosis | Femoral neck fracture | 11 | 61 | 3245 ± 1137 |
| Femoral head necrosis | 4 | 22 | 3253 ± 765 | |
| Hip osteoarthritis | 1 | 6 | 6450 | |
| Knee osteoarthritis | 2 | 11 | 6370 | |
[i] SD, standard deviation.
Table 2
Donor patient characteristics and wet weight of harvested cartilage for each treatment group
| Group No. (cartilage treatment; sample size) | Patient No. | Age (y) | Sex | Diagnosis | Wet weight of cartilage (mg) (mean ± SD) |
|---|---|---|---|---|---|
| I (Pronase E + Collagenase IA; n = 11) | 1 | 76 | F | Left femoral neck fracture | 4396 ± 1546 |
| 2 | 62 | M | Right femoral head necrosis | ||
| 3 | 62 | F | Right femoral head necrosis | ||
| 4 | 81 | F | Right femoral neck fracture | ||
| 5 | 77 | M | Left femoral neck fracture | ||
| 6 | 62 | F | Left femoral neck fracture | ||
| 7 | 61 | F | Right knee osteoarthritis | ||
| 8 | 74 | M | Left femoral neck fracture | ||
| 9 | 75 | F | Left knee osteoarthritis | ||
| 10 | 70 | F | Right hip osteoarthritis | ||
| 11 | 79 | F | Left femoral neck fracture | ||
| II (Collagenase II; n = 5) | 12 | 83 | F | Left femoral neck fracture | 2854 ± 876.5 |
| 13 | 67 | F | Right femoral head necrosis | ||
| 14 | 55 | M | Right femoral head necrosis | ||
| 15 | 72 | F | Right femoral neck fracture | ||
| 16 | 87 | M | Left femoral neck fracture | ||
| III (Pronase E + Collagenase II; n = 2) | 17 | 64 | M | Left femoral neck fracture | 2640 |
| 18 | 72 | F | Left femoral neck fracture |
[i] SD, standard deviation; M, male; F, female.
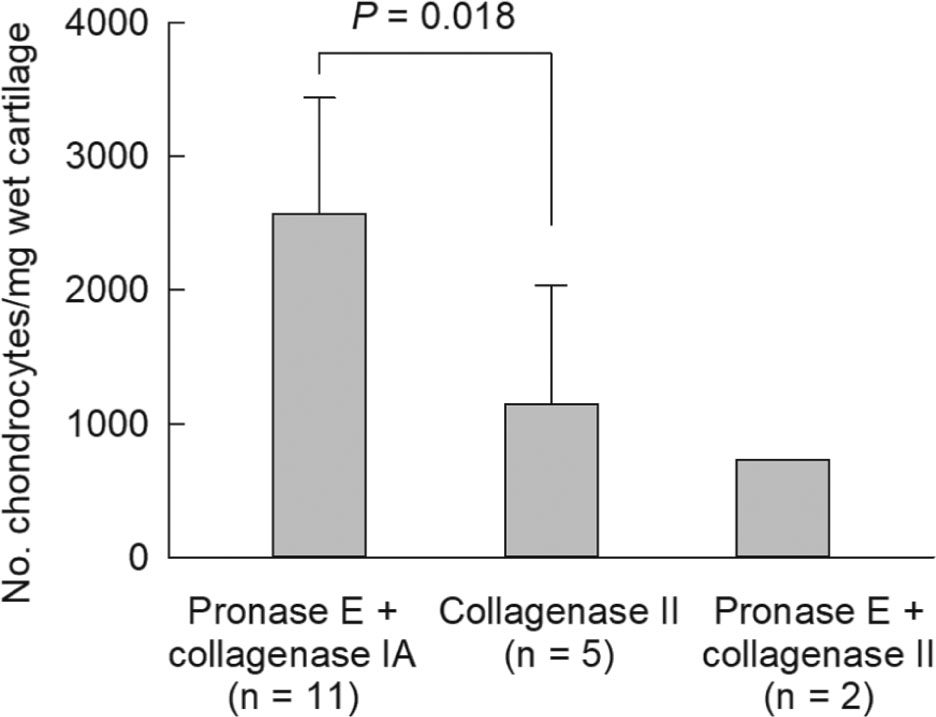
Figure 1
Comparison of cell yield between 3 chondrocyte isolation methods. Chondrocytes were isolated from elderly human articular cartilage using 3 methods. We divided cartilage slices in 3 groups: Group I, digested sequentially with pronase E and collagenase IA; Group II, digested with collagenase II only; or Group III, digested sequentially with pronase E and collagenase II. After digestion, total cell number was counted and mean cell yield (No. of chondrocytes per mg wet weight of cartilage) is plotted. We compared the difference in cell yield between Groups I and II with a 2-tailed t test assuming unequal variances. Error bars represent SD. SD, standard deviation.
Table 3
Donor patient characteristics and chondrocyte yield for each treatment group
| Treatment | Characteristic | No. of patients | Chondrocyte yield (mean cells ±SD) | |
|---|---|---|---|---|
| Group I (n = 11): pronase E + collagenase IA | Age (y) | 60–69 | 4 | 2940 ± 629 |
| 70–79 | 6 | 2390 ± 1050 | ||
| 80–89 | 1 | 2130 | ||
| Sex | Male | 3 | 2514 ± 601 | |
| Female | 8 | 2586 ± 992 | ||
| Diagnosis | Femoral neck fracture | 6 | 2587 ± 1056 | |
| Femoral head necrosis | 2 | 3002 | ||
| Hip osteoarthritis | 1 | 3030 | ||
| Knee osteoarthritis | 2 | 1837 | ||
| Group II (n = 5): collagenase II | Age (y) | 50–59 | 1 | 2729 |
| 60–69 | 1 | 747 | ||
| 70–79 | 1 | 669 | ||
| 80–89 | 2 | 789 | ||
| Sex | Male | 2 | 1702 | |
| Female | 3 | 773 ± 119 | ||
| Diagnosis | Femoral neck fracture | 3 | 749 ± 133 | |
| Femoral head necrosis | 2 | 1738 | ||
| Group III (n = 2): pronase E + collagenase II | Age (y) | 60–69 | 1 | 1291 |
| 70–79 | 1 | 170 | ||
| Sex | Male | 1 | 1291 | |
| Female | 1 | 170 | ||
| Diagnosis | Femoral neck fracture | 2 | 730 | |
[i] SD, standard deviation.
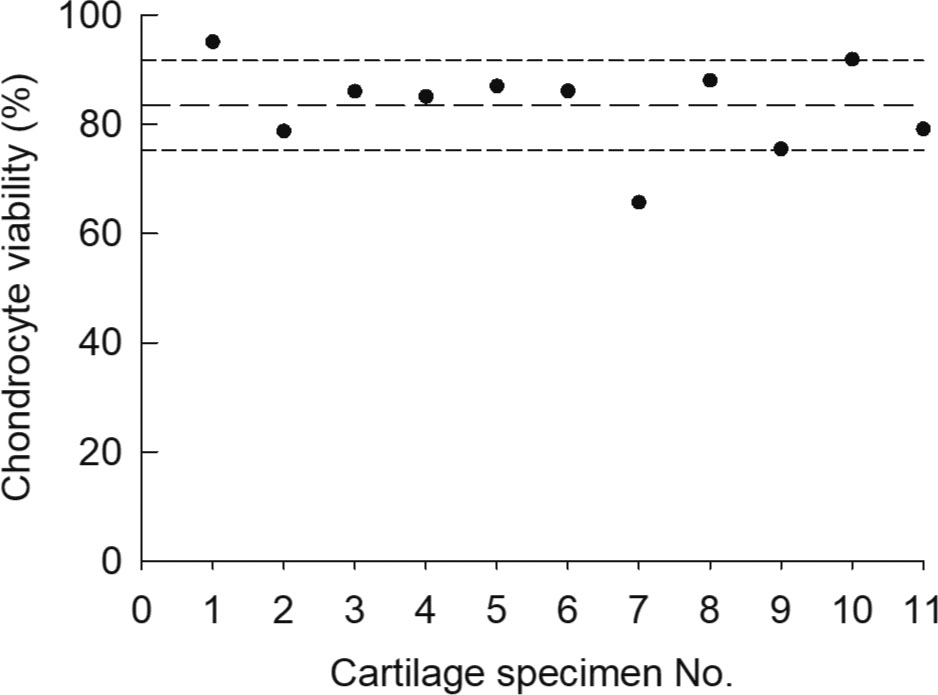
Figure 2
Viability of chondrocytes isolated from 11 cartilage specimens using pronase E and collagenase IA. Cartilage specimens obtained from 11 patients were first incubated with 0.4% pronase E and then with 0.02% collagenase IA. The viability of chondrocytes isolated from each patient is plotted. The long dashed line indicates the mean level of chondrocyte viability (84%) computed from 11 specimens. The short dashed lines indicate one standard deviation from the mean (8%).
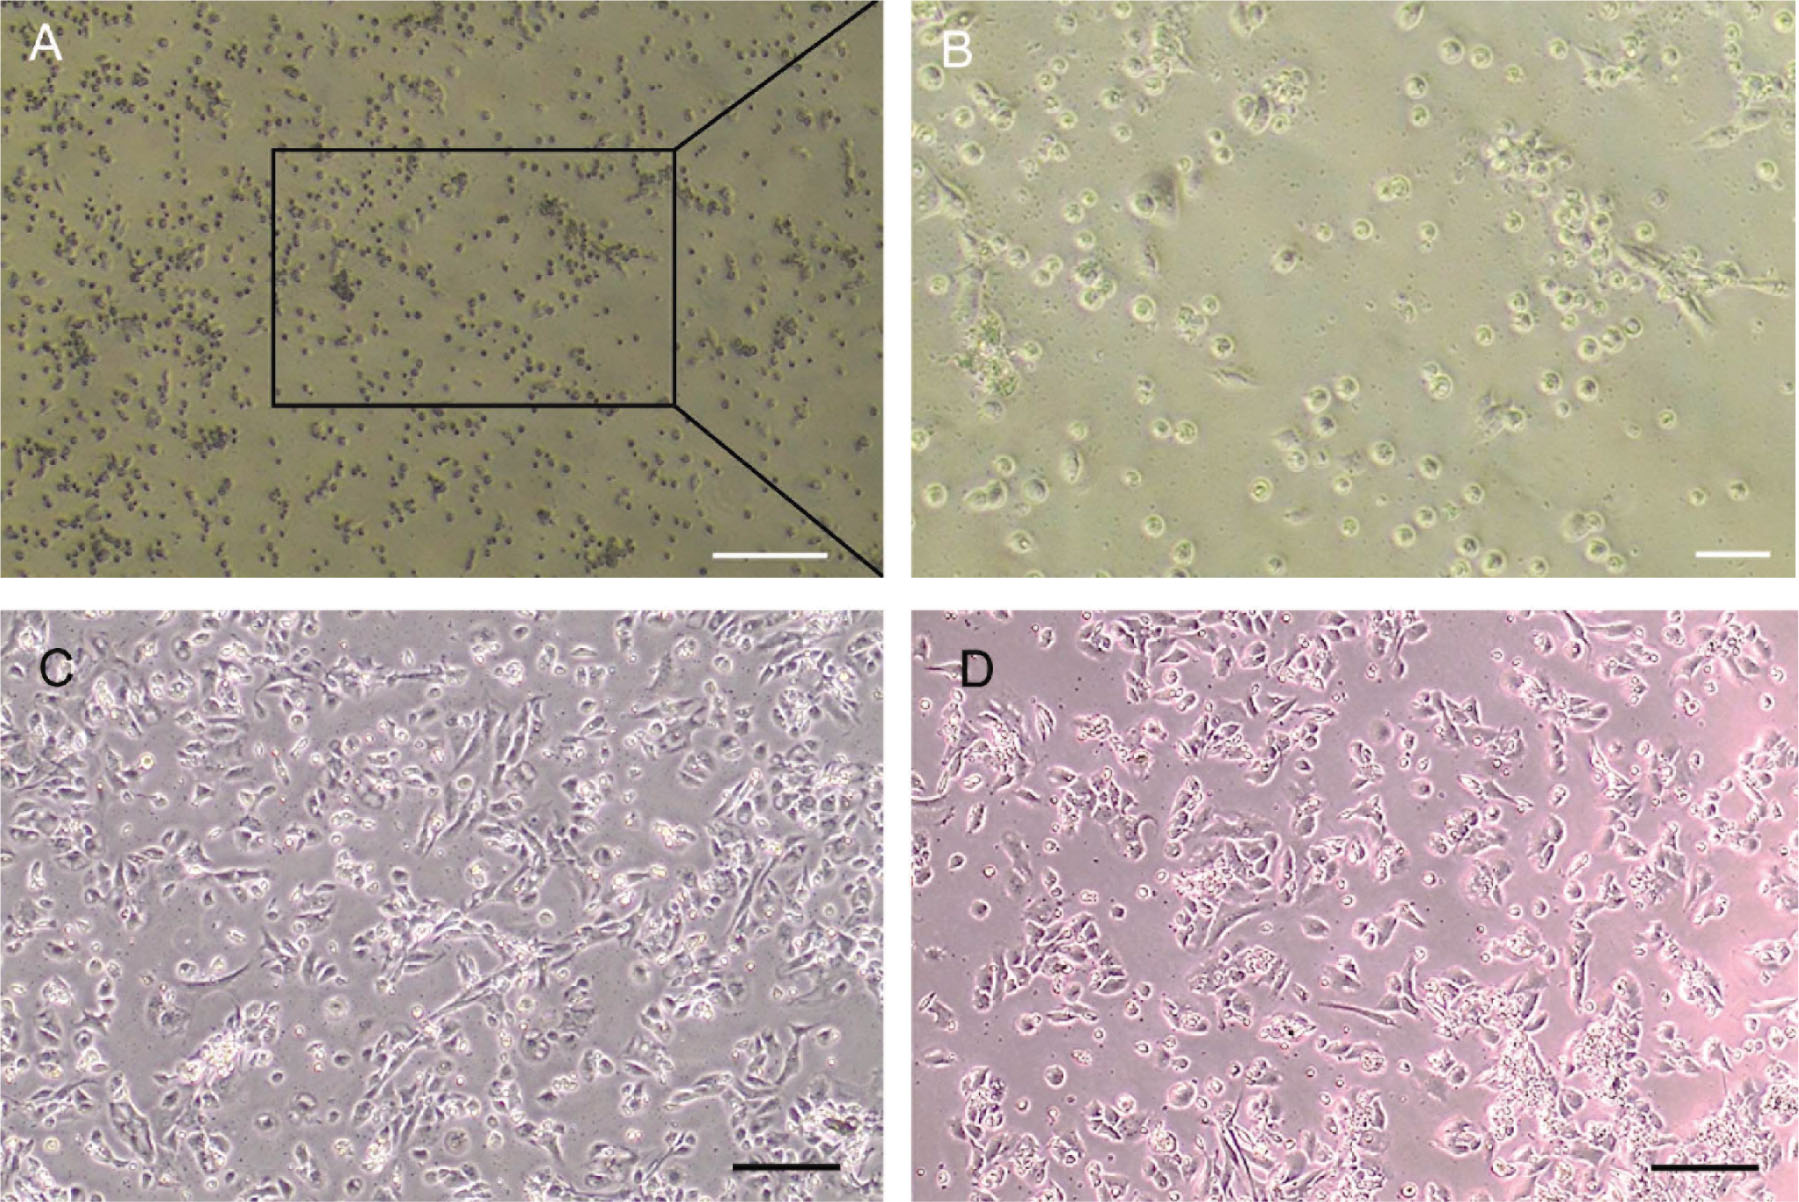
Figure 3
Representative light microscopic images of monolayer human chondrocytes. (A) Passage 0 human chondrocytes isolated with pronase E and collagenase IA seeded at 2.5 × 10⁵ cells per cm2 and visualized at day 2 post-seeding (4× objective lens, scale bar 200 μm) and (B) detail of the insert in the black square as imaged with a 10× objective (scale bar 50μm). (C) Passage 0 chondrocytes at day 10 post-seeding imaged with a 4× objective (scale bar 200 μm). (D) Passage 1 chondrocytes at day 1 post-seeding imaged with a 10× objective (scale bar 200 μm).