
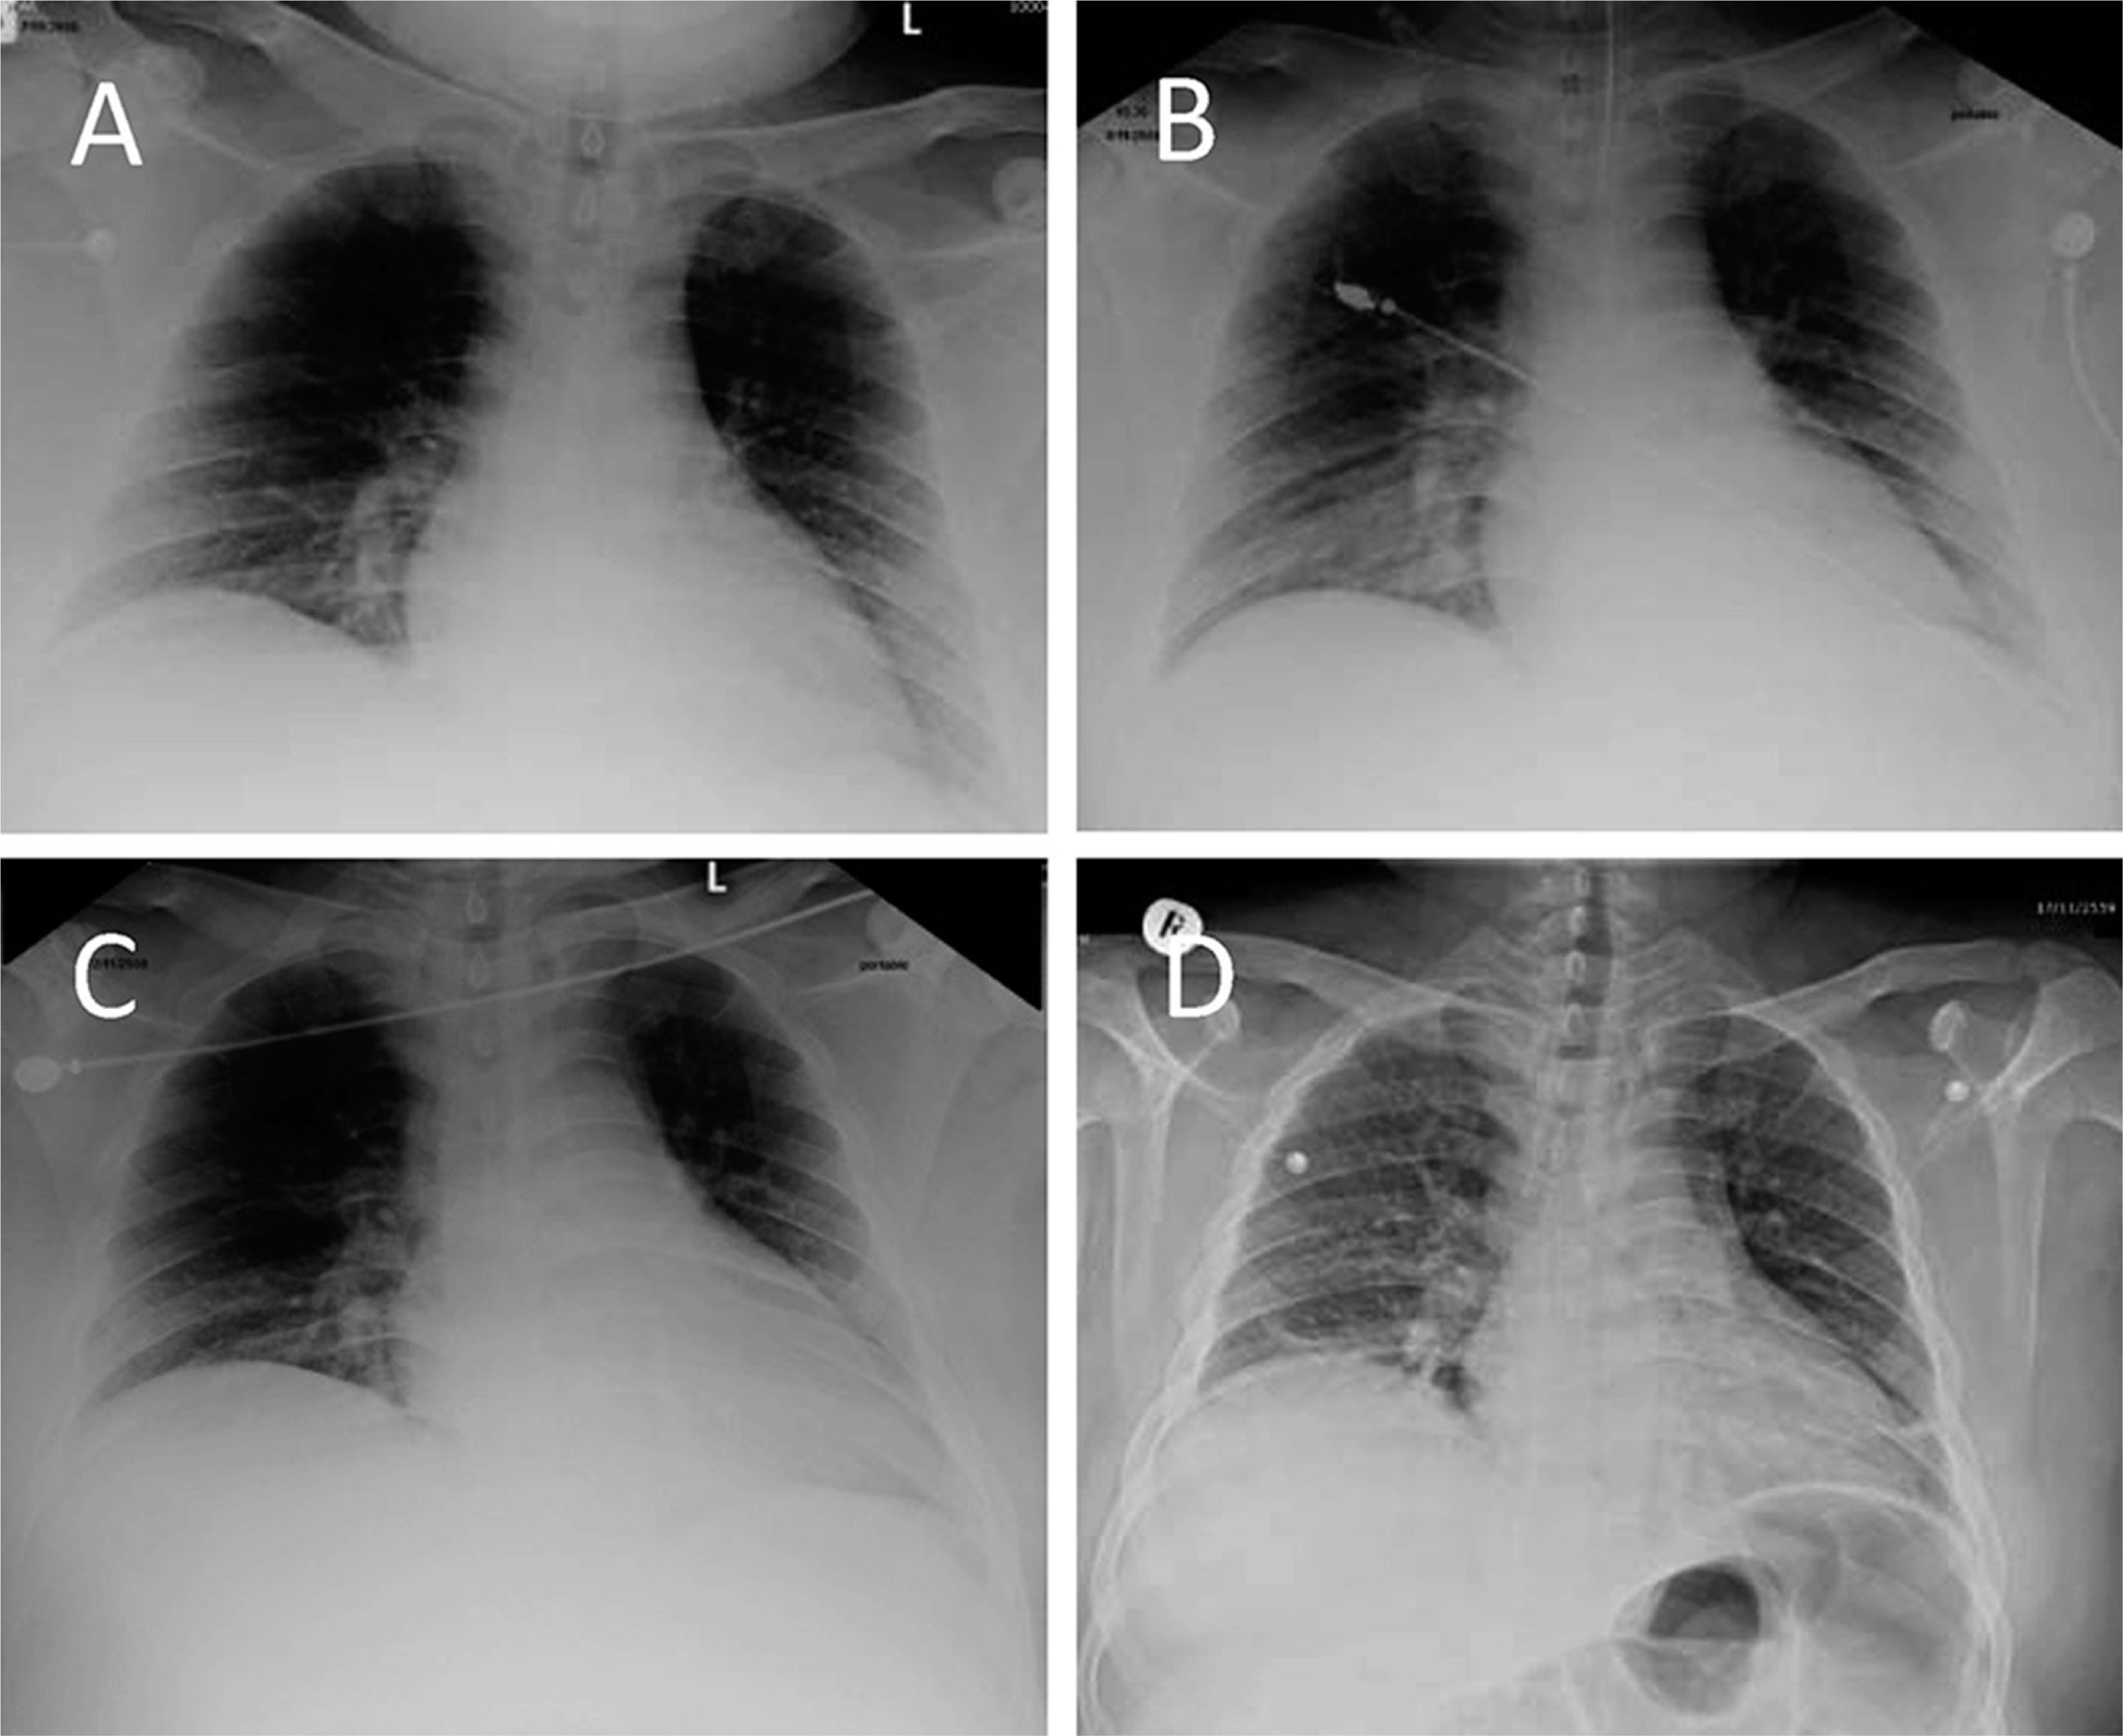
Figure 1
A. Posterior–anterior chest X-ray image demonstrating a slight radiographic sign that suggests interstitial pulmonary edema. B. Supine radiogram demonstrating redistribution of lung circulation from base to middle, suggestive of pulmonary congestion. C. Endotracheal tube inserted after persistent pulmonary congestion. D. Posterior–anterior chest X-ray image showing with normal lung marking and heart size.
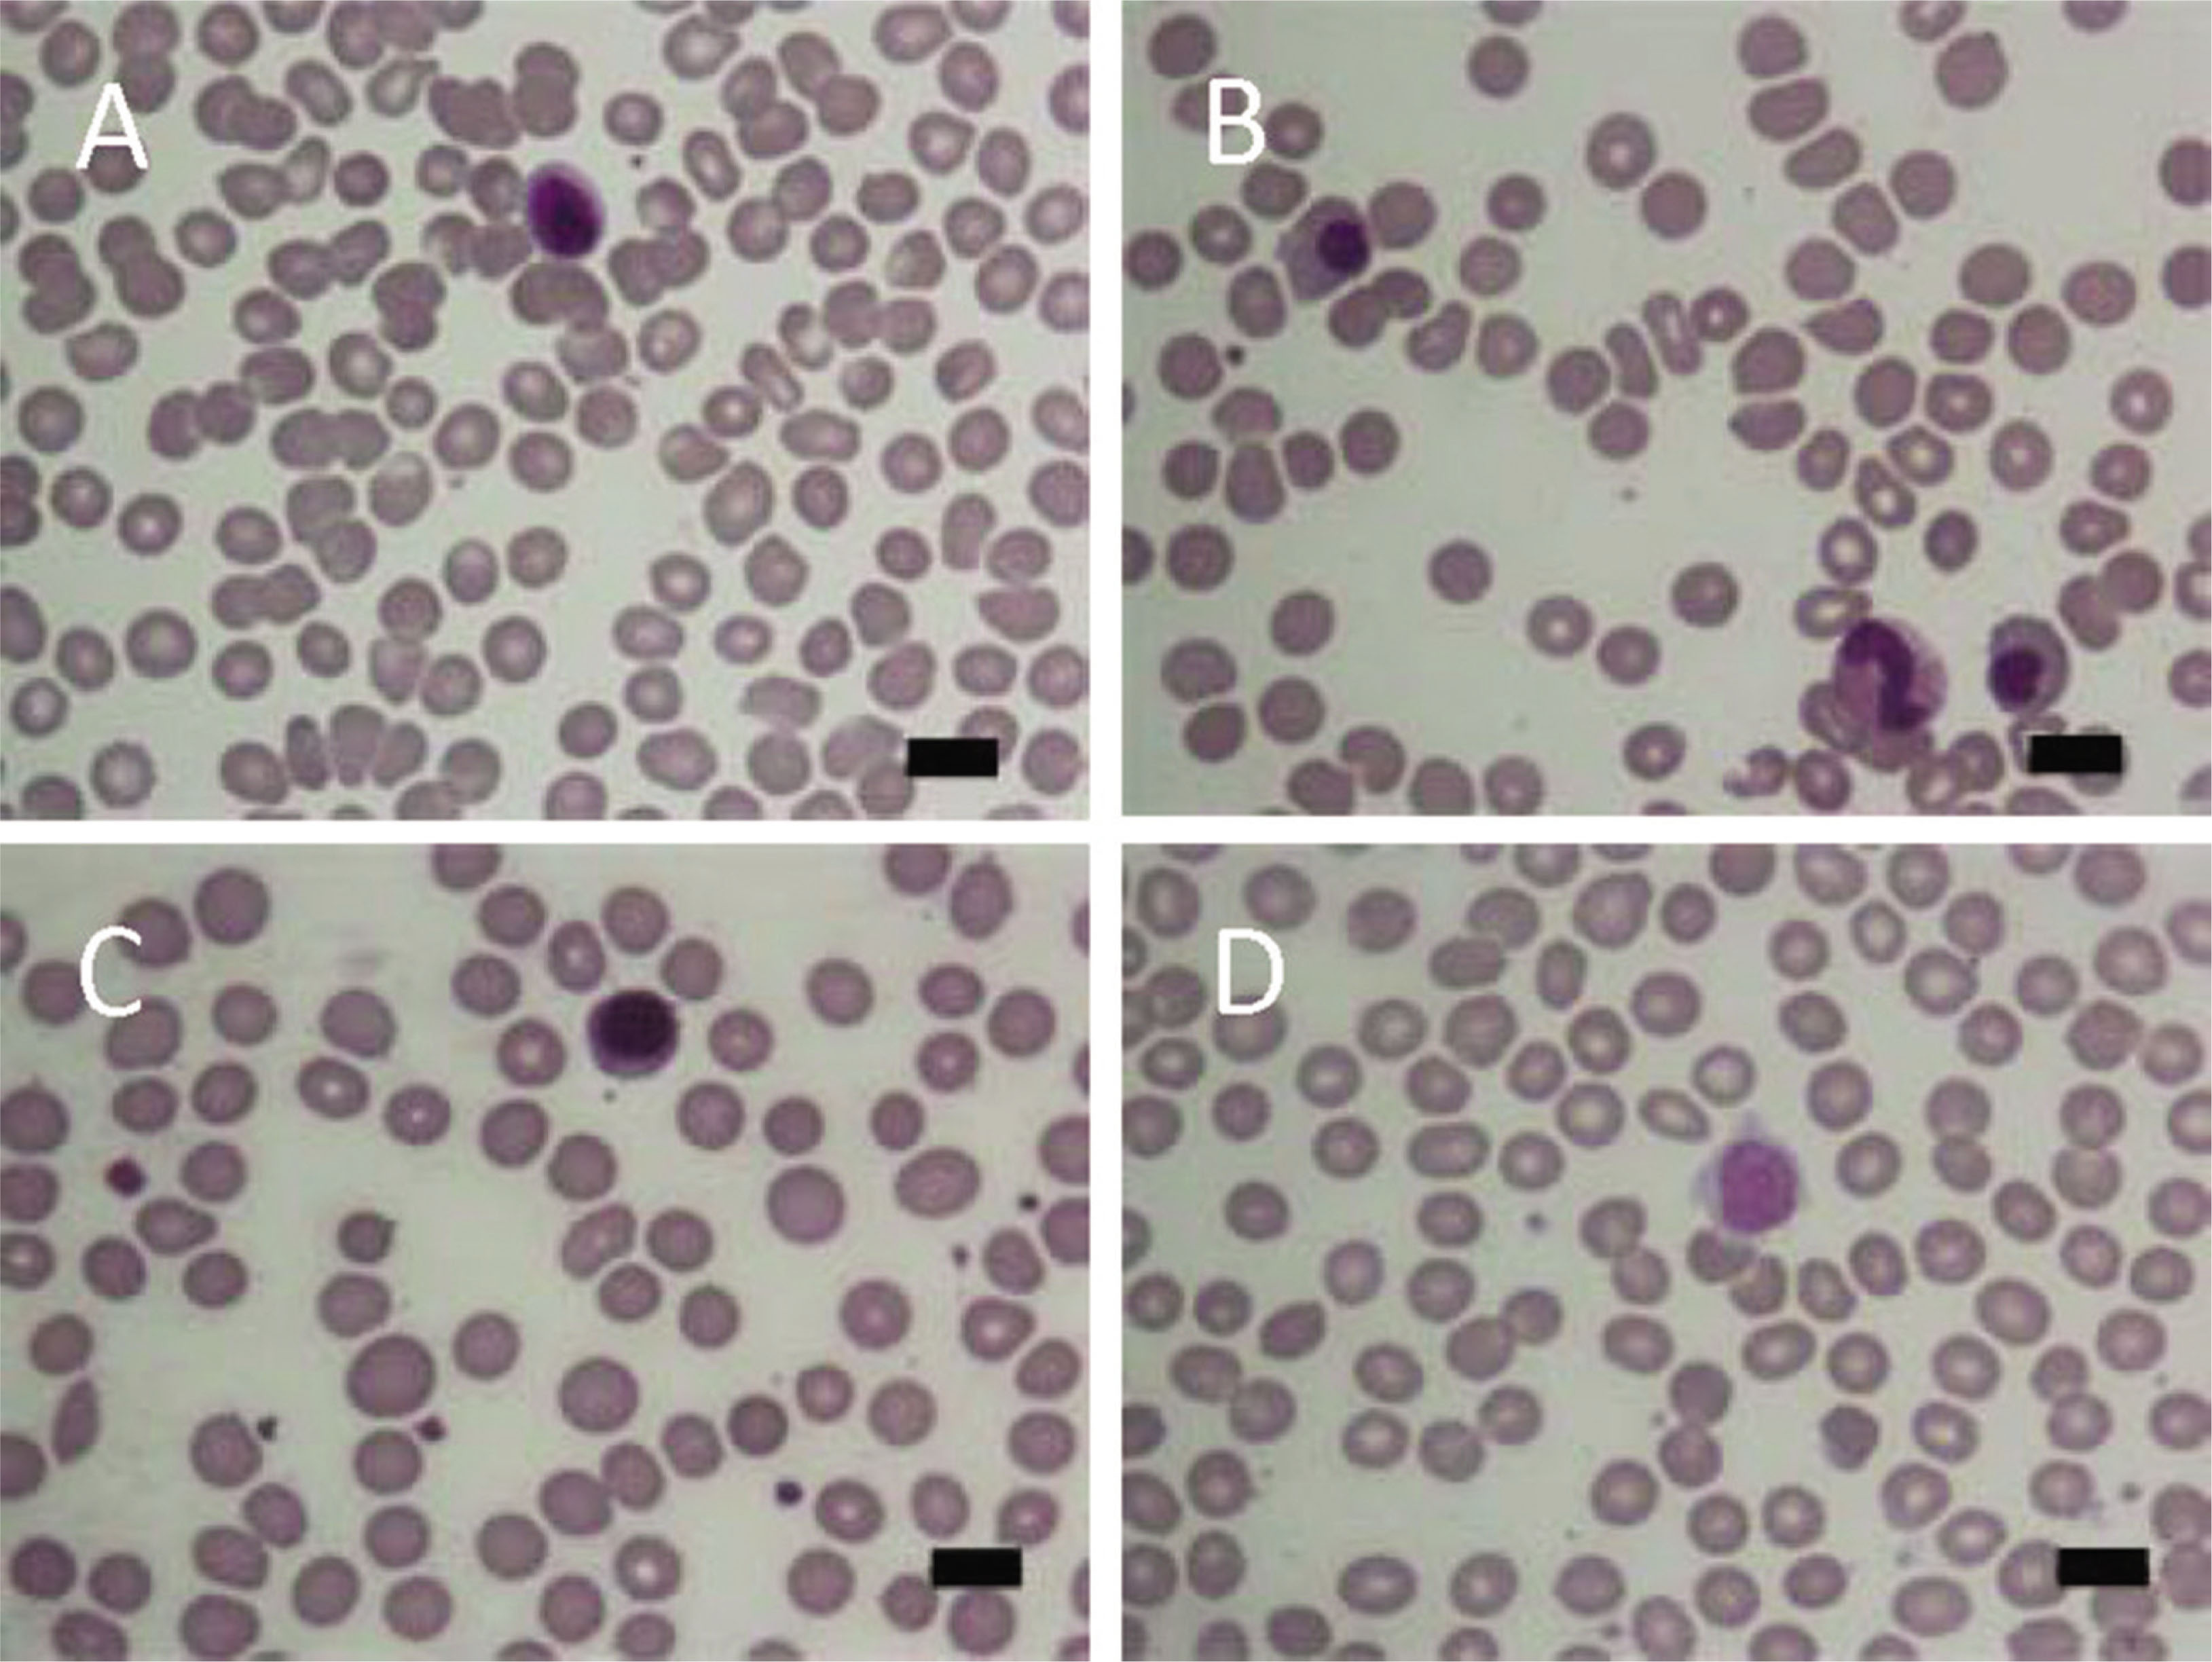
Figure 2
A. Peripheral blood smear during febrile phase showing normochromic and normocytic red blood cells, white blood cells with predominating lymphocytes and atypical lymphocytes, with slight thrombocytopenia. B. Peripheral blood smear (during shock stage with intractable bleeding on the first week of hospitalization) showing a decreased number of red blood cells with nucleated red blood cells, and a scanty number of platelets. C. Peripheral blood smear on the second week of hospitalization, showing microspherocytes, polychromasia of red blood cells with predominating polychromatosis, white blood cells, and platelets within normal reference ranges. D. Peripheral blood smear during recovery phase showing red blood cells, white blood cells, and platelets within normal reference ranges. All micrographs are shown with Wright–Giemsa staining (original magnification×1000). Scale bars indicate 10 μm.
Table 1
Progression of an autoimmune hemolytic anemia that developed during severe dengue infection
| Characteristic | Day of hospitalization and follow-up | |||||||||
|---|---|---|---|---|---|---|---|---|---|---|
| D1 | D3 | D5 | D7 | D9 | D11 | D13 | D21 (D/C) | D30 (OPD) | D90 (OPD) | |
| Body temperature (°C) | 39.0 | 41.0 | 38.5 | 38.6 | 37.5 | 37.0 | 37.4 | 36.8 | NA | NA |
| Pulse pressure | 24 | 22 | 59 | 55 | 55 | 53 | 53 | 41 | 54 | 48 |
| Bleeding site | ||||||||||
| Hemoptysis | − | ++ | +++ | − | − | − | − | − | − | − |
| Ecchymosis | ++ | ++ | ++ | + | + | − | − | − | − | − |
| Hematuria | − | + | + | − | − | − | − | − | − | − |
| CBC | ||||||||||
| Hemoglobin (g/dL) | 15.8 | 10.9 | 9.5 | 10.5 | 10.1 | 9.1 | 8.7 | 10.0 | 12.6 | 14.4 |
| White blood cells count (cells/mm3) | 3,500 | 3,600 | 5,000 | 4,700 | 5,300 | 4,500 | 5,200 | 4,200 | 4,700 | 6,000 |
| Platelet count (cells/mm3) | 15,000 | 13,000 | 17,000 | 87,00 | 90,00 | 99,00 | 117,000 | 190,000 | 182,000 | 165,000 |
| LFT | ||||||||||
| AST (U/L) | 2,476 | 7,425 | NA | 2,587 | NA | 386 | NA | 215 | 65 | NA |
| ALT (U/L) | 1,273 | 2,125 | NA | 1,072 | NA | 355 | NA | 218 | 105 | NA |
| DCT | NA | ++ | + | − | − | |||||
| Medication | ||||||||||
| rVIIa | − | 1st time | 2nd time† | − | − | − | − | − | − | − |
| Carbapenam | − | − | + | + | + | + | + | − | − | − |
| Blood component transfusion | ||||||||||
| LPRC | − | 1 | 6 | 1 | − | − | − | − | − | − |
| LPPC/SDP | − | 1/0 | 3/1 | 1/0 | − | − | − | − | − | − |
| FFP | − | − | 3 | − | − | − | − | − | − | − |
| Cryoprecipitate | − | − | 10 | − | − | − | − | − | − | − |
AST, aspartate aminotransferase; ALT, alanine aminotransferase; CBC, complete blood count; D/C, discharge from hospital; DCT, direct Coombs test; FFP, fresh frozen plasma; LFT, liver function test; LPPC, leukocyte-poor platelet concentration; LPRC, leukocyte-poor packed red cells; NA, not applicable; OPD, outpatient department; rVIIa, recombinant activated factor VII; SDP, single donor platelets.