
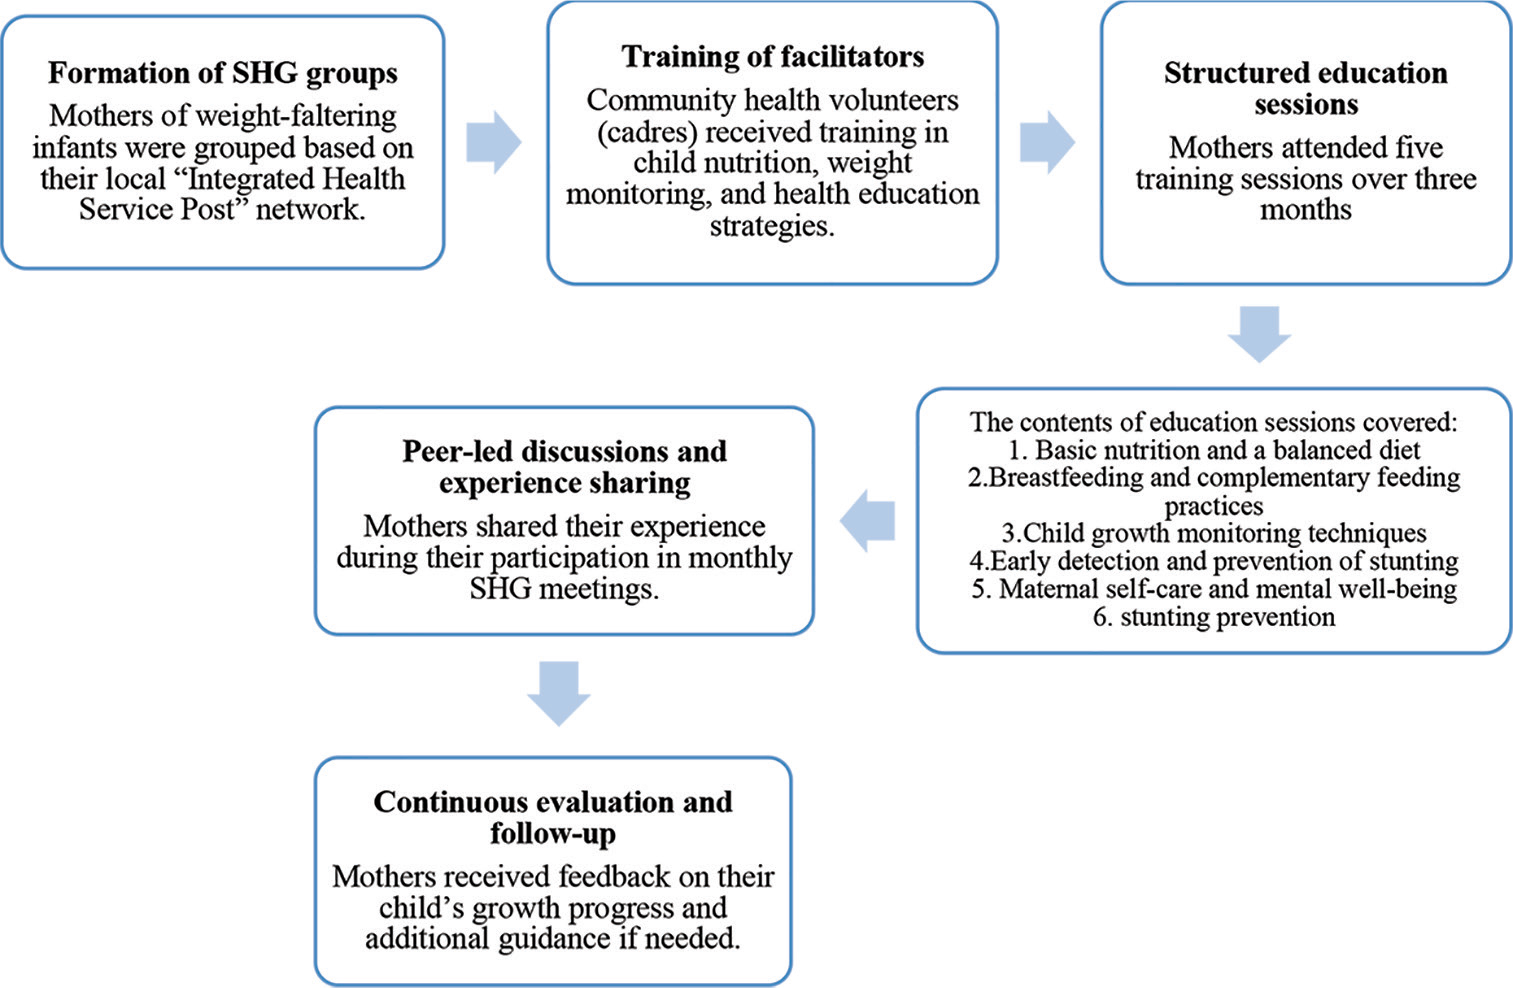
Figure 1.
SHG implementation flowchart. Abbreviation: SHG, self-help group.
Table 1.
Stages and activities of the SHG intervention.
| Stage | Description of intervention | Method/approach |
|---|---|---|
| Activity 1: Group Formation and Orientation | Establishment of SHG among mothers of weight-faltering children; orientation on study objectives; explanation of research instruments; and informed consent obtained prior to baseline data collection. | Focus Group Discussion (Pre-intervention) |
| Activity 2: Counseling on Weight Faltering | One-on-one counseling sessions providing information on weight faltering, its relationship to stunting, and strategies for early identification. | Individual Counseling |
| Activity 3: Structured Health Education | Delivery of educational sessions covering essential nutrition, balanced diet, breastfeeding and complementary feeding practices, growth monitoring, maternal self-care, and stunting prevention. Content guided by the “Nursing Actions to Prevent Stunting” (TKCS) module. | Seminar and Group Discussion |
| Activity 4: Cooking Demonstration | Practical sessions demonstrating preparation of high-protein, nutritious complementary foods, followed by participants’ self-practice. | Demonstration and Hands-on Practice |
| Activity 5: Post-Intervention Evaluation | Assessment of maternal knowledge and attitudes after intervention; measurement of children’s weight changes to evaluate intervention outcomes. | Focus Group Discussion and Anthropometric Measurement (Post-intervention) |
Table 2.
Characteristics of participants (n = 52).
| Variable and categories | Mean ± SD (Min-max) | n (%) |
|---|---|---|
| Age | ||
| Mother’s age | 29.0 ± 6.5 (20–45) | |
| Children’s age | 14.5 ± 8.5 (2–36) | |
| Mother’s occupation | ||
| Unemployed | 43 (82.7) | |
| Farmer | 3 (5.8) | |
| Teacher | 4 (7.7) | |
| Artist | 1 (1.9) | |
| Working abroad | 1 (1.9) | |
| Mother’s education | ||
| Elementary school | 8 (15.4) | |
| Junior high school | 20 (38.5) | |
| Senior high school | 19 (36.5) | |
| Diploma/bachelor | 5 (9.6) | |
| Children’s sex | ||
| Male | 22 (42.3) | |
| Female | 30 (57.7) |
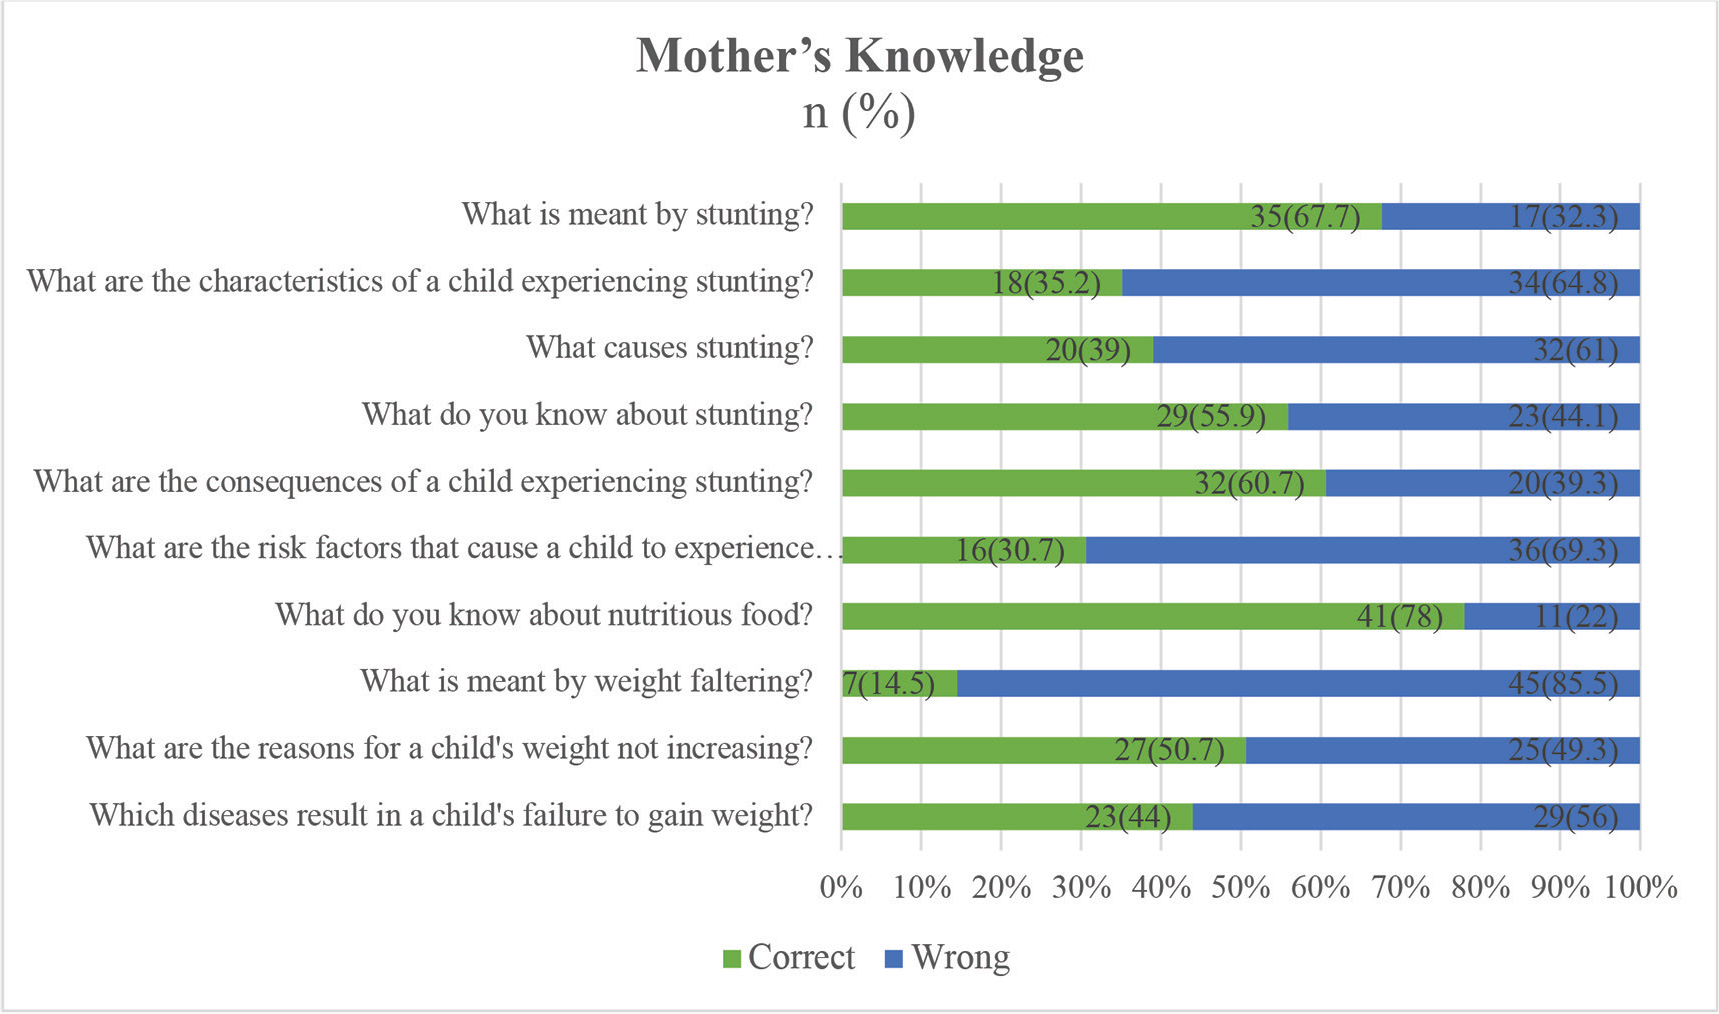
Figure 2.
Mother’s knowledge about weight faltering and stunting.
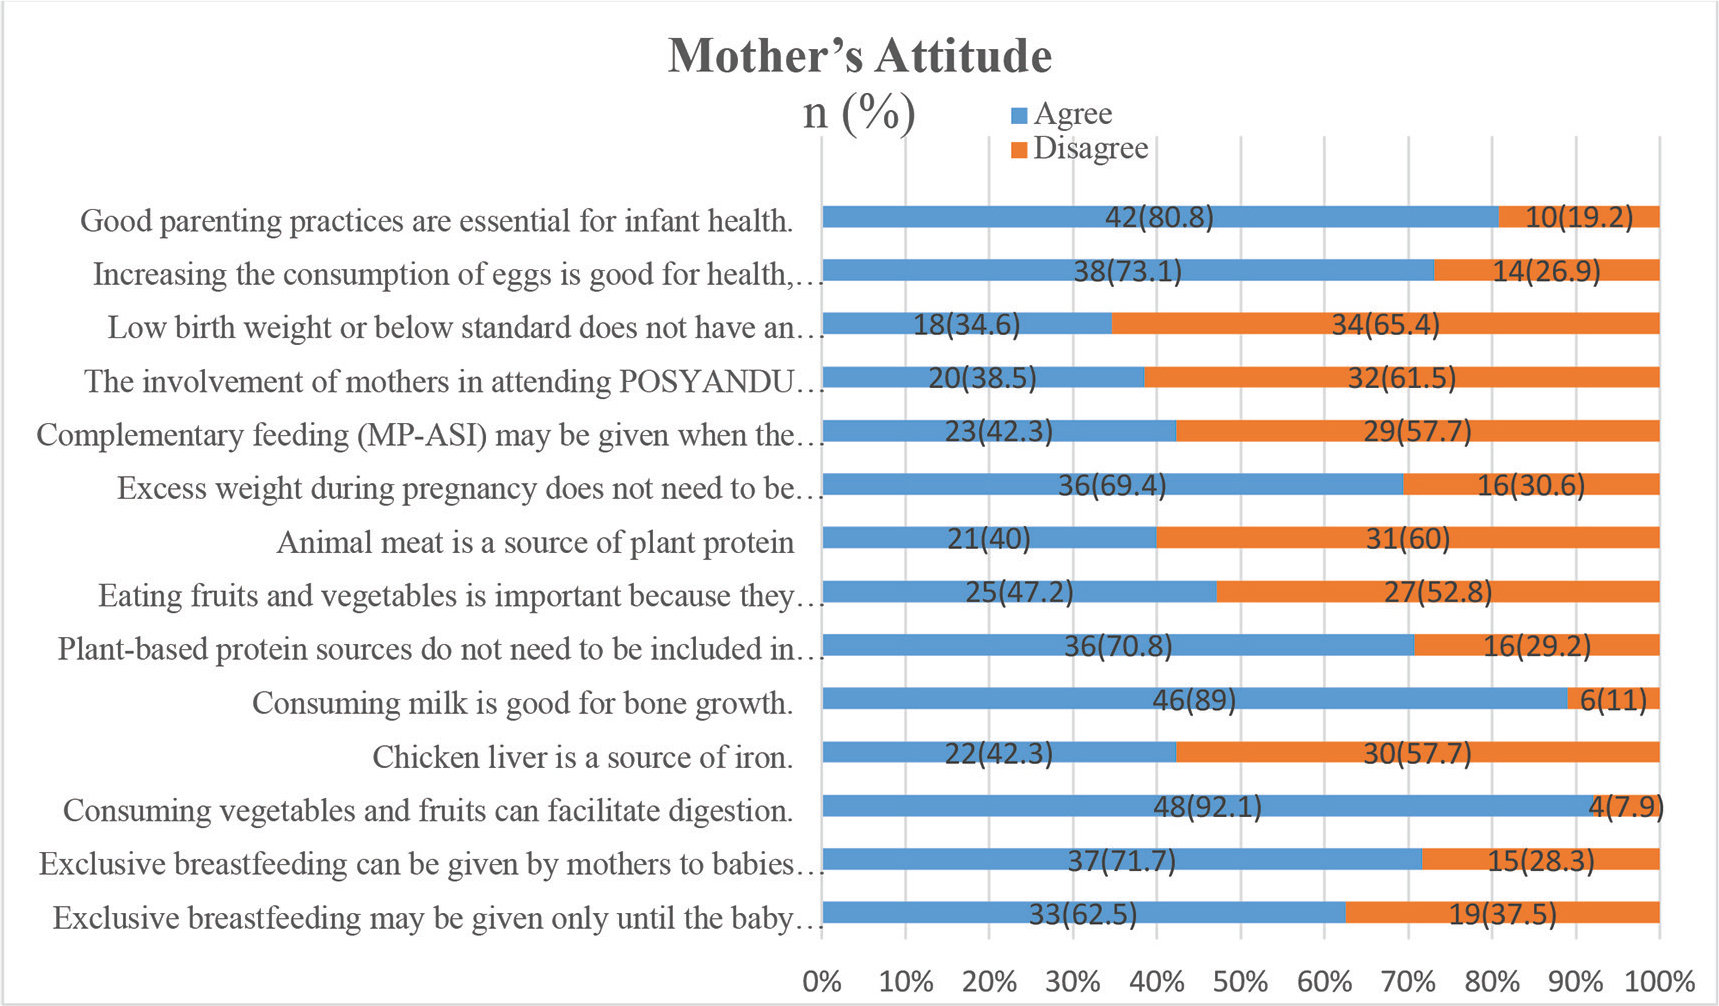
Figure 3.
Mother’s attitude toward weight faltering and stunting.
Table 3.1.
Relationship between respondent characteristics and respondents’ level of knowledge pre-intervention (n = 52).
| Variables and categories | Knowledge level | 𝒳 | P * | ||
|---|---|---|---|---|---|
| Good | Sufficient | Insufficient | |||
| Mother’s occupation | 0.057 | 0.972 | |||
| Employed | 1 | 4 | 4 | ||
| Unemployed | 6 | 19 | 18 | ||
| Mother’s education | 5.950 | 0.051 | |||
| Elementary and junior high school | 2 | 10 | 16 | ||
| Senior high school and universities | 5 | 13 | 6 | ||
| Children’s sex | 1.910 | 0.385 | |||
| Male | 4 | 11 | 7 | ||
| Female | 3 | 12 | 15 | ||
Table 3.2.
Relationship between respondent characteristics and respondents’ level of knowledge post-intervention (n = 52).
| Variables and categories | Knowledge level | 𝒳 | P* | ||
|---|---|---|---|---|---|
| Good | Sufficient | Insufficient | |||
| Mother’s occupation | |||||
| Employed | 5 | 3 | 1 | 3.803 | 0.149 |
| Unemployed | 10 | 26 | 7 | ||
| Mother’s education | |||||
| Elementary and junior high school | 9 | 15 | 4 | 0.329 | 0.848 |
| Senior high school and universities | 6 | 14 | 4 | ||
| Children’s sex | |||||
| Male | 6 | 13 | 3 | 0.184 | 0.912 |
| Female | 9 | 16 | 5 | ||
Table 4.
Differences in maternal knowledge, maternal attitudes, and children’s weight before and after intervention (n = 52).
| Variables and categories | Pretest | Posttest | P * | ||||
|---|---|---|---|---|---|---|---|
| n (%) | Mean ± SD | Min-Max | n (%) | Mean ± SD | Min-Max | ||
| Mother’s knowledge | 5.6 ± 1.9 | 1.0–9.0 | 6.9 ± 1.3 | 3.0–9.0 | <0.001 | ||
| Good | 8 (15.4) | 15 (28.8) | |||||
| Sufficient | 23 (44.2) | 29 (55.8) | |||||
| Insufficient | 21 (40.4) | 8 (15.4) | |||||
| Mother’s attitude | 9.5 ± 2.7 | 4.0–13.0 | 11.5 ± 1.8 | 8.0–15.0 | <0.001 | ||
| Very good | 13 (25.0) | 21 (40.4) | |||||
| Good | 27 (51.9) | 31 (59.6) | |||||
| Poor | 12 (23,1) | 0 (0) | |||||
| Children’s weight | 52 (100) | 9.7 ± 10.8 | 3.4–85.0 | 10.2 ± 9.1 | 5.1–73.0 | 0.029 | |
Table 5.
Analysis of the mean difference (delta test) of knowledge and attitudes (n = 52).
| Variables and categories | Knowledge | P | Attitude | P | ||
|---|---|---|---|---|---|---|
| Mean | SD | Mean | SD | |||
| Mother’s occupation | 0.371 | 0.389 | ||||
| Employed | 2.0 | 2.7 | 0.9 | 3.2 | ||
| Unemployed | 1.2 | 2.4 | 1.9 | 3.0 | ||
| Mother’s education | 0.072 | 0.217 | ||||
| Elementary and junior high school | 1.9 | 2.6 | 2.2 | 3.1 | ||
| Senior high school and universities | 0.7 | 2.1 | 1.1 | 3.0 | ||
| Children’s sex | 0.248 | 0.323 | ||||
| Male | 0.9 | 2.3 | 1.2 | 3.4 | ||
| Female | 1.7 | 2.6 | 2.1 | 2.1 | ||
Table 6.
Multifactor analysis with adjusted intervention effects (post vs pre) from GEE and nonparametric robustness (Wilcoxon) (n = 52).
| Outcome | GEE β (post vs pre), 95% CI | P (GEE) | Wilcoxon P |
|---|---|---|---|
| Knowledge | 1.188 (0.336–2.041) | 0.0063 | 0.00071 |
| Attitude | 1.701 (0.636–2.766) | 0.0017 | 0.00067 |
| Child weight | 0.041 (-0.665 to 0.747) | 0.9095 | 0.0290 |