
Figure 1.
Binary Logistic regression analysis results of kinesiophobia after THA_
| Factors | Regression coefficient | Standard error | P |
|---|---|---|---|
| Education level | –1.282 | 0.409 | 0.002 |
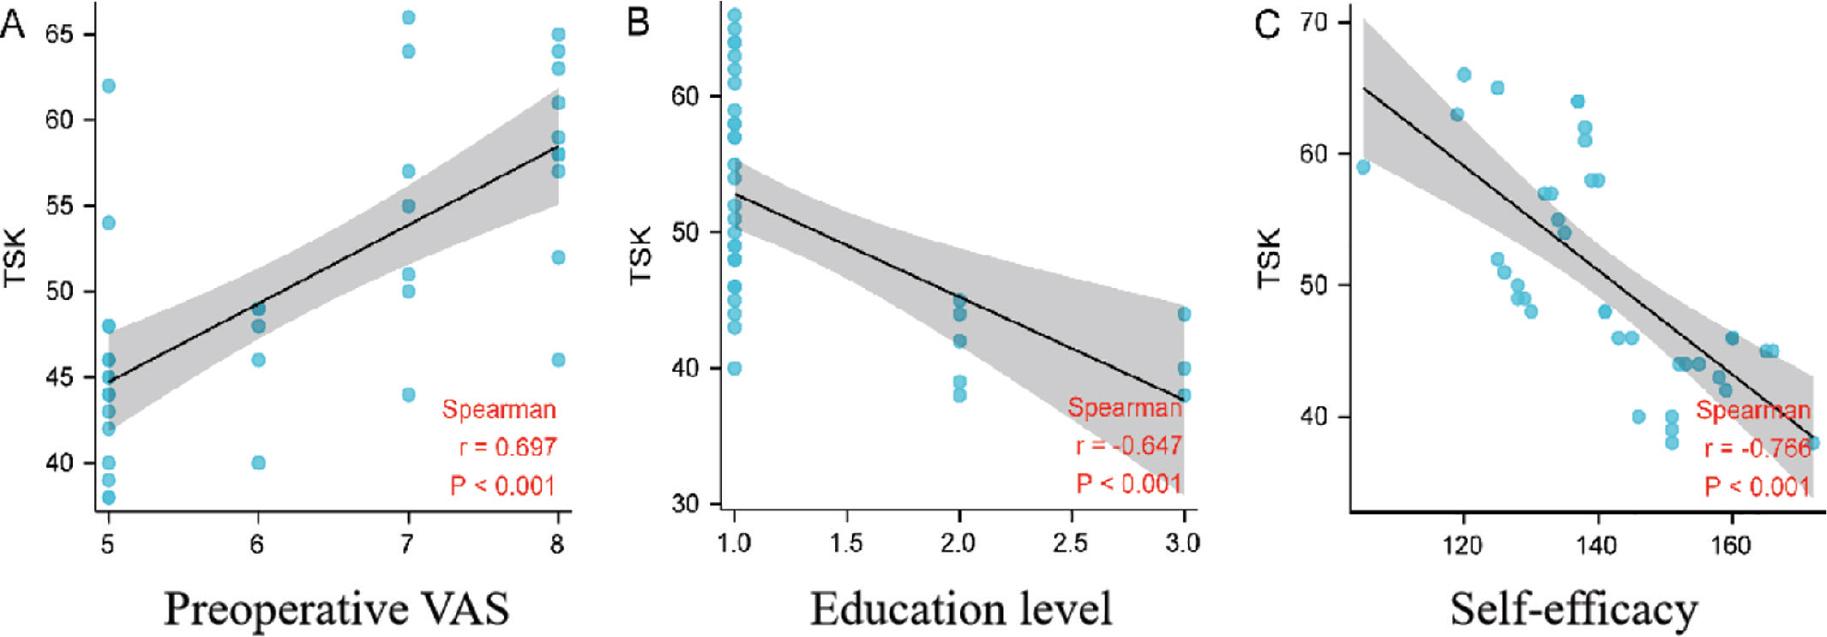
| Preoperative VAS | 0.616 | 0.252 | 0.015 |
| Self-efficacy | –0.102 | 0.022 | <0.001 |
Baseline data and univariate analysis results of patients in the 2 groups (x¯±s{\rm{\bar x}} \pm {\rm{s}})_
| Indicators | The kinesiophobia group (n = 38) | The non-kinesiophobia group (n = 175) | Statistical value | P |
|---|---|---|---|---|
| Age (years) | 66.18 ± 6.93 | 64.27 ± 7.31 | t = 1.478 | 0.141 |
| Gender (cases, male/female) | 20/18 | 94/81 | x2 = 0.015 | 0.903 |
| BMI (kg/m2) | 28.05 ± 4.07 | 27.70 ± 5.09 | t = 0.397 | 0.692 |
| ASA classification (cases, I/II/III) | 22/15/1 | 102/61/12 | Z = -0.155 | 0.877 |
| Comorbidities | ||||
| Diabetes (cases, yes/no) | 4/34 | 17/158 | x2 = 0.023 | 0.879 |
| Hypertension (cases, 0/I/II/III) | 4/19/13/2 | 21/101/42/11 | Z = -0.873 | 0.383 |
| Preoperative VAS (points) | 6.29 ± 1.27 | 5.52 ± 1.11 | t = 3.456 | 0.001 |
| Preoperative pain duration (months) | 65.95 ± 10.97 | 62.86 ± 7.23 | t = 2.152 | 0.033 |
| Revision surgery (cases, yes/no) | 6/32 | 10/165 | x2 = 3.227 | 0.072 |
| Single/bilateral surgery (cases, single/bilateral) | 33/5 | 167/8 | x2 = 2.658 | 0.103 |
| Operative duration (min) | 130.45 ± 41.15 | 128.83 ± 29.94 | t = 0.230 | 0.819 |
| Length of incision (cm) | 14.53 ± 1.30 | 14.58 ± 1.41 | t = -0.227 | 0.821 |
| Intraoperative blood loss (mL) | 308.37 ± 50.49 | 306.18 ± 41.53 | t = 0.249 | 0.804 |
| Education level (cases, junior high school and below/high school/college and above) | 30/5/3 | 85/40/50 | Z = -3.452 | 0.001 |
| K-SES (points) | 141.24 ± 14.84 | 160.90 ± 13.80 | t = -7.854 | <0.001 |
| SSRS (points) | 52.32 ± 6.95 | 59.57 ± 6.40 | t = -6.238 | <0.001 |