
The further development of nuclear energy is based on three main principles: safety, cost-effectiveness, and public attitude (Shirokov, 1997). All these principles are interrelated. To ensure safe operation, nuclear power plants (NPPs) are equipped with the necessary safety systems that prevent accidents and are designed to keep equipment from being destroyed in the case of accidents. Localizing safety systems are designed to contain radioactive substances within the unit and prevent their release into the environment. Of course, the availability of safety systems affects both the cost and operational performance of a nuclear power plant.
In ensuring the required level of safety, the cost performance of power plants is crucial when deciding on the choice of an energy source. Therefore, nuclear power is always in competition with other energy sources; recently it was gas power plants while today it is renewable energy sources, as these already have specific capital investments at the level of nuclear power plants or less. However, today they are losing in terms of cost and unstable electricity production. It should be noted that the development of electricity storage solves the latter drawback and makes wind and solar power plants more popular, as they do not pose a nuclear threat. Thus, it should be emphasized that only the economic advantages of NPPs make them more acceptable in the market today.
Thus, during the NPP operation, great attention is paid to the safety systems that serve to maintain the integrity of the safety barriers. The latter are designed to prevent the release of radioactive fission products into the environment in the event of an accident. The containment system is the last system to prevent fission products from being released to the environment in the event of a severe accident. To confirm the readiness of this system to perform its functions in the event of an accident, appropriate leakage tests are performed after each repair.
The “absolute pressure” method is used to test the level of sealing of the containment system and elements of the accident localization system at Ukrainian NPPs. According to this method, the mass of air available in the CSA is determined by measuring the pressure, temperature and humidity according to the Mendeleev–Clapeyron equation. The tests consist of five stages: vacuuming; air injection to achieve the required pressure of 1.72 kg⋅cm−2; stabilization of the parameters; measurement; and pressure release, as well as lasting more than 25 h. No work is carried out in the CSO during the tests. A compressor is used to provide the overpressure in the CSF and, given the large volume of the CSF, it takes a relatively long time to inject the air, which affects the economic performance of the NPP (Kravchenko et al., 2023).
In Kravchenko et al. (2022), it was proposed to use an ejector, the working medium for which is air after the compressor, to reduce the time of air injection. In this case, the ejector was calculated, its characteristic constructed, and the injection time determined. A number of assumptions were made in the calculations, which is why the results were obtained with a corresponding error. It should be noted that equipment for cleaning the air of dust and moisture is installed directly after the compressor. Accordingly, when using the ejector, the air that is drawn into the ejector must also be cleaned of dust and moisture. The availability of this equipment was not considered on paper by Kravchenko et al. (2022). The presence of additional resistance at the inlet of the air drawn into the ejector should lead to a decrease in the air flow at the outlet of the ejector and an increase in the time of air injection to the required pressure in the CSO.
The aim of this study is to clarify the results obtained in a paper by Kravchenko et al. (2022), regarding minimizing the time for air injection into the CSU during leakage tests. To achieve this goal, the following tasks were performed:
- –
An algorithm for calculating the gas ejector was developed, adapted to the case when the full pressures in all nozzles are set.
- –
The dynamics of air injection into the CSO under variable pressure were then calculated and the injection time determined.
- –
The dynamics of air injection into the CSO under variable pressure were then calculated and the injection time determined.
- –
The design and operational factors that affect this time were determined.
- –
The ejector design was optimized with respect to the minimum air injection time.
Before starting the calculation of the ejector itself, it is necessary to build a characteristic for the gas compressor that injects the working air flow.
To solve this problem, the first step is to obtain the compressor characteristic in the form of the flow versus the backpressure at the outlet. In addition, it is advisable to immediately convert the volume flow rate to a mass flow rate, given that the ‘normal cubic meters’ are calculated at an air temperature of 0°C. In this case, the mass air supply is calculated as follows:
Figure 1 shows the characteristic of the TsK-35/8 centrifugal compressor.
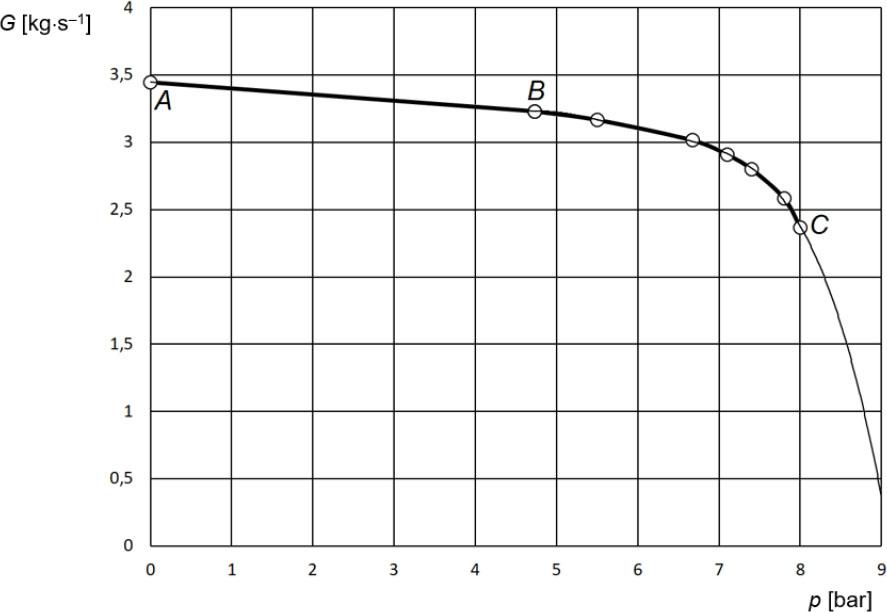
Approximation of the characteristics of the TsK-135/8 compressor
Source: own work.
In the AB section, at an overpressure of p ≤ 4.73 bar, it is convenient to approximate the characteristic by the linear dependence:
In section BC, at an overpressure of p > 4.73 bar, a fourth-degree polynomial approximation is used:
This approximation provides a high value of the coefficient of agreement, R2 = 0.9987. In addition, this approximation allows the characterization to be extended to the right of point C by extrapolation.
Since the overpressure in the CSO does not exceed 0.7 bar, the compressor characteristics in this range are described by a linear relationship. The fill time can then be determined analytically.
The differential equation describing the filling process can be represented as:
Hence:
This allows the calculation of certain integral:
The mass of air in the containment vessel is determined using a gas equation (Mendeleev–Clapeyron):
We get m+= 72.260 kg and m2 = 121.235 kg.
Absolute pressure is related to mass:
But the compressor characteristic (2) uses an overpressure expressed in bars. We can define it by the formula
Then the dependence of the compressor supply on the mass of air in the CSO is described by the equation:
Integrating (5), we obtain the time for filling the CSO:
The time is equal to 14,274 s or 3.965 h. The result obtained analytically is the same as the result of the numerical integration.
Although gas ejectors have long been known and are widely used in various industries, research on ejectors continues. Their typical use is in the oil and gas industries (Carpenter, 2020; Ping & Macdonald, 2020; Bernat et al., 2023), and in the energy industry (Sammak et al., 2021).
A number of studies have been devoted to optimizing the geometry of ejectors. For this, 1D models (Wang et al., 2021; Van den Berghe et al., 2022) and 3D models are used (Butenko & Smyk, 2015; Shi et al., 2024), as well as neural networks (Gupta et al., 2021).
Further improvement of the ejectors is possible due to the use of pulse ejectors (Voropaiev et al., 2021), gas-wave ejectors (Li et al., 2024), and vortex separation ejectors (Novruzova & Qadashova, 2020).
The peculiarity of our calculation is that we need to minimize the time of increasing the air pressure in the CSA by means of the ejector, considering the fact that the pressure inside the CSA is continuously changing. This led to the need to change the sequence of calculations within the classical mathematical model of the ejector.
Figure 2 shows the design scheme of an ejector with a cylindrical mixing chamber. The figure shows the parameters of the working, ejected and mixed flow, as well as the main sections for which the equations are drawn up.
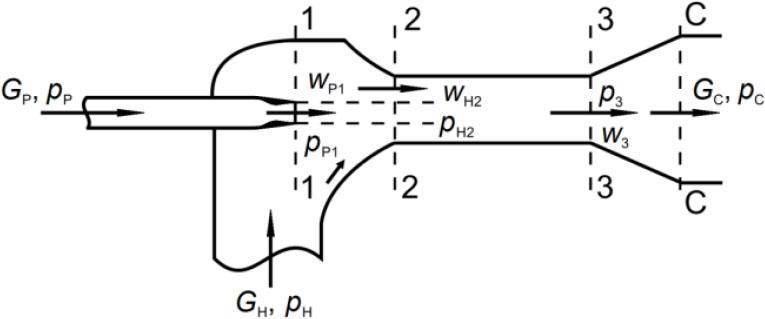
Design scheme of the gas ejector
Source: own work.
The equations describing the operation of the ejector include the continuity equations:
As well as the equation of conservation of momentum of the quantity of motion:
The usual assumption of pressure equality is used:
The presence of energy losses in different parts of the ejector is considered using velocity coefficients. The following values of speed coefficients are recommended:
- –
working nozzle: φ1 = 0.95,
- –
mixing chamber (MC): φ2 = 0.975,
- –
diffuser: φ3 = 0.9,
- –
inlet section of the CP: φ4 = 0.925.
The peculiarity of supersonic gas ejector calculations is that they consider the compressibility of gases. In this case, the speed of the working flow usually exceeds the speed of sound. Traditionally, gas-dynamic functions are used in the calculated-reduced pressure:
We assume that the main geometric parameter, the ejector module, is given:
The total pressure in all three nozzles is also given, and therefore the air compression ratio:
It is necessary to determine the air flow rate in all nozzles and the ejection coefficient:
First of all, the parameters of the working flow can be calculated since it does not depend on the ejection ratio. The working air flow rate is set based on the compressor capacity.
The gas-dynamic function is calculated as follows:
Using (6), the reduced velocity can be determined analytically:
It should be borne in mind that the velocity at the outlet of the working nozzle is usually supercritical, i.e., λp2 > 1. The reduced mass velocity qp2 is calculated using (18). Next, the outlet cross-sectional area of the nozzle is calculated:
The cross-sectional area of the ejected flow is 2-2:
Critical speed at a given air temperature:
Working fluid velocity at the nozzle outlet
In most literature, when calculating the ejector characteristics, the ejection coefficient u is set and the compression ratio ε is calculated. However, with this calculation sequence, it is difficult to determine the maximum value of the ejection coefficient, which significantly reduces the accuracy of calculating the filling time of the CSO.
In the course of the work, the calculation methodology was improved and it was proposed to set the compression ratio ε and calculate the ejection coefficient. In this case, the convergence of the results is significantly improved.
The calculation of the ejector characteristic is performed under the assumption that the air movement is adiabatic. In this case, the characteristic would have the form ABC (Fig. 3). It should be noted that on the ABC line, each value of the ejection coefficient corresponds to two values of the compression coefficient, which led to poor convergence of the iterative process using the Gauss–Seidel method.
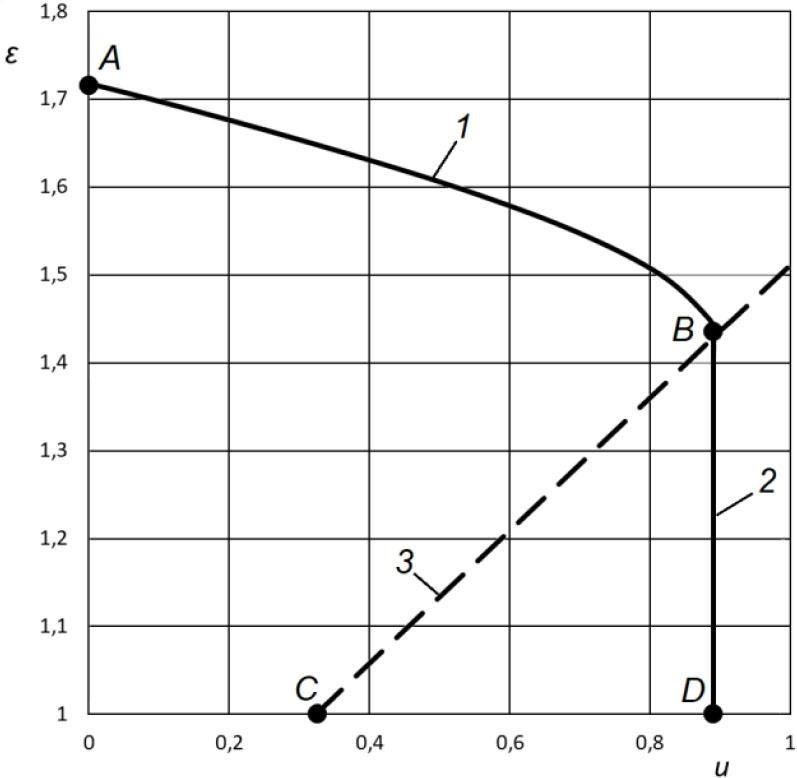
Calculated characteristic of the ejector at M = 8.6 (1 – adiabatic characteristic, 2 – short-circuit mode in Section 3-3, 3 – critical mode limit in Section 3-3)
Source: own work.
It is known from experiments that when the speed of sound reaches Section 3-3, the so-called flow closure occurs. In this case, despite changes in pressure, the air velocity in the critical section remains constant and equal to the local speed of sound. This phenomenon corresponds to the vertical section BD in Figure 3, and the real characteristic of the ejector is ABD.
In addition, it is theoretically possible to close the flow in Sections 1-1 and 2-2, but these critical modes are not realized under the studied parameters.
At each step, the value of λc3 is set in the range from 0 to 1. The condition λc3 ensures that the mixed flow velocity is subsonic.
For a given value of λc3, we determine the values of the gas-dynamic functions λc3 and qc3 pressure at the outlet of the mixing chamber:
Mixed flow velocity in Section 3-3 is calculated as follows:
Since the modulus of the ejector is given, we determine the cross-sectional area of the CS:
From the mass conservation equation, we determine the mass flow rate:
In the case of a cylindrical mixing chamber:
The reduced mass velocity of the ejected flow in Section 2-2:
Knowing qH2, it is impossible to determine the reduced velocity λH2 analytically, so it is determined by the numerical method. After that, ΠH2 is determined.
Ejected flow velocity in Section 2-2 is calculated as follows:
Then the pressure of the ejected flow in Section 2-2:
All the found values are substituted into the momentum balance equation (11) and the inviscidity is calculated, i.e., the difference in the total momentum from zero.
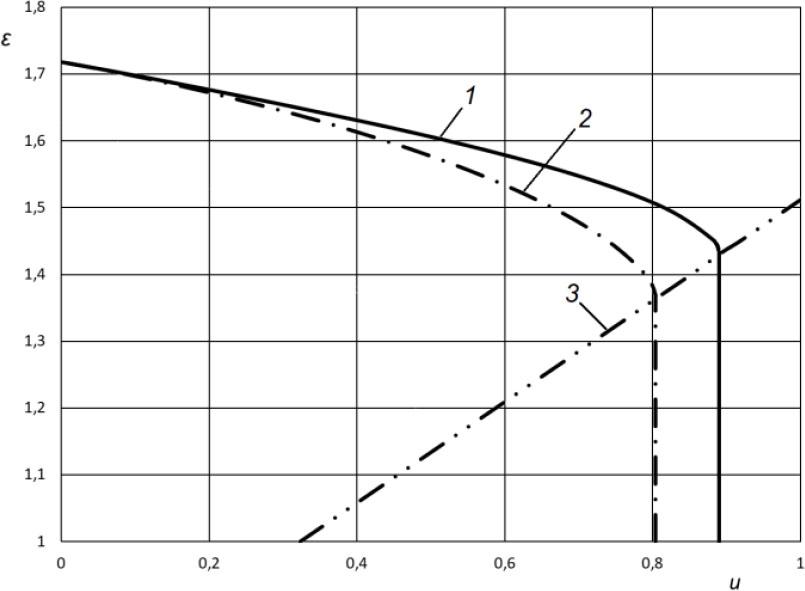
The subroutine for determining the root of a nonlinear algebraic equation automatically changes the value of λc3 in a given range until this inviscidity becomes zero with a given permissible error. Thus, at a given pressure pc the value of λc3 is determined such that the law of mass conservation (5) and the law of momentum conservation (11) are fulfilled. After specifying λc3, the ejection coefficient u can be determined. Figure 4 shows the dependence of the flow compression ratio ε as a function of the ejection coefficient u at three values of the ejector module.
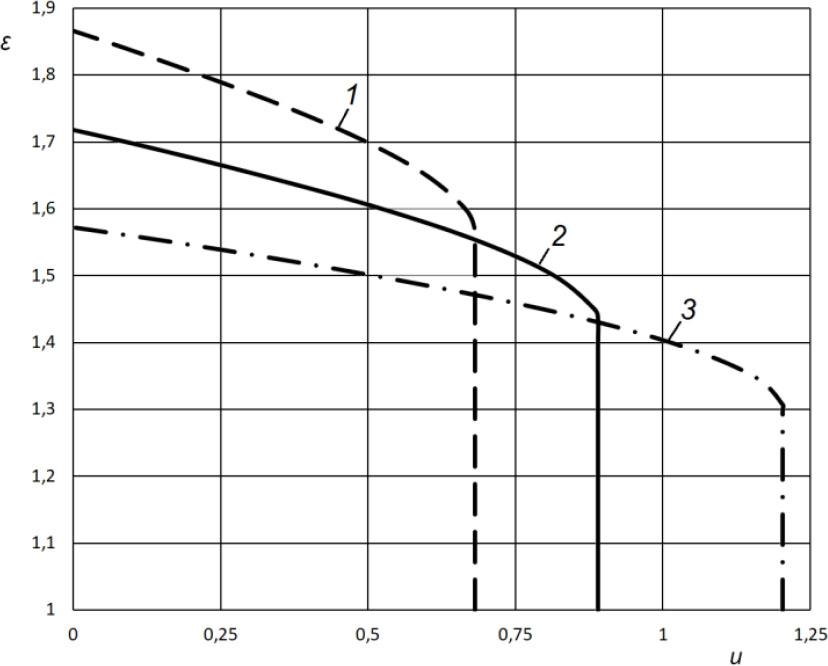
Dependence of the flow compression ratio ε to the ejection coefficient u
Source: own work.
Characteristics of ejectors at different modulus values:
Figure 4 shows that ejectors that provide high ejection rates have a limited compression ratio. Our goal is to find an ejector module that provides an optimal balance between these indicators.
Based on the obtained characteristics, the next step is to model the dynamics of air injection into the CSO to determine the optimal ejector module.
The pressure in the CSA is related to the mass of the gas contained there, based on the equation of the state of gas or the Mendeleev–Clapeyron equation. The dependence of air mass on time is expressed by the differential equation (3). The calculation of the dynamics of filling the containment is reduced to the numerical solution of the differential equation (3). The solution was performed using the Runge–Kutta–Felberg method of the fourth order or fifth of accuracy with automatic selection of the integration step.
The dependence of the pressure in the zones on time at different ejector modules is shown in Figure 5.
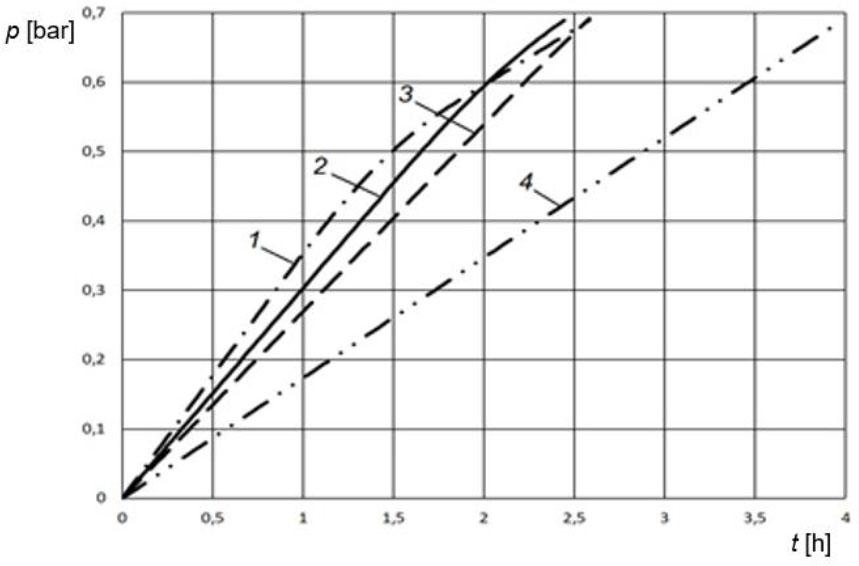
Dynamics of pressure change in the SG at different ejector modules (1 – M = 7.0; 2 – M = 8.6; 3 – M = 11.0; 4 – compressor without ejector)
Source: own work.
Curve 4 in Figure 5 shows the filling of the storage tank directly from the compressor without the use of an ejector. The figure shows that in this case, the filling time is maximum and is approximately 4 h. Curve 3 shows the dynamics of filling the storage tank with an ejector module of 7.0. The filling rate remains at the approximately constant, albeit low. Curve 1 corresponds to a module of 11.0. At the beginning the filling rate is high, but in the upper part of the graph the ejection ratio decreases, and in fact one compressor is working. Finally, Curve 2 corresponds to a modulus of 8.6, which ensures the shortest possible filling time.
Figure 6 shows the dependence of the charge time on the ejector module.
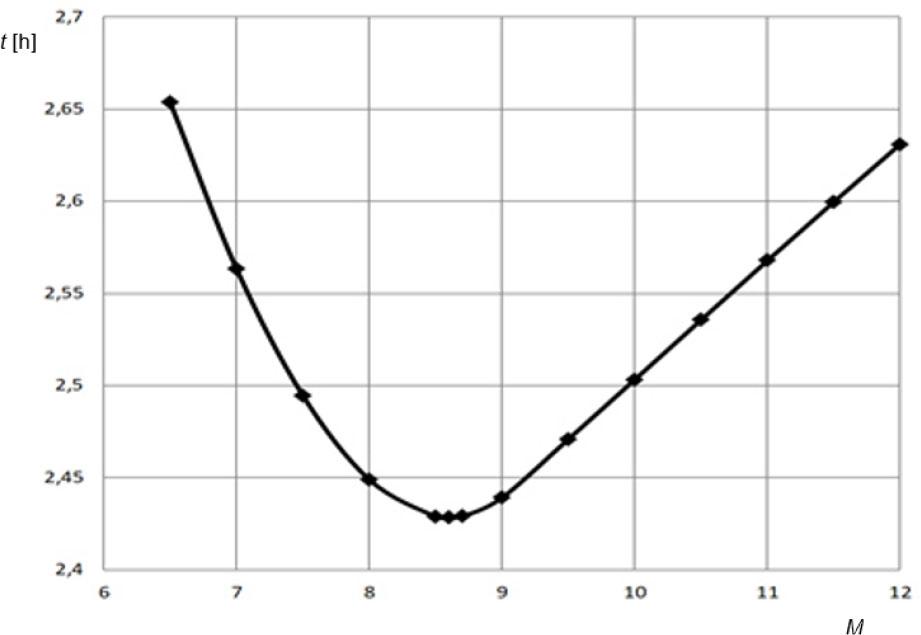
Dependence of the time of filling of the ZO on the ejector module
Source: own work.
Figure 6 shows that the shortest filling time is achieved with a module of 8.6 and is approximately 2.43 h. This means that the use of an ejector reduces the filling time by 38.8%.
Figure 7 shows the dependence of the filling time of the ash container on the overpressure in front of the working nozzle.

Dependence of the filling time of the nozzle on the pressure before the nozzle
Source: own work.
Figure 7 shows that the optimal overpressure is 5.5 bar. The fact is that at high compressor outlet pressures, the compressor flow rate decreases. In this case, despite the high ejection coefficients, the total flow rate at the ejector outlet decreases.
When calculating the air injection to the cooling zone, it is necessary to consider the effect of the air filters, which represent an additional hydraulic resistance.
The preliminary calculation uses the velocity coefficients φ, which are related to loss coefficients ζ by the ratio:
The additional drag coefficient (ζD) affects the velocity coefficient as follows:
There is currently no reliable information on the loss factor. The data sheet of the dust filter installed at the compressor outlet shows that its aerodynamic resistance is 0.1 bar. If we assume that the resistance of the moisture separator will be equal to 0.1 bar, then we note that the total resistance of the two filters that must be additionally installed at the inlet of the air drawn into the ejector will be equal to Δp = 0.2 bar with a filter nozzle diameter of D = 0.15 m. To determine the appropriate loss factor, we can perform the calculation under the conditions of installation directly behind the compressor.
- –
for volume flow to the compressor:
(35) Q = {G \over \rho } = {{3.4} \over {1.2}} = 2.83\,{\rm{m}} \cdot {{\rm{s}}^{ - 1}}, - –
for air velocity:
(36) w = {{4Q} \over {\pi {D^2}}} = {{4 \cdot 2.83} \over {\pi \cdot {{0.15}^2}}} = 160\,{\rm{m}} \cdot {{\rm{s}}^{ - 1}}, - –
then the additional loss factor:
(37) {\zeta _D} = {{2\Delta p} \over {\rho {w^2}}} = {{2 \cdot 20,000} \over {1.2 \cdot {{160}^2}}} = 1.3.
According to Equation 34, we obtain φ4 = 0.636. The calculated characteristic of the ejector with this value of the speed coefficient is shown in Figure 8.
Effect of additional resistance on the ejector characteristic: 1 – φ4 = 0.925 (standard settings), 2 – φ4 = 0.636 (filter at the input), 3 – critical mode limit in Section 3-3
Source: own work.
The calculations of the dynamics of the process of filling the CSO show that, in the presence of additional resistances, the useful effect of the ejector decreases. When a filter is installed at the inlet of the suction flow, the estimated time for filling the CSG is 2.56 h. That is, the reduction in filling time due to the ejector is 35.5%.
Although the installation of the filter somewhat reduces the useful effect of using the ejector, the reduction in air injection time by 35.5% is significant. The installation of the ejector can be recommended for practical implementation.
In this work, we have developed an algorithm for calculating a gas ejector, which differs from the classical algorithm in the sequence of calculations and uses modern numerical methods. The modeling of the process of filling the gas ejector was performed by numerical solution of the differential equation. The air injection time is optimized by two parameters – the ejector module and the compressor outlet pressure.
The calculation shows that the ejector can reduce the time of filling the CSA by 38.8%, which will reduce the total test time.
The presence of a filter at the inlet of the ejected air reduces the effect of using the ejector: the reduction in discharge time will be equal to 35.5%.
Further theoretical and experimental studies are needed to clarify the results obtained.