
Dams are constructed as blockades to restrain water runoff. They serve a significant role in flood control, electricity generation, water supply, and irrigation (He et al., 2022). Arch dams are favorable to engineers for their high load-bearing capacity (Li et al., 2024). This type of dam is one of the most important engineering structures to provide energy. In both geometry and elevation, they exhibit an arched shape. They are built using a small volume of concrete compared to gravity dams, which means that arch dams require sophisticated engineering knowledge for their design and construction (Bayraktar et al., 2011). Due to their strategic interest, dams are subject to rigorous design criteria, particularly with regard to the risk of exposure associated with earthquakes (Adjadj et al., 2021), especially since failure of the structure could result in significant loss of life. However, the vibrations from earthquakes may jeopardize the safety of dam construction (Saxena & Patel, 2023). Consequently, it is imperative to develop reliable numerical tools to assess the seismic responses of dams (He et al., 2022). The soil–structure interaction problem has become the primary focus area for major massive structures like arch dams, bridges, and retaining walls (Sharma & Nallasivam, 2023). The factor of dam–foundation rock interaction plays an important role in the 3D analysis of arch dams (Li et al., 2022). The seismic analysis of arch dams, accounting for the interaction between the foundation and the reservoir, is a difficult subject in computational mechanics (Haghani et al., 2022). Various factors influence the behavior of a dam during an earthquake, including the dam’s geometry, the mechanical properties of the construction materials, such as cohesion and internal friction, and the modulus of elasticity (Ebrahimian, 2011). Most existing dams in seismic regions were designed using methods that are now considered simplistic and inaccurate. Before the widespread use of commercial finite element software, physical model tests were the most common method for analyzing structures with complex geometries (Chopra, 2012). Traditional methods used to analyze arch dams, including cylinder theory, the independent arch method, experimental load analysis, and model analysis, have been found to be limited to dams with small heights (Varghese et al., 2014). In recent years, with the development of accessible numerical methods, this type of analysis has taken over as the primary tool for dam safety assessments (Enzell et al., 2021). The most widely used method for evaluating the stability of a dam and foundation is the finite element method – FEM (Lyu et al., 2021). The ease of implementation due to the matrix methodology adopted in FEM formulations makes it highly compatible with modern digital computation facilities (Sarkar et al., 2024). The FEM has a distinct advantage in tackling irregular geometries (Das et al., 2023). A major advantage of FEM lies in its flexibility in modeling complex geometries and geologic conditions. Current FEM codes can simulate a variety of material behaviors and incorporate the influence of construction procedures. FEM analyses provide detailed information on the stress and deformation properties of both the dam and the abutments (Yu et al., 2005).
Among the seismic analysis methods, time history analysis is the most accurate for simulating a structure’s response to an earthquake record (Majidi et al., 2023). For years, researchers have refrained from widely adopting nonlinear time history analysis due to its demanding computational requirements. However, with the advancement of computer technology, it has become relatively easier to conduct a nonlinear time history analysis (Ningthoukhongjam & Singh, 2021). This method is one of the seismic analysis approaches that use a set of seismic recordings to determine the response of an irregular structure. Among the various existing nonlinear dynamic analyses, time-history dynamic analysis is the most comprehensive. It replicates and records the genuine behavior of a structure responding to varying ground acceleration over time (Suryadi et al., 2023). Assessing the nonlinear response of concrete arch dams to strong or extreme earthquakes is particularly important for evaluating their safety performance, which is highly dependent on input ground motions (Liang et al., 2023).
The year 2021 has witnessed, and continues to witness, a relatively high level of seismic activity in eastern and central Algeria, attributed to the convergence of the Eurasian and African plates near Cape Carbon. Algeria’s water resources predominantly reside in dams, which are especially sensitive to seismic events, particularly arch dams. To assess the impact of this seismic activity, it was necessary to analyze the seismic response of the Tichy-Haf Dam, an arch dam located in an earthquake-prone area in northeast Algeria. This study investigates the Tichy-Haf Dam’s seismic response using a time history analysis conducted with the Midas software, which can provide displacement, acceleration, and velocity values resulting from earthquake-induced loads. The dynamic load was generated using four accelerograms with peak ground accelerations of 0.12 g, 0.32 g, 0.36 g, and 0.44 g. During the operational period of an arch dam, the influence of attached outlets on stress and deformation is slight under both static and dynamic loads. Therefore, in this study, the finite element analysis for the dam primarily focuses on a model without considering any appurtenant structures to simplify the numerical simulations (Zhang et al., 2024). Validation of the numerical model involves comparing the results obtained from numerical modeling with the actual data collected from dam monitoring.
Tichy-Haf Dam is located on the Oued Bousselam River, about 20 km from the Soummam Valley, 10 km southeast of the city of Akbou, near the village of Mahfouda, in the commune of Bouhamza, Béjaïa Province. The catchment area at the dam site is 3,980 km2. The dam, with a height of 80 m, aims to create a reservoir of 150 hm3. The annual allocation of the available water volume is as follows:
- –
Meeting the drinking water supply needs of the towns along the Akbou-Béjaïa corridor.
- –
Irrigation of the Sahel and lower Soummam perimeters: the total annual volume allocated for irrigation in these areas is 43 hm3.
- –
Flood control on the Oued Bousselam: managing flood events along the Oued Bousselam River is crucial to mitigating the impact of flooding in the Soummam Valley.
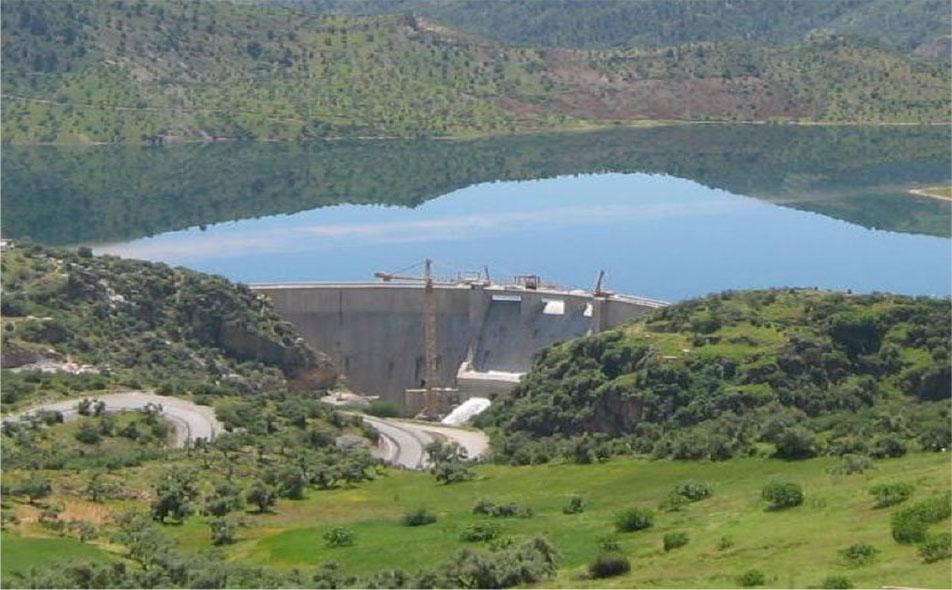
An arch of the Tichy-Haf Dam
Source: Algerian National Agency of Dams and Transfers (ANBT).
The arch dam is founded on Jurassic limestone, which is covered by marl. Tectonic forces have caused detachments within the limestone massif, and a tectonic fold has elevated the limestone above the marl. The reservoir rests on watertight marl. The two banks exhibit quite contrasting features. The left bank is only slightly affected by tectonic activity, with sound limestone that is often karstified. In contrast, the right bank is dolomitic and contains pockets of mylonite or sandy material, with intense fracturing due to tectonic thrusting. The Soummam Valley is a seismic zone, which necessitated the installation of a double anti-seismic belt above and below the auxiliary spillway. This belt serves to prevent any washouts.
The Tichy-Haf Dam is a double-curvature arch dam with varying radii and angles and is asymmetrical. The dam stands 80 m tall and has a crest length of 275 m. The width at the crest is 5 m, widening to 27.75 m at the base. In the finite element model of an arch of the Tichy-Haf Dam, the flood spillway was excluded due to the small size of the openings between the concrete blocks. The dam structure was created using the AutoCAD software and then exported to Midas GTS NX. The natural terrain was modeled in 3D in Midas GTS NX, which accounted for the actual geomorphology of the area. Midas GTS NX is a piece of finite element analysis software used for advanced geotechnical analysis, including soil and rock deformation and stability, dynamic vibrations, and soil-structure interaction in both 2D and 3D. It is utilized by geotechnical, civil, and mining engineers for analysis, testing, and design (System, 1989), supporting various geotechnical projects such as subways, tunnels, pile foundations, dams, and mines (Shen, 2022). Figures 2, 3 and 4 illustrate the geometric model of the Tichy-Haf Dam.
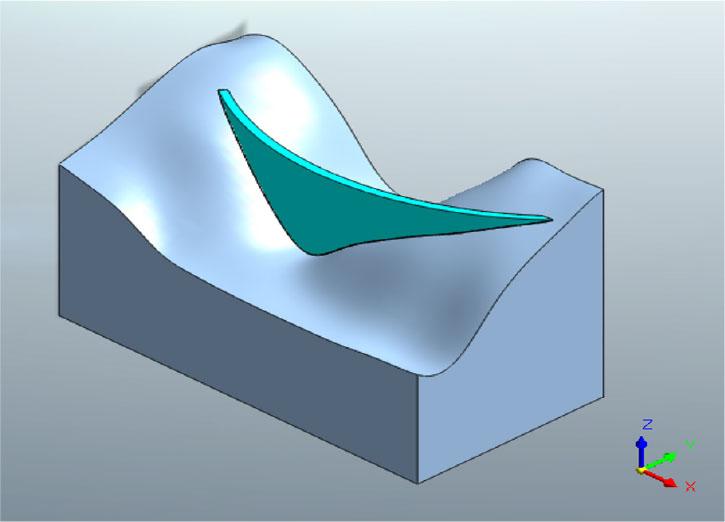
Geometric model of the Tichy-Haf Dam
Source: own work.
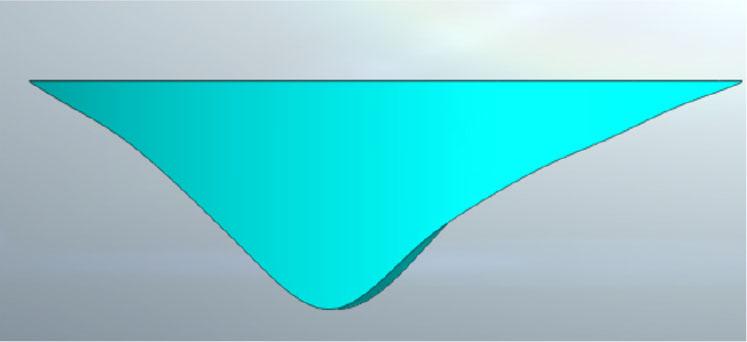
Upstream section of the Tichy-Haf Dam
Source: own work.
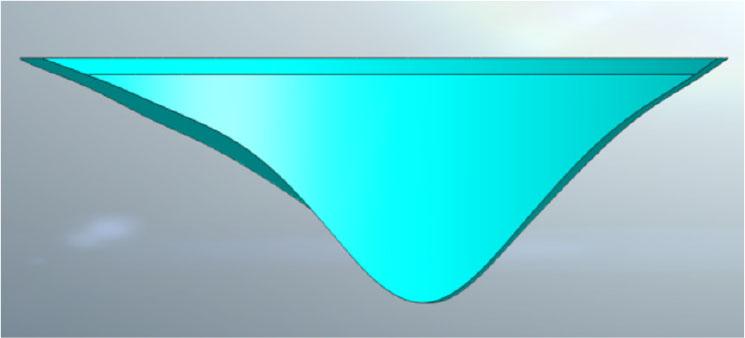
Downstream section of the Tichy-Haf Dam
Source: own work.
The finite element model included 59,191 triangular elements and 13,035 nodes. Each node has three degrees of freedom, corresponding to translations in the x, y, and z directions. Figure 5 depicts the finite element model of an arch of the Tichy-Haf Dam and its foundation. The Tichy-Haf Dam’s finite element model considers the interaction between the dam and foundation. The static loads considered are the self-weight of the dam and the water pressure on the upstream side. The boundary conditions applied to the model include fixed support at the base of the foundation and a free displacement boundary at the other edges, allowing the model to interact with dynamic loading.
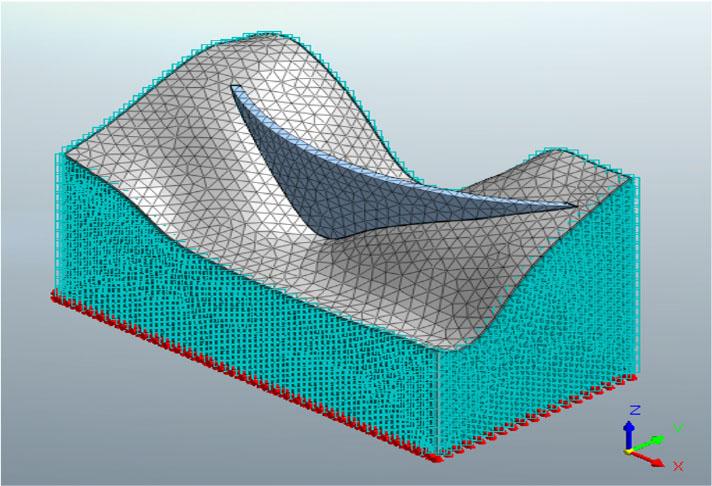
Mesh and boundary conditions of an arch of the Tichy-Haf Dam
Source: own work.
The Mohr–Coulomb model was employed to approximate the soil behavior, requiring parameters such as the Young’s modulus, Poisson’s ratio, cohesion, friction angle, and dilatancy angle (Zewdu, 2020). Table 1 provides the values of these parameters for the different materials composing the dam and the foundation.
Physical-mechanical properties of materials
| Specification | Elastic modulus (E) [kN·m−2] | Poisson’s ratio (ν) [−] | Unit weight (γ) [kN·m−3] | Saturated unit weight (γsat) [kN·m−3] | Cohesion (c) [KN·m−2] | Frictional angle (φ) [°] |
|---|---|---|---|---|---|---|
| Dam | 107 | 0.39 | 21.4 | 21.4 | 150 | 25 |
| Foundation | 4.107 | 0.32 | 24.7 | 24.7 | 500 | 45 |
Source: Algerian National Agency of Dams and Transfers (ANBT).
The eigenvalue problem, also known as modal analysis, is used to determine the natural frequencies of a structure in order to calculate the damping ratio coefficients, accounting for both structural and soil damping (Roësset, 2007). The dynamic behavior of an arch dam is influenced by its dynamic characteristics, such as the shear modulus and damping ratio. Eigenvalue analysis was utilized to assess the dynamic properties inherent in both the soil and the dam structure (Adjadj et al., 2021). A damping ratio of 5% was assumed for the dam body, which is a typical value for such structures. In this study, the model was subjected to a series of ground motion records. The dynamic loading was derived from four accelerograms with amplitudes of 0.12 g, 0.32 g, 0.36 g, and 0.44 g, respectively.
Figure 6 presents the characteristics of the horizontal accelerograms obtained from seismic loads, with the earthquake’s peak horizontal acceleration reaching 0.44 g. This value is consistent with probabilistic studies previously conducted in Algeria.
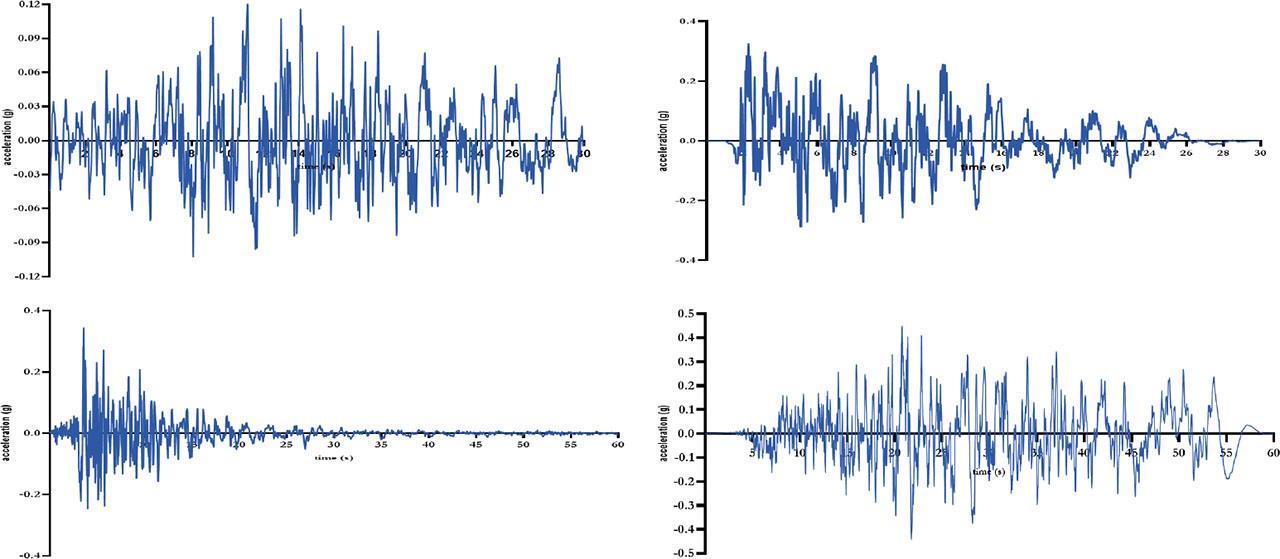
Seismic loads used in the modeling
Source: Algerian National Earthquake Engineering Center (CGS).
Ensuring the safety of dams through regular monitoring using specialized equipment is crucial for effective dam operation management. Monitoring variables, such as horizontal and vertical displacement data, plays a significant role in evaluating the safety of concrete arch dams. By comparing the actual structural response, including displacement, with model predictions, any abnormal dam behavior can be promptly detected, enabling the timely implementation of corrective measures (He et al., 2022).
The planimetric system at the Tichy-Haf Dam comprises 7 pillars (Fig. 7) and 18 deformation markers situated on both the crest and downstream face. The distribution of the seven pillars is as follows:
- –
Pillar 01: downstream of the arch dam,
- –
Pillar 02: downstream on the left bank of the arch dam,
- –
Pillar 03: extending from the crest on the right bank of the arch dam,
- –
Pillar 04: on the crest of the arch dam,
- –
Pillar 05: extending from the crest on the left bank of the arch dam,
- –
Pillar 06: downstream on the left bank of the arch dam,
- –
Pillar 07: at the foot of the arch dam.
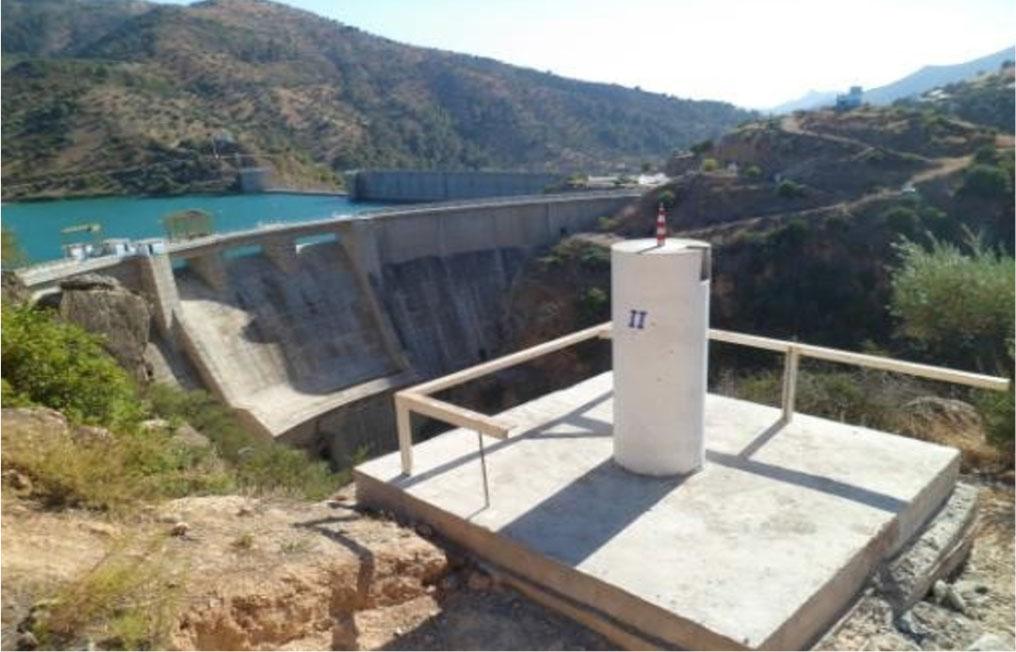
Planimetric pillar
Source: Algerian National Agency of Dams and Transfers (ANBT).
There are also 32 planimetric markers, which are smooth bushes capable of accommodating conical targets. These markers are distributed as follows: 14 markers are located on the downstream crest of the arch dam at an elevation of 305 m.
The measurements were processed using the Land Surveyor (v2.1) software, which is used to process topographic measurements taken during dam monitoring.
The leveling system at the Tichy-Haf Dam includes 15 benchmarks and 8 reference benchmarks. The vertical displacements of the structure were measured at specific points, as follows (Fig. 8):
- –
15 benchmarks are located on the downstream crest of the arch dam at an elevation of 305 m,
- –
RF 01, RF 02, and RF 03 are situated on the right bank,
- –
RF 04, RF 05, and RF 06, as well as 100 and 101, are positioned on the crest.
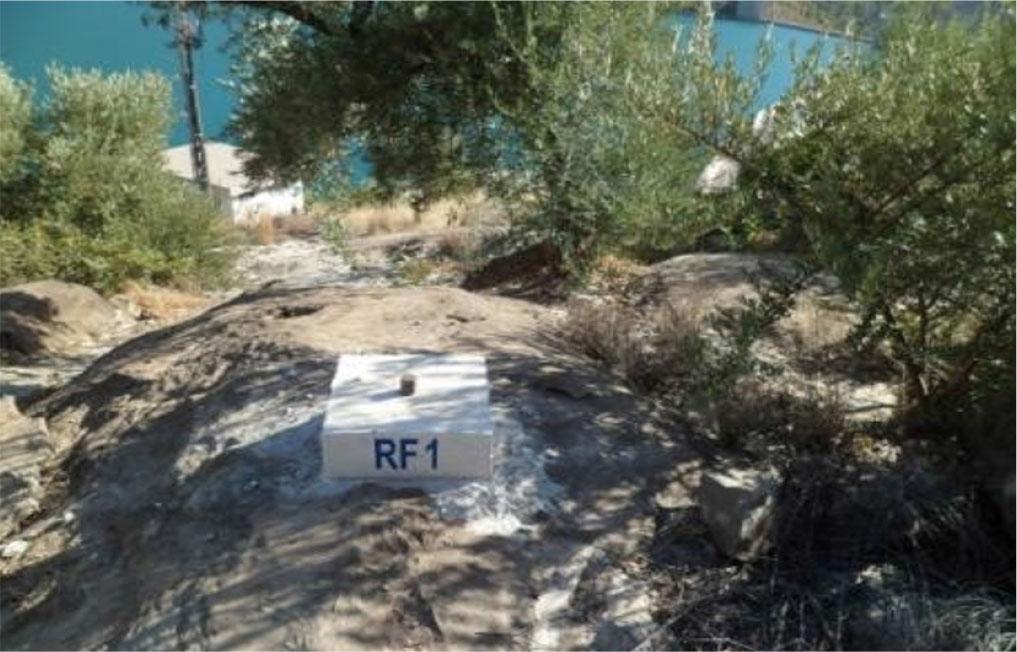
Reference benchmark
Source: Algerian National Agency of Dams and Transfers (ANBT).
The measurements were processed using Land Surveyor v2.1. This software is used to determine the most probable height (Z) of all the leveled markers on the dam and to assess the accuracy of the measurements made.
Tables 2 and 3 present the radial, tangential, and vertical displacements recorded under static loading conditions.
Radial and tangential displacements
| Point | Tangential coordinate [m] | Radial coordinate [m] | First measurement | Second measurement | Third measurement | Fourth measurement | ||||
|---|---|---|---|---|---|---|---|---|---|---|
| X.10−3 [m] | Y.10−3 [m] | X.10−3 [m] | Y.10−3 [m] | X.10−3 [m] | Y.10−3 [m] | X.10−3 [m] | Y.10−3 [m] | |||
| Pillar | ||||||||||
| 1 | 2 139.7771 | 5 213.2880 | 0.1 | −0.6 | −0.1 | −1.5 | 1.2 | −1.7 | 1.8 | 1.3 |
| 2 | 2 234.3549 | 5 145.5580 | 0 | 0 | 0 | 0 | 0 | 0 | 0 | 0 |
| 3 | 2 280.7998 | 5 073.4329 | 5.2 | 0.8 | 0.7 | 0.6 | −0.1 | −0.8 | 2.4 | 1.0 |
| 4 | 2 128.0069 | 5 001.9064 | 0.7 | −5 | 1.7 | −3.8 | 1.6 | −2.9 | 2.3 | 2.7 |
| 5 | 2 053.6496 | 5 045.6026 | 0 | 0 | 0 | 0 | 0 | 0 | 0 | 0 |
| 6 | 2 061.3379 | 5 098.1197 | 0 | 0 | 0.1 | −1.0 | −0.5 | 0 | −0.3 | 0.8 |
| 7 | 2 180.8727 | 5 056.8459 | −1.6 | −0.2 | −1.9 | −1.1 | −1.3 | −1.8 | 0.8 | 0.3 |
| Arch crest | ||||||||||
| 1 | 2 263.2976 | 5 073.7152 | −0.2 | 2.3 | −0.1 | 3.4 | −1.3 | −0.3 | 3.3 | 2.9 |
| 2 | 2 252.3023 | 5 059.3807 | 3.6 | −1.4 | 0.7 | −0.3 | 1.7 | −0.3 | 0.3 | −0.5 |
| 3 | 2 241.3327 | 5 047.0754 | 4.1 | −2.9 | −0.1 | −0.7 | −0.2 | −2.3 | −0.5 | 1.8 |
| 4 | 2 228.5392 | 5 034.7925 | 3.1 | −5.0 | 0.2 | −3.9 | 0.9 | −5.4 | −0.7 | 0.3 |
| 5 | 2 213.3124 | 5 022.8209 | 5.4 | −5.8 | 3.8 | −4.5 | 4.3 | −3.5 | 2.2 | 1.0 |
| 6 | 2 196.6591 | 5 012.5910 | 4.2 | −5.9 | 0.7 | −5.1 | 2.7 | −6 | 0 | −0.1 |
| 7 | 2 178.2207 | 5 007.4771 | 2.8 | −7.6 | 1.6 | −5.9 | 2.8 | −5.5 | 1.1 | 0.8 |
| 8 | 2 161.0720 | 5 000.0211 | 3.3 | −6.4 | 1.0 | −4.7 | 2.3 | −3.2 | 0.1 | 2.5 |
| 9 | 2 142.8410 | 4 998.5590 | 1.6 | −3.3 | 1.7 | −5.8 | 0.1 | −6.0 | 0.5 | 2.0 |
| 10 | 2 127.0101 | 5 000.0122 | 1.3 | −5.3 | 2.3 | −3.7 | 2.3 | −2.4 | 2.0 | 2.5 |
| 11 | 2 112.8964 | 5 003.1407 | −0.5 | −3.3 | 0.4 | −0.7 | 1.1 | −1.2 | 2.6 | 3.0 |
| 12 | 2 099.3296 | 5 007.7667 | −0.7 | −3.2 | −0.9 | 0.3 | 0.1 | −2.0 | 2.1 | 4.0 |
| 13 | 2 086.1626 | 5 013.6576 | −0.2 | −1.5 | −0.8 | 1.4 | −1.7 | 1.6 | 0 | 4.4 |
| 14 | 2 070.9992 | 5 022.1910 | −0.4 | −2.5 | −1.4 | −1.1 | −1.5 | 0 | 0.1 | −0.4 |
| Downstream section | ||||||||||
| 17 | 2 220.8518 | 5 043.9473 | 4.3 | −1.0 | −1.4 | −2.3 | 0 | −1.7 | 0.9 | −1.0 |
| 18 | 2 209.4664 | 5 046.9359 | 0.4 | −1.8 | 0 | 0 | 0.5 | −0.9 | 2.4 | 1.3 |
| 19 | 2 181.8562 | 5 024.1640 | −2.0 | −2.4 | −1.1 | −4.1 | −1.1 | −1 | −1.2 | −7.4 |
| 20 | 2 109.7468 | 5 018.7815 | −0.6 | −0.6 | −0.2 | −0.8 | −1.8 | −3.3 | −0.6 | −0.1 |
X – radial displacements, Y – tangential displacements.
Source: Algerian National Agency of Dams and Transfers (ANBT).
Vertical displacements
| Point | Elevation [m] | Vertical displacement .10−3 [m] | |||
|---|---|---|---|---|---|
| first measurement | second measurement | third measurement | fourth measurement | ||
| Reference | |||||
| 01 | 307.9039 | 3.7 | 0.4 | −0.2 | −1.4 |
| 02 | 310.0502 | 3.1 | −0.2 | −0.7 | −0.7 |
| 03 | 305.6079 | 3.7 | 0.3 | −0.1 | −1.0 |
| 04 | 286.9498 | 0 | 0 | 0 | 0 |
| 05 | 285.7634 | 0 | 0 | 0 | 0 |
| 06 | 286.4792 | 0 | 0 | 0 | 0 |
| 100 | 286.3762 | 0 | 0 | 0 | 0 |
| 101 | 288.0259 | 1.5 | 1.3 | 0.4 | −0.8 |
| Arch crest | |||||
| 01 | 285.2747 | 1.3 | 1 | −0.2 | 0 |
| 02 | 285.2878 | 2.5 | 1.7 | 0.8 | −0.3 |
| 03 | 285.2854 | 1.7 | 1 | 0.1 | −1.6 |
| 04 | 285.3151 | 2.2 | 1.6 | 0.5 | −1.2 |
| 05 | 285.2989 | 0.9 | 0.5 | −0.8 | −2.0 |
| 06 | 285.2873 | 1.7 | 1.4 | −0.1 | −1.4 |
| 08 | 285.3012 | 1.9 | 0.8 | −0.1 | −1.6 |
| 09 | 285.3041 | 1.3 | 0.3 | −0.8 | −2.4 |
| 10 | 285.3026 | 2.2 | 1.7 | 0.5 | −0.8 |
| 11 | 285.2921 | 1.4 | 0.9 | 0.1 | −1.4 |
| 12 | 285.3040 | 2.4 | 2 | 1.4 | 0 |
| 13 | 285.2950 | 1.7 | 1.1 | 0.7 | −0.7 |
| 14 | 285.3078 | 2.4 | 1.7 | 1.4 | 0.4 |
| 15 | 285.3413 | 0.1 | 0.3 | 0.1 | 0.9 |
| 16 | 287.6154 | 1.5 | 1.7 | 0.8 | 0.7 |
Source: Algerian National Agency of Dams and Transfers (ANBT).
The horizontal and vertical displacement values of the dam were monitored, considering static loads. Static loads are considered permanent loads, and their variation is negligible. An assessment of these parameters is required to evaluate the dam’s response to permanent loads and to ensure its long-term stability. Table 2 shows the radial and tangential displacements of the dam, with maximum values reaching 0.0045 m and −0.007 m, respectively, at the crest of the arch. In contrast, vertical displacements are minimal throughout the dam, particularly at the crest, where a maximum vertical deformation of 0.0037 m is observed (Table 3).
In the first phase of this study, we analyzed the dam’s behavior by evaluating its displacement under empty conditions. The second phase focused on the dam’s response when fully filled, considering the combined effects of its self-weight and the water pressure. In the final phase, a dynamic analysis was conducted to assess the dam’s behavior during seismic events, examining key parameters, such as the relative displacement, relative velocity, and relative acceleration, to evaluate its structural performance.
Displacement refers to the overall movement of a point or element within the dam from its original position due to applied loads. In contrast, relative displacement measures the difference in displacement between two points or elements within the structure, providing insights into differential movement between various sections of the dam. This is critical for identifying uneven deformations, which can lead to stress concentrations. Excessive relative displacement may indicate localized strain, potentially leading to cracking or other forms of structural damage.
Relative velocity pertains to the rate at which different sections of the dam move relative to each other when subjected to external forces, such as seismic activity or changes in water pressure. Monitoring relative velocity is essential for assessing deformation rates and the risk of material fatigue over time.
Similarly, relative acceleration describes the rate of change in velocity between different points within the dam under dynamic loading conditions. This parameter plays a crucial role in detecting areas of abrupt movement or stress concentration, which can pinpoint locations prone to cracking or structural failure.
In the initial state of analysis, the displacement remains consistently at zero (Fig. 9). With the dam empty, only its own weight exerts force on the foundation, resulting in negligible displacements and deformations.
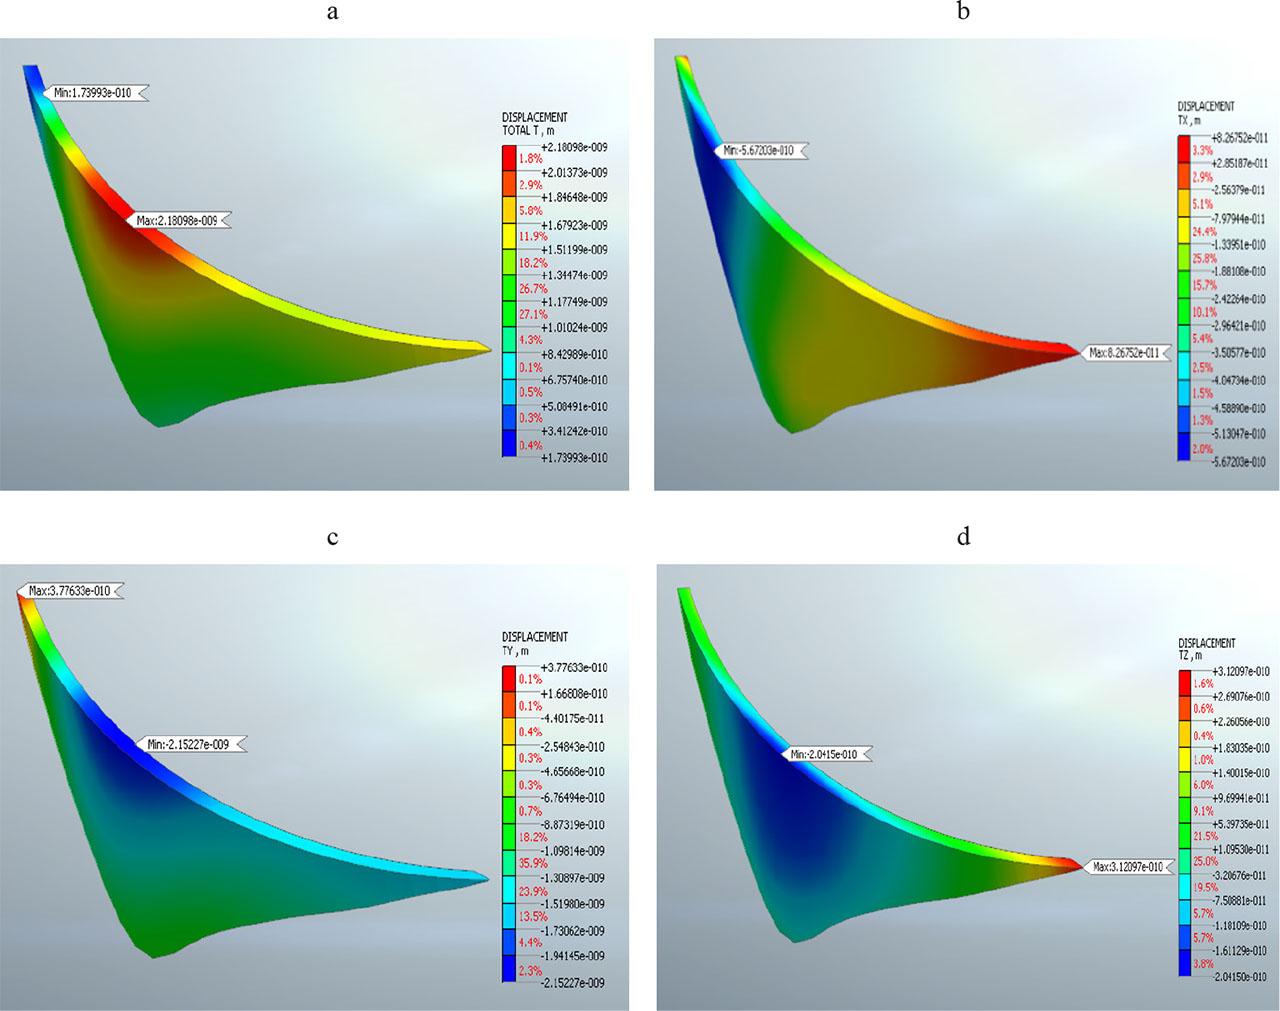
Displacements under self-weight effect: a – total displacements, b – radial displacement, c – tangential displacement, d – vertical displacement
Source: own work.
Figure 10a illustrates the total displacement of the arch dam. Under static loading, the overall displacement of the dam arch is small. The maximum displacement of the dam is 0.015 m, located at the arch crest. In contrast, the minimum displacement value is 0.0045 m, found at the base of the dam body. The maximum and minimum radial and tangential displacements of Tichy-Haf Dam are presented in Figures 10b and 10c, respectively. The radial and tangential displacements of the investigated arch of the Tichy-Haf Dam on the upstream section are smaller compared to those on the downstream face. The peak values of radial and tangential displacements at the crest were 0.0012 m and −0.0119 m, respectively. Figure 10d illustrates the vertical displacement values in the arch dam under static load. As depicted in Figure 10d, the maximum and minimum vertical displacement values are −0.0095 m and −0.0039 m, respectively. Additionally, this section assesses the capability of Midas GTS NX to simulate the static and dynamic behavior of an arch dam using the FEM. Table 4 compares the results of the static analysis with those from data monitoring (Tables 2 and 3). The findings from Midas GTS NX align with the monitoring data, confirming that the software delivers reliable and consistent results.
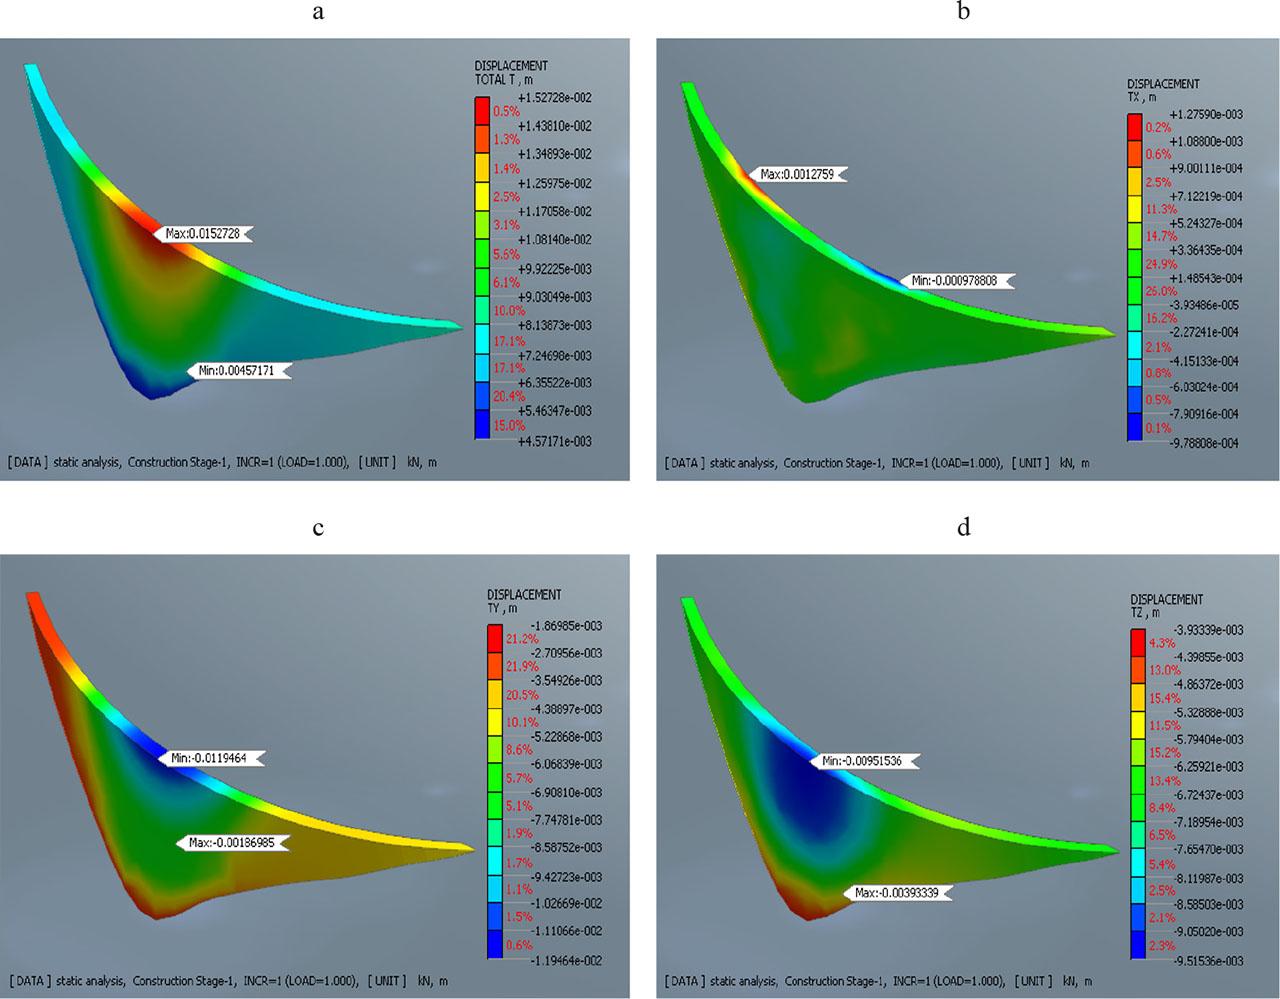
Displacements under static loads: a – total displacements, b – radial displacement, c – tangential displacement, d – vertical displacement
Source: own work.
Summary of displacements calculated by the dam monitoring system and the calculation code
| Value [m] | Dam monitoring | Midas GTS NX | ||||
|---|---|---|---|---|---|---|
| radial displacement | tangential displacement | vertical displacement | radial displacement | tangential displacement | vertical displacement | |
| Max | 0.0045 | −0.0070 | 0.0037 | 0.0012 | −0.0119 | −0.0059 |
| Min | 0 | 0 | 0 | 0.0009 | −0.0018 | −0.0039 |
Source: own work.
During this phase of the analysis, the model was subjected to four earthquakes with varying accelerations. Following the first earthquake, a maximum relative displacement of 0.0499 m was observed at the crest of the arch dam, whereas the minimum relative displacement, measuring 0.0071 m, was observed at the foundation (Fig. 11a). The minimal relative displacement at the base of the dam can be attributed to the foundation being restrained in all three directions. Additionally, the interaction between the foundation and the dam serves as a significant energy dissipator. The dam modeling demonstrated that the maximum relative displacements are symmetrical with respect to the right and left banks. This behavior was consistently observed in the other models as well (Fig. 11b, 11c, 11d). Furthermore, it was noted that as the intensity of the earthquake increases, the relative displacement of the dam also increases.

Relative displacements under dynamic loads: a – at the end of the first earthquake, b – at the end of the second earthquake, c – at the end of the third earthquake, d – at the end of the fourth earthquake
Source: own work.
Figure 12 illustrates the relative velocity distribution across an arch of the investigated dam, the Tichy Haf dam, during a nonlinear time history analysis. The maximum relative velocity is 0.247 m·s−1, located at the crest of the arch dam (Fig. 12a). This high velocity indicates a significant dynamic response at the dam’s uppermost section, which is expected due to the crest’s higher exposure to seismic forces and its greater freedom of movement compared to the base. The minimum relative velocity is 0.143 m·s−1, situated near the base of the dam (Fig. 12a). This lower velocity can be attributed to the constraints imposed by the foundation. The foundation’s restraints in all directions effectively reduce movement, resulting in lower relative velocities. The interaction between the dam and the foundation also dissipates energy, contributing to the minimal velocity observed. The gradient of the relative velocity from the base to the crest suggests that the dynamic response of the dam varies significantly along its height. This variation underscores the importance of considering the entire structure during a seismic analysis to understand how the different sections respond to dynamic loading. The velocity distribution appears to be symmetrical along the arch dam.
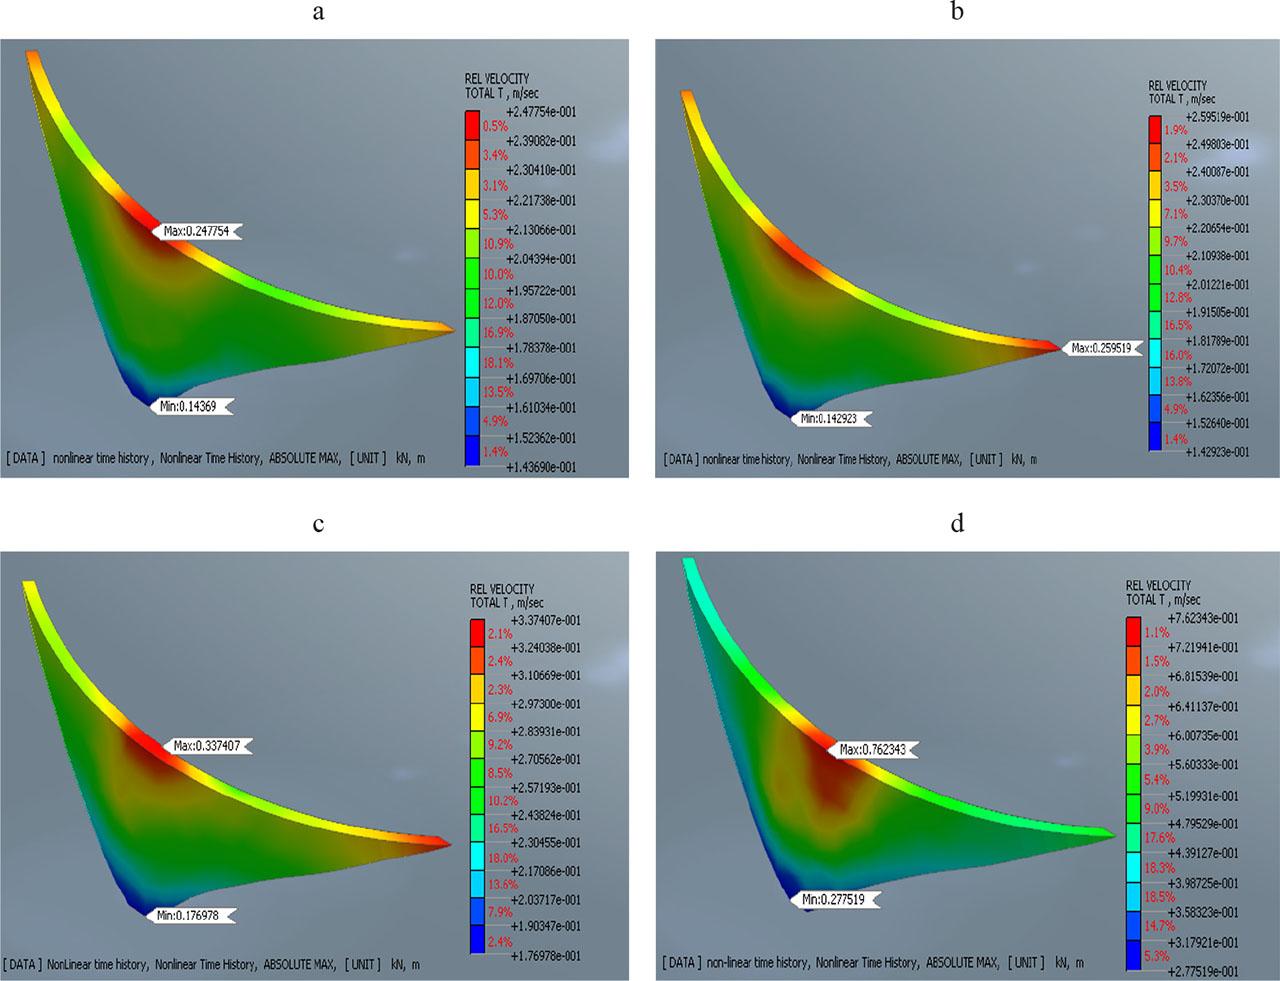
Relative velocity under dynamic loads: a – at the end of the first earthquake, b – at the end of the second earthquake, c – at the end of the third earthquake, d – at the end of the fourth earthquake
Source: own work.
The same pattern is observed for the second earthquake, with maximum and minimum relative velocities of 0.259 m·s−1 and 0.142 m·s−1, respectively (Fig. 12b). The highest and lowest relative velocities during the third earthquake were 0.337 m·s−1 and 0.176 m·s−1, respectively (Fig. 12c). For the fourth earthquake, with an intensity of 0.44 g, the highest relative velocity observed was 0.762 m·s−1 at the crest of the arch dam, while the minimum relative velocity was 0.277 m·s−1 at the base of the arch dam (Fig. 12d).
Figure 13 shows the relative acceleration distribution of the investigated arch of the Tichy-Haf Dam during an earthquake. The maximum relative acceleration is 9.77 m·s−2, located at the crest of the arch dam (Fig. 13a). This high acceleration indicates that the crest experiences the most significant dynamic response to seismic activity. Being the furthest point from the foundation, the crest is subjected to greater forces and movements during seismic events, leading to higher acceleration values. The minimum relative acceleration is 7.44 m·s−2, found near the base of the dam (Fig. 13a). This lower acceleration can be attributed to the constraints imposed by the foundation, which limit movement and therefore result in lower acceleration. The gradient of relative acceleration from the base to the crest indicates a significant variation in the dynamic response along the height of the dam. The observed acceleration peaks (Figs 13b, 13c, 13d) for the second, third, and fourth earthquakes are 9.13 m·s−2, 10.53 m·s−2, and 12.84 m·s−2, respectively. In contrast, the minimum acceleration for this earthquake is 6.05 m·s−2, 8.25 m·s−2, and 9.72 m·s−2, respectively.
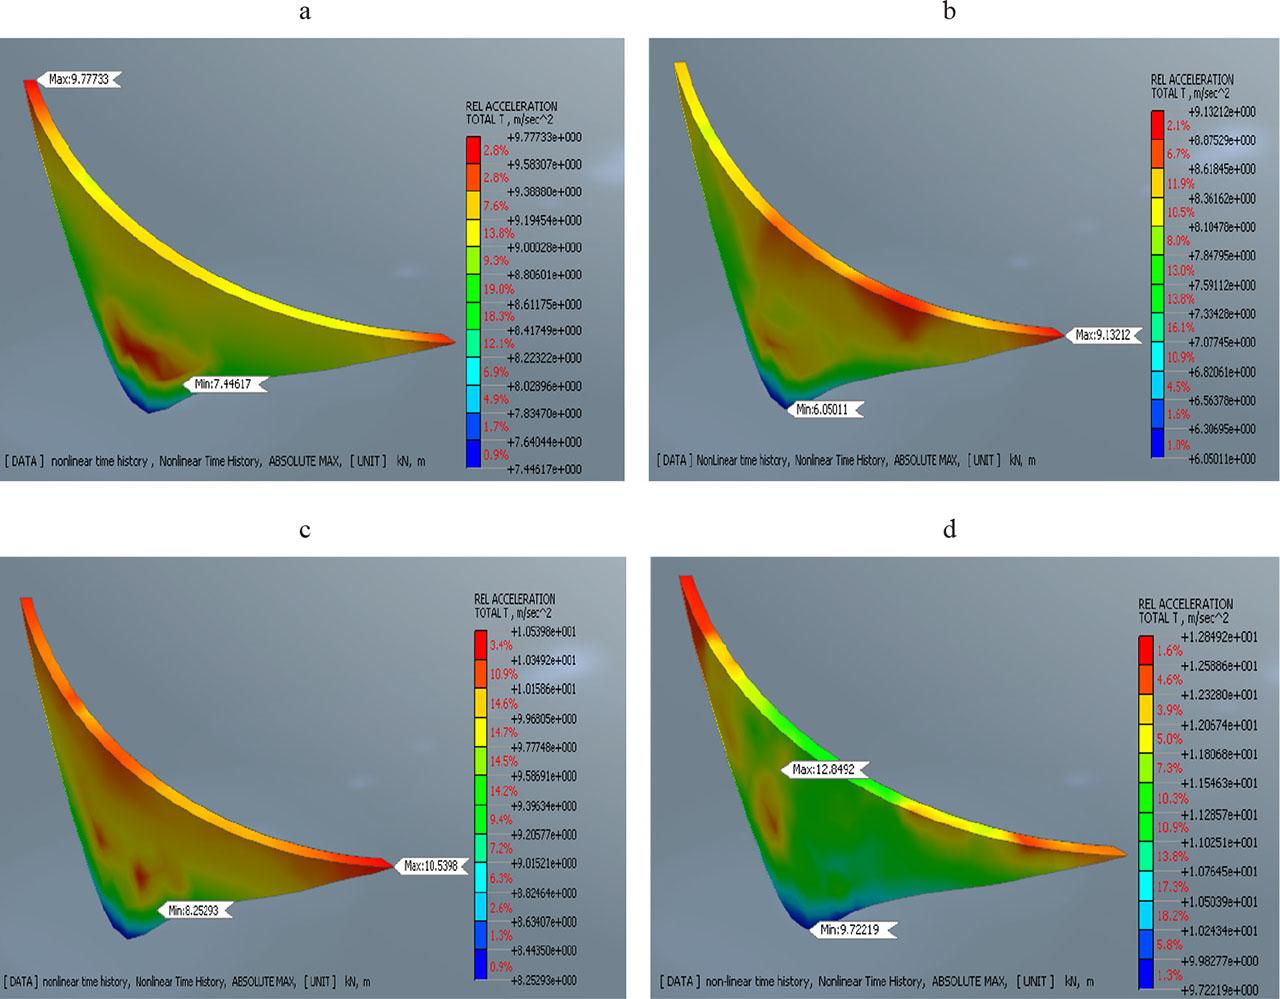
Relative acceleration under dynamic loads: a – at the end of the first earthquake, b – at the end of the second earthquake, c – at the end of the third earthquake, d – at the end of the fourth earthquake
Source: own work.
In this section of the study, we evaluated the stability of the dam by selecting four reference points for analysis (Fig. 14). These points are located on the crest, at the base of the arch dam, and on both the right and left banks.
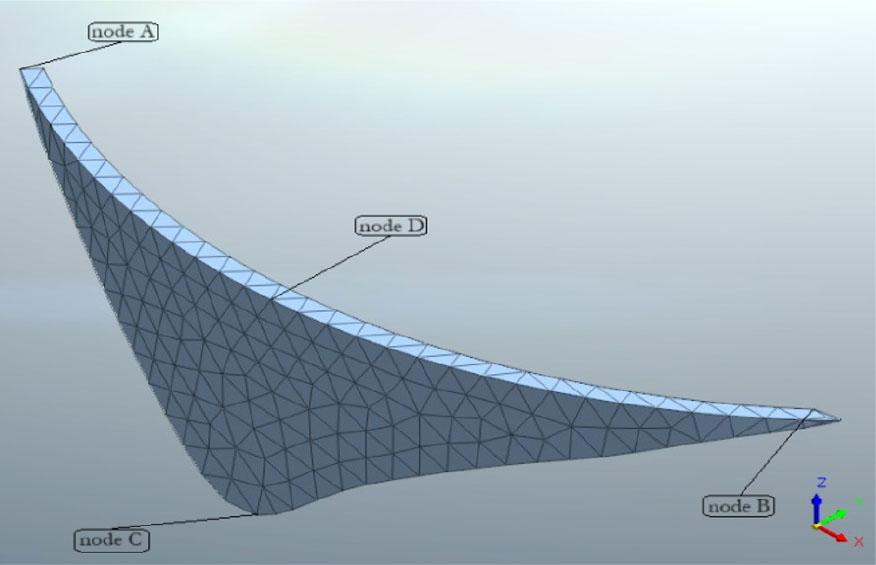
Reference points for the behavior dam analysis
Source: own work.
Figure 15 depicts the displacement curves observed during the four earthquakes. The loads applied to the arch dam in its initial state consist of dead weight and water thrust. These loads, at this juncture, have caused minimal impact on the dam, resulting in only a slight displacement. The discrepancy in displacement among various nodes underscores the non-uniform distribution of dynamic loads within the structure. Nodes A and B experience moderate displacements, while Node D undergoes the most significant deformation, and Node C remains relatively unaffected. The maximum displacements recorded during Earthquakes 1, 2, 3, and 4 were 0.048 m at 5 s, 0.106 m at 16 s, 0.18 m at 10 s, and 0.499 m at 15 s, respectively, with no further evolution until the conclusion of each earthquake.
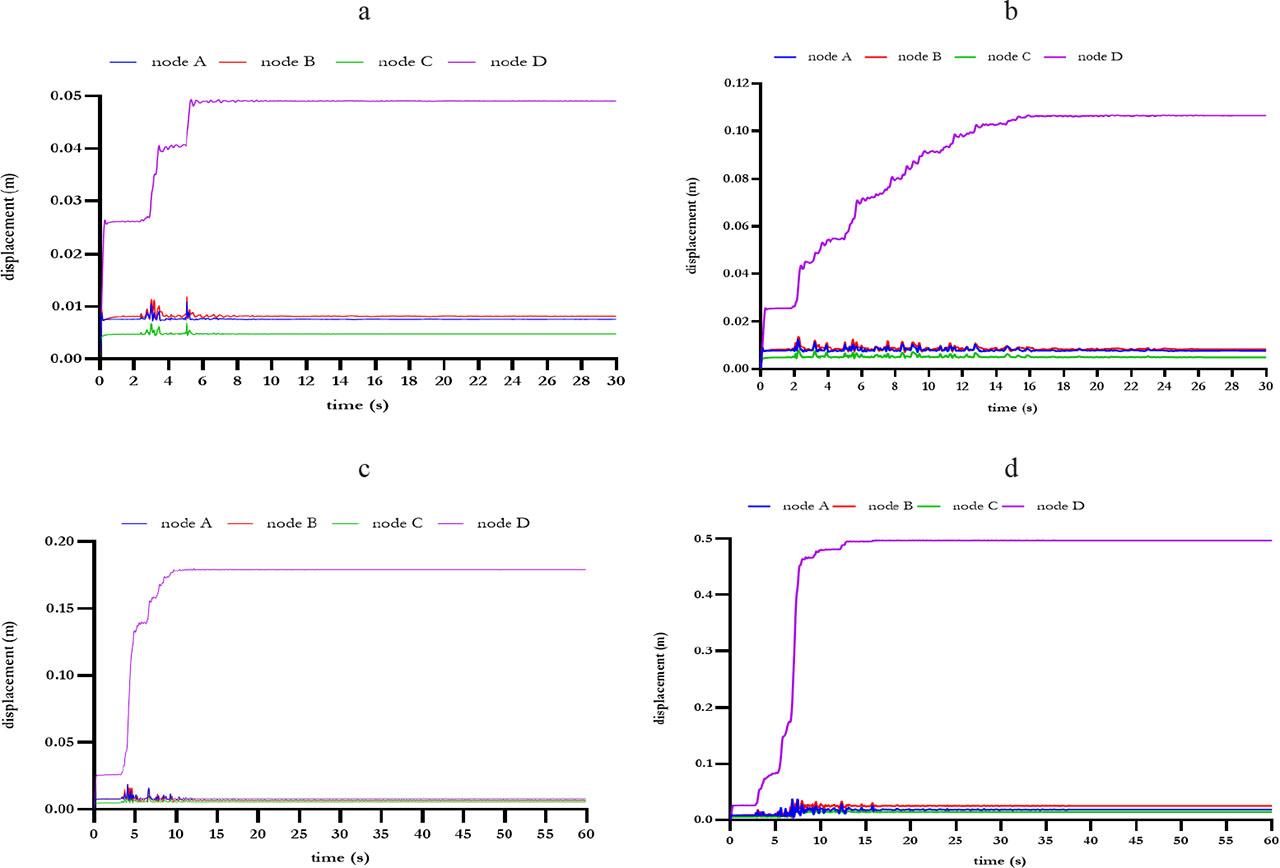
Displacement–time curve during the four earthquakes: a – first earthquake, b – second earthquake, c – third earthquake, d – fourth earthquake
Source: own work.
The current study numerically evaluates the seismic response of the investigated arch of the Tichy-Haf Dam, focusing on relative displacement, relative velocity, and relative acceleration. We developed the numerical model using Midas GTS NX, based on the FEM. In any seismic analysis, a single seismic load is insufficient to determine the general behavior of a structure. Therefore, to understand the behavior of the evaluated arch of the Tichy-Haf Dam, we used four earthquakes with varying intensities. The key conclusions are summarized further in the text.
The maximum relative displacement observed at the crest of the dam at the end of the fourth earthquake was 0.49 m. On the right and left banks, the relative displacement did not exceed 0.5% of the dam’s height, indicating minimal impact in these areas due to the lesser influence of hydrostatic forces. In the foundation, the relative displacement did not exceed 0.5%, which is attributed to the significant role of the dam–foundation interaction in dissipating energy. The displacement–time response for the four nodes provides valuable insights into the structural behavior under seismic loading. Nodes with higher displacements (e.g., Node D) indicate regions that may require additional reinforcement to prevent structural failure. In contrast, nodes with minimal displacement (e.g., Node C) highlight stable areas with minimal dynamic impact. This analysis is essential for designing earthquake-resistant structures and ensuring safety and integrity during seismic events. The observed relative velocities and accelerations highlight critical areas where seismic forces have the most impact. The crest, with its maximum relative velocity, is a crucial area for structural reinforcement. The minimal movement at the base implies that the foundation design is effective in mitigating seismic energy transfer. Understanding these dynamics is essential for designing retrofitting measures or improving future dam designs to enhance seismic resilience. By addressing the areas with the highest dynamic response, engineers can ensure the overall stability and safety of the dam during earthquake events. To validate the model, we compared the results obtained under a static load with the monitoring data. The values are close, confirming the effectiveness of the program in numerical modeling the Tichy-Haf Dam. Finally, numerical simulations provide a reliable and practical way to evaluate the behavior of arch dams under seismic loads. The findings of this study can assist engineers in making informed decisions about the design and construction of such dams.