
The tourist industry is a lucrative sector that plays a significant role in the economic development of numerous emerging nations. The provision of government support demonstrates a commitment to further enhance the growth of the tourism industry (Jan & Chaudhry, 2024). The government’s endeavors to enhance and broaden tourism offerings are being closely monitored to draw a larger number of both domestic and foreign tourists. A wider range of tourist attractions in an area will create more prospects for increased visitation, benefiting not only the attractions themselves but also the entire region (Khairi & Darmawan, 2021). Management of tourism destinations and suppliers is becoming a top priority and a big challenge (Shen et al., 2020). The tourist business is widely recognized as one of the largest and most rapidly expanding industries globally, exerting a significant impact on the economy. In this sector, progress is contingent upon the choice to visit tourist destinations and the frequency of visitor visits (Sinambela, 2021).
Destinations serve as central hubs for tourist activity and, as a result, are significant areas of focus for the examination of tourism. Nevertheless, they are widely recognized as being challenging to handle because of their intricate networks of parties (Xu et al., 2024). The intricate nature of destinations suggests that they are influenced by a diverse array of factors in both their internal and external surroundings (Fyall & Garrod, 2020). Destination management organizations (DMOs) in heritage tourism prioritize the sustainable growth of tourism. Proponents of smart tourism argue that the use of technology may assist DMOs in maximizing tourist growth by tackling concerns such as the maximum number of visitors a destination can handle, effectively managing the interests of many stakeholders, and promoting community participation (Mandić & Kennell, 2021). A smart tourism destination (STD) is a response to the requirements of modern tourism development and is closely linked to the utilization of information communication and technology (ICT) applications. The intelligent destination is constructed around four primary pillars: technology, innovation, accessibility, and sustainability (Damanik et al., 2022).
Several previous researchers have tried to put forward a definition of a tourism destination, including Goeldner and Ritchie (2003). According to their authoritative textbook, a “tourism destination” refers to a specific geographic area where visitors can engage in different forms of travel experiences. Framke (2010), in his article, sees destinations as units and content. Destinations are perceived as entities at various geographical scales, lacking clear geographical demarcations, and are formed through social activities. Furthermore, the content of the destination is perceived as both a collection of attractions and services, as well as a vibrant collection of attractions, culture, events, landscapes, and services. Finally, United Nations World Tourism Organization defines tourism destination as a tangible area, with or without specific administrative or analytical limits, where a visitor can stay overnight (UNWTO, 2019). A tourist cluster refers to the grouping or co-location of products, services, activities, and experiences along the value chain of tourism. It is considered the fundamental unit of study in the field of tourism. A destination comprises multiple stakeholders and can connect and expand into larger destinations. Additionally, its image and identity, which are intangible, can impact its market competitiveness (Risty, 2024).
According to Andrianto and Sugiama (2014), for a location to be transformed into a tourist destination, it must satisfy four essential components of tourism known as the 4As: attractions, accessibility, amenities, and ancillary services. Firstly, Goeldner and Ritchie (2003) see attractions as the primary factors that influence prospective visitors in their choice of one destination over another. The attractions were classified and categorized distinctly into five main groups: culture, nature, event, recreation, and entertainment. Then, Leask (2016) also expressed that an attraction is the pivotal matter of the destination appeal and the driver to visit a destination. Secondly, accessibility, according to the explanation by Tamin (1997) that accessibility is how easy or difficult it is to reach a location. It can be used as a performance measure of distance, travel time, or cost. Thirdly, Goeldner and Ritchie (2003) explain in their books that amenities refer to goods and services that are special to a particular place or region, and that enhance the appeal of that location for living and working. The presence of opposing elements and disadvantages renders places unappealing. Natural amenities refer to environmental factors, such as climate, that are primarily unaffected by human influence or intervention. On the other hand, human amenities encompass cultural aspects that are shaped and created by people. Finally, Nichols (n.d.), in her article, explains that ancillary services in the tourism business are supplementary products and services provided to enhance the principal service or product. These services are specifically developed to improve the entire customer experience and offer additional benefits to travelers (Kalaivani et al., 2023).
Buhalis (2000) presents six frameworks that can be used to analyze tourism locations. The six components consist of many types of attractions, including natural, man-made (or purpose-built), heritage, and special events. Accessibility refers to the overall transportation system, which includes routes, terminals, and vehicles. The amenities include hotel and catering facilities, commerce, other tourist services, and offered packages (prearranged packages by intermediaries and principals). Activities refer to the various options and experiences that are offered at a particular destination, which consumers can engage in during their visit. Ancillary services refer to the additional services that are utilized by tourists, such as banking facilities, telephones, postal services, newsagents, hospitals, and so on. The two additional components, namely available packages and activities, can still be calculated separately in the field and can be separated from the previous four main components. Of course, this will make it easier for field assessors to collect data. These 6As frameworks have become one of the core conceptual models of smart, accessible destinations (Lin et al., 2022). This means that carrying out an independent assessment using the 6As framework in each tourist geographic area has become a necessity in efforts and steps to fulfill smart destination qualifications for visitor satisfaction. As explained by Buhalis and Amaranggana (2014), smart tourism destinations employ systems to enhance the tourism experience and optimize resource management. This is done to maximize both the competitiveness of the destination and the satisfaction of consumers, while also demonstrating sustainability over a long period. These destination services have been tested by Um and Chung (2019) in three tourist destination cities in South Korea and have had a positive effect on tourist satisfaction.
Sequentially, the research carried out in Venice and Salzburg (Buonincontri & Micera, 2016) stated that the 6As framework by Buhalis (2000) is useful and relevant for smart cities chosen as destinations and also for cloud computing services to connect all the 6As of the destination. A year later, Spanish researchers firmly stated the new (SA)6 framework of STDs in their methodology (Tran et al., 2017). However, the six main frameworks still use Buhalis’ 6As framework. They managed to decipher it into each of them, which was concretized in 57 total specific indicators in the table, including the addition of the word “smart” to each of the 6A elements. Huertas et al. (2019) in their work tried to arrange it in the form of a hierarchical diagram and give percentage weights to the results published by Tran et al. (2017) in which a total of 57 indicators from the 6A elements with percentage weights: smart attractions (27.27%), smart accessibility (27.27%), smart amenities (13.64%), smart ancillary (13.64%), smart activities (9.09%), and smart available packages (9.09%) bringing the total to 100%. This hierarchy and weighting will help the researchers even though it is not binding. Arif et al. (2020) also implemented the 6As framework in the city of Batu in East Java Province, Indonesia. The research used data from 11 destinations around the city and its surroundings. The next researcher, Grzunov (2022), who examined the last two years in Bosnia and Herzegovina also uses the (SA)6 framework compiled by Huertas et al. (2019), and also prioritizes destinations in many cities in Croatia. However, Grzunov’s (2022) research collects data using the online questionnaire method, which was distributed online via email directly to the mayor (mayor’s office) of each city (N = 127) and head (head’s office) of every municipality (N = 429) in Croatia. The results of this research are very subjective because they depend on the knowledge and opinions of the respondents, but this research is very useful for the Croatian government and adds to the richness of the methodological experiment.
Each country or region has different geographical characteristics of tourism destinations (Komilova et al., 2021). To attract tourists and satisfy visitor satisfaction, this statement can also be turned into a question: Why are so few tourists coming? Is visitor satisfaction fulfilled? What components must be implemented, improved, and added to the managed destination environment? – and many other basic and important questions. Of course, this will be scary and very dangerous if visitors return with an unpleasant impression of the destination and its community. So, every tourism area must compete to immediately carry out an assessment, especially destinations that are still in development planning, so that all resources owned by stakeholders, especially the local government, can be more effective and efficient; therefore, the 6As framework assessment is one of the best solutions at the moment (Klepers & Ābols, 2023).
All the research previously mentioned was carried out in urban destination areas, thus opening up discussions that began to intersect smart cities and STDs. However, research that takes an island perspective has not yet been obtained. Meanwhile, this research tries to test it not only in urban areas but also in island destination areas. Therefore, this research aims to explore tourism resources and implement the 6As framework in the Wakatobi archipelago destination area, which is one of the island districts in Southeast Sulawesi province, Indonesia. This research also tries to combine the 6As framework with the Technique for Order Preference by Similarity to Ideal Solution (TOPSIS), considering the local government’s interest in supporting decisions regarding priority needs for destination development.
In this exploration process, we try to investigate the sources of tourist attractions into three categories: natural resources, cultural resources, and man-made resources. The exploration method involves several steps (Zhang & Long, 2023):
Field observation: extensively on four main islands (Wangi-Wangi, Kaledupa, Tomia, and Binongko). The attractions of each island were observed, carefully recorded, collected, and focused on tourism potential. Team members from residents were certainly involved.
Secondary data collection: local archives, tourism brochures, and local government reports.
Online databases and websites, such as United Nations Educational, Scientific and Cultural Organization (UNESCO) and national tourism portals, were reviewed to complement our field data with existing literature and digital records.
The focus of this exploration is how many items can be obtained that can be categorized as one attraction or destination point according to category and all kinds of facilities around.
A conceptual framework based on research visualizes the complex subject (Put van den Beemt & Smith, 2016) for analyzing tourism destinations (Buhalis, 2000). The primary determinants of international tourist flow are mostly associated with demand factors in the regions where tourists originate and supply factors in the places they visit (Gidebo, 2021), so field assessment is becoming very urgent.
These six frameworks include: attractions, accessibility, amenities, available packages, activities, and ancillary services. The steps involved in this assessment are as follows:
Assessment criteria: For each component of the 6As framework, specific variables and indicators are identified and assessed based on natural landscapes, cultural sites, or man-made attractions.
A score is assigned to each variable, with a score of the potential of that location reflecting the quantity and significance of its tourism resources.
Data collection involves a systematic survey of each identified tourism site. The survey is conducted by trained research assistants using a predetermined assessment form to ensure accuracy and consistency.
The data collected is analyzed quantitatively, and a score for each variable is calculated. For example, attractions (A1): the various characteristics of the natural landscape’s charm in the scope of the designated area (A11), including man-made attractions (A12), cultural tourism (A13), and special events (A14) are added up. Likewise, the following example for amenities (A3): how many lodgings and hotels (A31), restaurants (A32), public facilities (A33), shopping locations including malls, shops, minimarkets, etc. are available (A34), then add them all up again, and so on until all six components are complete.
The scores for each island are combined to provide a comprehensive assessment of its tourism potential across the six components of the 6As framework (Withanage et al., 2024).
As explained by Buhalis (2000), the 6As consist of attractions with four indicators, accessibility with four indicators, amenities with four indicators, available packages at the destination, activities that can be carried out within the destination, and ancillary services with five indicators that can support visitor satisfaction. The arrangement of symbols and equations from A1 to A6 is the work of Arif et al. (2020). In this research, several previous narratives are all combined in Table 1, so that the methodology is easier to duplicate or has the character of a template that can be developed at any time without changing the core components. TD1, TD2, and TDn are several tourist destinations in geographic characteristic areas. Lines from A1 to A6 are ready to be filled in from the field inspection results.
6As framework assessment of tourism destinations (TD)
| No | Component | Variable/Indicator | Score TD1 | Score TD2 | Score TDn |
|---|---|---|---|---|---|
| 1 | Attractions | natural landscapes | A11 | – | – |
| A1 = A11 + A12 + A13 + A14 | man-made attractions | A12 | – | – | |
| cultural tourism | A13 | – | – | ||
| special events | A14 | – | – | ||
| 2 | Accessibility | transportation routes | A21 | – | – |
| A2 = A21 + A22 + A23 + A24 | terminals | A22 | – | – | |
| public transportation inside | A23 | – | – | ||
| public transportation outside | A24 | – | – | ||
| 3 | Amenities | lodging and hotels | A31 | – | – |
| A3 = A31 + A32 + A33 + A34 | restaurants | A32 | – | – | |
| public facilities | A33 | – | – | ||
| shopping centers | A34 | – | – | ||
| 4 | Available packages | The offered options include guide services, prearranged travel packages, and tours tailored to specific interests. | A4 | – | – |
| |||||
| 5 | Activities | Every tourism destination typically offers a range of activities for visitors to enjoy. | A5 | – | – |
| The activities include sightseeing, swimming, outbound excursions, leisure activities, shooting photographs, and several other things. | ||||
| 6 | Ancillary services | communication channels | A61 | – | – |
| A6 = A61 + A62 + A63 + A64 + A65 | Internet services | A62 | – | – | |
| ATM or bank branch | A63 | – | – | ||
| medical services | A64 | – | – | ||
| postal services | A65 | – | – |
Source: own work.
TOPSIS was designed to solve a multiple objective decision-making problem (Lai et al., 1994). The TOPSIS method operates on the principle that the optimal solution is characterized by its proximity to the positive-ideal solution and its distance from the negative-ideal solution. Based on this, alternatives are ranked (Chakraborty, 2022). This technique is used to rank tourist destinations based on their overall performance across the 6A components. The detailed steps for implementing TOPSIS (Madanchian & Taherdoost, 2023) are as follows:
Stage 1: Calculate the normalized performance ratings:
(1) y_{ij} = {{x_{ij} } \over {\sqrt {\sum\nolimits_{i = 1}^i {x_{ij}^2 } } }}. Stage 2: Integrate weights with the ratings:
(2) v_{ij} = w_j \,y_{ij} . Stage 3: Find positive and negative ideal solutions:
(3) \matrix{ {A^ + = \left( {v_1^ + ,v_2^ + , \cdots ,v_n^ + } \right),} \cr {A^ - = \left( {v_1^ - ,v_2^ - , \cdots ,v_n^ - } \right).} \cr } Stage 4: Obtain the separation values:
(4) \matrix{ {S_i^ + = \sqrt {\sum\nolimits_{j = 1}^j {\left( {v_{ij} - v_j^ + } \right)^2 } } ,} \cr {S_i^ - = \sqrt {\sum\nolimits_{j = 1}^j {\left( {v_{ij} - v_j^ - } \right)^2 } } ,} \cr } Stage 5: Calculate the overall preference score:
(5) v_i = {{S_i^ - } \over {S_i^ - + S_i^ + }}. Stage 6: The remaining alternatives are ranked based on higher Vi values.
The location shown in Figure 1 is Wakatobi Regency, which is one of the districts in the province of Southeast Sulawesi, Indonesia. The capital of this district is located in the Wangi-Wangi sub-district, formed based on the Law of the Republic of Indonesia Number 29 of 2003, dated 18 December 2003 (Winfield, 2024). Previously, Wakatobi was part of the Buton Regency. The area of Wakatobi Regency is around 13,900 km2, consisting of a land area of ±473.62 km2 or only 3% and an area of water (sea) of ±13,426 km2 or amounting to 97% of the area of Wakatobi Regency (Hardi et al., 2024). It consists of four main islands that form the Wakatobi archipelago: Wangi-Wangi, Kaledupa, Tomia, and Binongko.
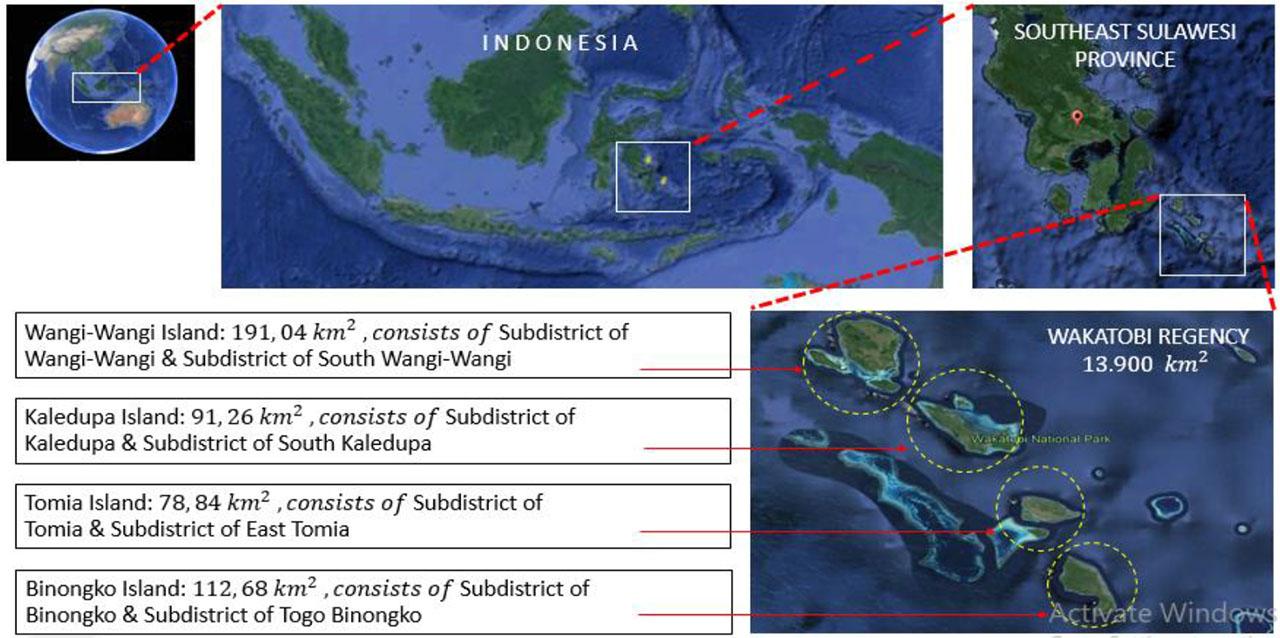
Wakatobi Regency (research location)
Source: own work.
The exploration of tourism resources of the Wakatobi identified several opportunities to classify them by type: natural, cultural, and man-made resources.
Natural resources: Wakatobi is famous for its natural beauty: beautiful sandy beaches that are suitable for human activities, beautiful corals, and marine resources of a type that is difficult to find in many other parts of the world. These natural attractions are anchored by the Wakatobi National Park. The beauty of the islands is also enriched by numerous caves, mangrove forests, and coasts, which create a perfect place for ecotourism and marine activities.
Cultural resources: Another social benefit is cultural, which includes celebrations, historical spots, and local artifacts of Wakatobi. Local cultural festivals like the Wakatobi Wave Festival and the Blacksmith Festival in Binongko introduce tourists to the people’s typical ways of living. Most cultural attractions, such as the historical architectural features of the area, consisting of forts and traditional villages, help explore more of the island and its development, but they also help to maintain and popularize cultural heritages.
Man-made resources: The purpose-built attractions in Wakatobi include various resorts, dive centers, and cultural parks. These amenities also remain a factor in the tourism experience since such facilities are considered necessary in a vacation destination. In the past, when the islands provided very limited accommodation and restaurants, there were few facilities to attract tourists. However, facilities such as airports and ferry terminals have become key assets to the islands, boosting tourist traffic. Search results for several man-made destinations are generally located in resort environments with a high level of privacy. The government also created a cultural park aimed at accommodating community social activities. The night market is an entertainment option, and the lighthouses on Wangi-Wangi and Binongko also function as educational points. Figure 2 illustrates some other potential destination spots.
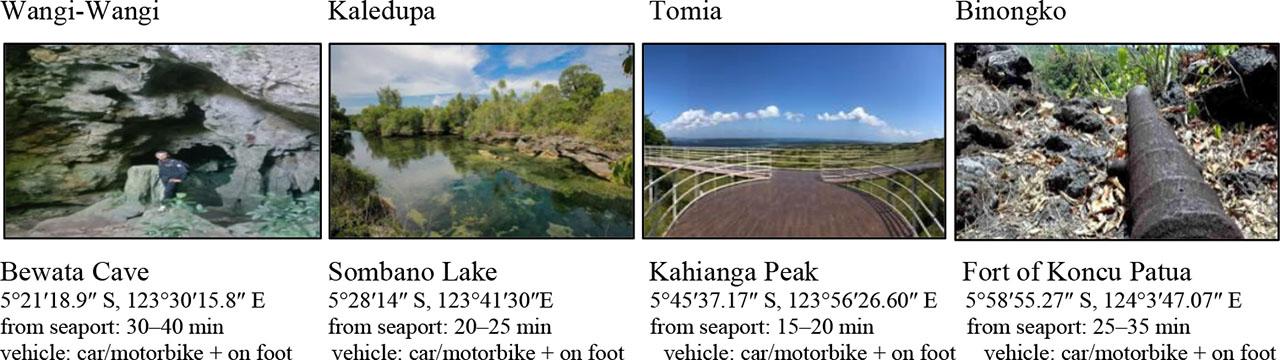
Some different potential destinations
Source: own work.
Table 2 is an additional table that functions as basic information that describes the main characteristics of Wakatobi’s attractions, namely the beach and the beauty of the surface and underwater colorful coral reefs. More than 30 names of beaches managed by residents plus landscape structures in the form of caves, coastal forests, mountains, hills, and the rest of the land activities from the cultural sector are records of human civilization such as forts, dances, local crafts, and others. The four main islands are divided into eight sub-district administrative areas. This is important to convey because attractions are the main core of a destination and are on the menu for enthusiasts who like underwater paradise tourism.
Attractions in each tourist sub-district in Wakatobi
| Sub-district | Attractions |
|---|---|
| Wangi-Wangi |
|
| South Wangi-Wangi |
|
| Kaledupa |
|
| South Kaledupa |
|
| Tomia |
|
| East Tomia |
|
| Binongko |
|
| Togo Binongko |
|
Source: Field observation, hard and soft doc (Bauer, 2022), online version.
Figure 3 is a sample of panoramic spots above and below the sea on each of the islands under consideration. McMellor and Smith have tried to compare the species and generic richness of scleractinian corals in the Wakatobi National Park area with several regions in Indonesia. They state that Wakatobi National Park is located in the middle of the Coral Triangle area, which has the highest marine biodiversity in Southeast Asia. Their findings show that strict no-take-zones are effective in protecting fish and benthic assemblages associated with coral reefs in Wakatobi (McMellor & Smith, 2010).
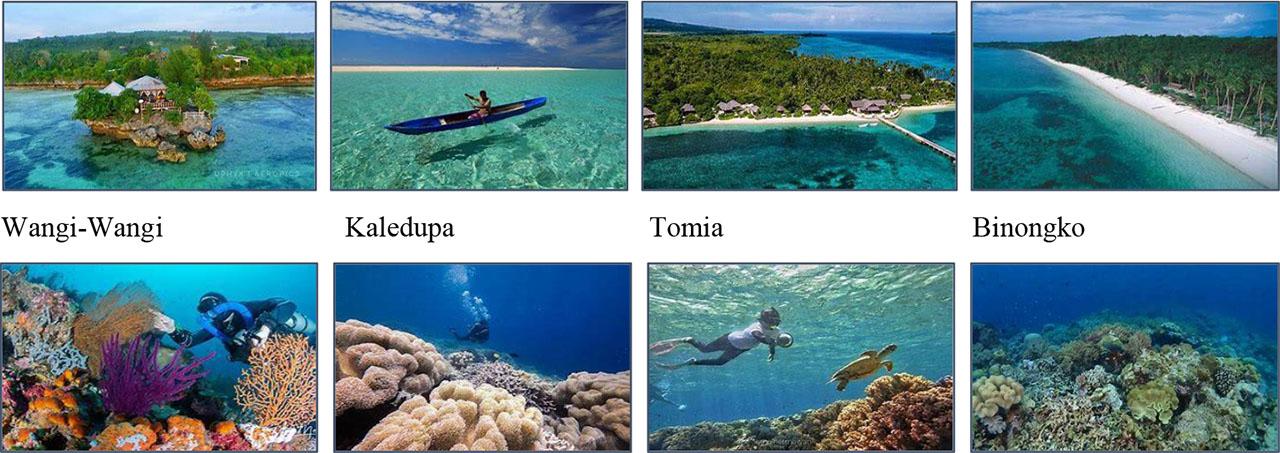
Explore the natural panorama above and below the sea in Wakatobi
Source: Wakatobi Tourism Authority (2024).
Wakatobi has extraordinary marine tourism charm, beautiful underwater corals, and beaches with white sand, complementing the contrast of the clear blue sea. This tourist destination is still not completely touched by the modernity of development, so it can still be authentic and have a local feel. Wakatobi is mainly famous for its coral reefs, making it one of the diving destinations for divers, especially foreign divers. Apart from scuba divers, tourists can also explore the coral reef section of the shallow areas through snorkeling activities (Giglio et al., 2023). On several websites, there is information regarding Wakatobi as a snorkeling destination; the best-known location is Sombu on the west coast of Wangi-Wangi Island, which is also one of the favorite diving locations (Bauer, 2022). Wakatobi requires much traveling, often under basic conditions, but to quote Jacques-Yves Cousteau, it is an “underwater nirvana”, and de Vries (2019) also agrees.
Several traditions and cultures have the potential to become tourist attractions (Rahmawati et al., 2023). Holding a cultural festival is one of the activities usually carried out by the local tourism department, which includes the Tindoi Fort Festival in the Wangi-Wangi District, Koba Fort Festival in the South Wangi-Wangi District, Barata Kaledupa Festival in the Kaledupa District, Pajujudi Festival in the Tomia District, and Blacksmith Festival in the Binongko District. This festival is regularly held every year, but in 2020, it was not held due to COVID-19. In 2021, several cultural festivals will begin to be held again on the Wakatobi; this can be seen at the WAVE festival in Wangi-Wangi Island and the Micro, Small, and Medium-sized Enterprises Festival in the Tomia Islands (Bauer, 2022). Here are some pictures of events/festivals on the Wakatobi tourism agenda in Figure 4.

Tourism events as a reflection of culture in the Wakatobi
Source: Wakatobi Tourism Authority (2024).
The Indonesian government has decided to encourage economic growth by developing tourism as a key sector (Aida et al., 2024). To support this policy, the government has determined ten priority tourism destinations, of which six destinations are part of the national tourism strategic area (according to Government Regulation No 50 of 2011 concerning the National Tourism Development Master Plan), and the other four destinations are included in the special economic zone (Hamzah et al., 2023). While efforts continue, five new destination areas have been added as a super priority, including Wakatobi (Taali et al., 2024). Again, in 2012, Wakatobi was designated as a UNESCO global biosphere reserve, which aims to preserve local wisdom and create a sustainable economy and sustainable livelihoods for local communities. With the establishment of a biosphere reserve at Wakatobi National Park, Indonesia has eight biosphere reserves, and to date, there are 598 biosphere reserve units throughout the world spread across 117 countries. Wakatobi boasts a wide range of ecosystems (Hawati et al., 2024), including several marine and coastal habitats that support a rich array of seagrass, coral reefs, commercially valuable fish, sea birds, turtles, cetaceans, and mangroves. Around 590 species of fish, 396 species of coral reef, 22 major species and 11 associate species of mangrove, and 9 out of the 12 species of seagrass can be discovered in Wakatobi (UNESCO, 2019).
The results of the search on the four islands have provided an overview of the characteristics of the attractive force they have. Therefore, the application of the 6As framework by Buhalis, which has been prepared in Table 2, is presented in the following series of tables. Tables 3, 4, and 5 each have four variable components assessed from the field survey results. Table 3 is a table of attractiveness scores. This is the most important component because it is the force of attractiveness for visitors (Thu & Lee, 2022).
Attractions scores
| No | Tourism Destination | A11 | A12 | A13 | A14 | Score |
|---|---|---|---|---|---|---|
| 1 | Wangi-Wangi | 14 | 6 | 6 | 4 | 30 |
| 2 | South Wangi-Wangi | 10 | 1 | 6 | 3 | 20 |
| 3 | Kaledupa | 7 | 0 | 8 | 3 | 18 |
| 4 | South Kaledupa | 5 | 0 | 10 | 3 | 18 |
| 5 | Tomia | 3 | 0 | 3 | 3 | 9 |
| 6 | East Tomia | 7 | 1 | 1 | 3 | 12 |
| 7 | Binongko | 17 | 0 | 8 | 3 | 28 |
| 8 | Togo Binongko | 16 | 1 | 5 | 3 | 25 |
| Number of forms of attraction | 160 | |||||
Source: own work.
Accessibility scores
| No | Tourism destination | A21 | A22 | A23 | A24 | Score |
|---|---|---|---|---|---|---|
| 1 | Wangi-Wangi | 2 | 3 | 2 | 2 | 9 |
| 2 | South Wangi-Wangi | 2 | 2 | 2 | 2 | 8 |
| 3 | Kaledupa | 1 | 1 | 1 | 1 | 4 |
| 4 | South Kaledupa | 1 | 1 | 1 | 1 | 4 |
| 5 | Tomia | 2 | 1 | 2 | 2 | 7 |
| 6 | East Tomia | 2 | 2 | 2 | 2 | 8 |
| 7 | Binongko | 1 | 1 | 1 | 1 | 4 |
| 8 | Togo Binongko | 1 | 1 | 1 | 1 | 4 |
Source: own work.
Amenities scores
| No | Tourism destination | A31 | A32 | A33 | A34 | Score |
|---|---|---|---|---|---|---|
| 1 | Wangi-Wangi | 20 | 31 | 3 | 265 | 319 |
| 2 | South Wangi-Wangi | 15 | 29 | 3 | 352 | 399 |
| 3 | Kaledupa | 10 | 3 | 3 | 69 | 85 |
| 4 | South Kaledupa | 1 | 1 | 3 | 61 | 66 |
| 5 | Tomia | 10 | 4 | 3 | 95 | 112 |
| 6 | East Tomia | 3 | 4 | 3 | 98 | 108 |
| 7 | Binongko | 2 | 6 | 3 | 62 | 73 |
| 8 | Togo Binongko | 2 | 2 | 3 | 63 | 70 |
Source: own work.
As seen in Table 3, the Wangi-Wangi sub-district has the highest score. It has 14 natural landscape attractions, six cultural attractions, six man-made attractions, and four main events, namely (Wakatobi Wave, the Republic of Indonesia’s birthday, Wakatobi’s anniversary, and year-end events), while the Tomia sub-district has the lowest score influenced by it being the smallest island so that the variety of natural landscapes is limited in quantity but in terms of quality it is no less competitive as proven by the Wakatobi Dive Resort in Tomia, which is famous internationally. The Maranggo Airport in Tomia has a direct connection from Denpasar Bali to Tomia and Wakatobi Dive Resort (Karim, 2022). Denpasar Bali – Tomia flights occur twice a week, namely on Tuesday and Friday. This flight causes Tomia’s accessibility score to be almost equal to Wangi-Wangi Island. Table 3 inventories approximately 160 attractions in the form of geographic destinations, including activities.
Table 4 is a list of accessibility strengths. Wangi-Wangi also has the highest access score because there is one government-owned public ferry port terminal, one naval terminal that is open to the public and can be used by private vessels, and one airport terminal called Matahora Airport. Table 5 is the amenity assessment score. Here, you can see that Wangi-Wangi still has the highest score because Wangi-Wangi is the center of the district capital, and the South Kaledupa sub-district has the lowest score. The shopping center score is worth hundreds due to the combination of all shopping centers, small shops, and large shops spread across the sub-district.
Table 6 is a combined score of the number of available packages and the number of activities that can be carried out. Almost all tour packages are prepared by professionally managed resort companies, so only islands that have resorts have scores. Some activities that can be done include cycling, swimming, diving, snorkeling, fishing, beach views/sunbathing, mountain views/caves, culinary, craft shopping, cultural heritage exploration, and others. But especially to enjoy the silence at one with nature, Wakatobi is the right choice (Syahadat, 2022).
Available packages and activities scores
| No | Tourism destination | A4 | A5 |
|---|---|---|---|
| 1 | Wangi-Wangi | 2 | 9 |
| 2 | South Wangi-Wangi | 1 | 8 |
| 3 | Kaledupa | 1 | 8 |
| 4 | South Kaledupa | 0 | 7 |
| 5 | Tomia | 1 | 8 |
| 6 | East Tomia | 1 | 8 |
| 7 | Binongko | 0 | 6 |
| 8 | Togo Binongko | 0 | 6 |
Source: own work.
Likewise, the ancillary score in Table 7 shows Wangi-Wangi has the highest score, and Binongko has the lowest score. Ancillary services include communication channels, Internet services, ATM or bank branches, medical services, and postal services. These basic services are each present in the district area of each island. ATMs are found at local banks, not international ones. For Kaledupa and Tomia, only mini ATMs are used and are available in chosen small shops.
Ancillary services scores
| No | Tourism destination | A61 | A62 | A63 | A64 | A65 | Score |
|---|---|---|---|---|---|---|---|
| 1 | Wangi-Wangi | 1 | 1 | 9 | 1 | 1 | 13 |
| 2 | South Wangi-Wangi | 1 | 1 | 4 | 1 | 1 | 8 |
| 3 | Kaledupa | 1 | 1 | 2 | 1 | 1 | 6 |
| 4 | South Kaledupa | 1 | 1 | 2 | 1 | 1 | 6 |
| 5 | Tomia | 1 | 1 | 1 | 1 | 1 | 5 |
| 6 | East Tomia | 1 | 1 | 1 | 1 | 1 | 5 |
| 7 | Binongko | 1 | 1 | 0 | 1 | 1 | 4 |
| 8 | Togo Binongko | 1 | 1 | 0 | 1 | 1 | 4 |
Source: own work.
Table 8 is an accumulation of the 6As scores for the four islands: attractions, accessibility, amenities, available packages, activities, and ancillary services. With Table 8 as the initial matrix, the requirements have been met to execute the TOPSIS procedure. As a first step, Equation 1 leads to the normalization of the values in Table 8, and the results can be seen in Table 9.
TOPSIS requirement scores
| No | Tourism destination | A1 | A2 | A3 | A4 | A5 | A6 |
|---|---|---|---|---|---|---|---|
| 1 | Wangi-Wangi | 30 | 9 | 319 | 2 | 9 | 13 |
| 2 | South Wangi-Wangi | 20 | 8 | 399 | 1 | 8 | 8 |
| 3 | Kaledupa | 18 | 4 | 85 | 1 | 8 | 6 |
| 4 | South Kaledupa | 18 | 4 | 66 | 0 | 7 | 6 |
| 5 | Tomia | 9 | 7 | 112 | 1 | 8 | 5 |
| 6 | East Tomia | 12 | 8 | 108 | 1 | 8 | 5 |
| 7 | Binongko | 28 | 4 | 73 | 0 | 6 | 4 |
| 8 | Togo Binongko | 25 | 4 | 70 | 0 | 6 | 4 |
Source: own work.
Normalized performance for TOPSIS requirement scores
| No | Tourism destination | A1 | A2 | A3 | A4 | A5 | A6 |
|---|---|---|---|---|---|---|---|
| 1 | Wangi-Wangi | 0.501 | 0.502 | 0.576 | 0.707 | 0.421 | 0.661 |
| 2 | South Wangi-Wangi | 0.334 | 0.446 | 0.720 | 0.354 | 0.374 | 0.407 |
| 3 | Kaledupa | 0.301 | 0.223 | 0.153 | 0.354 | 0.374 | 0.305 |
| 4 | South Kaledupa | 0.301 | 0.223 | 0.119 | 0.000 | 0.327 | 0.305 |
| 5 | Tomia | 0.150 | 0.390 | 0.202 | 0.354 | 0.374 | 0.254 |
| 6 | East Tomia | 0.201 | 0.446 | 0.195 | 0.354 | 0.374 | 0.254 |
| 7 | Binongko | 0.468 | 0.223 | 0.132 | 0.000 | 0.280 | 0.203 |
| 8 | Togo Binongko | 0.418 | 0.223 | 0.126 | 0.000 | 0.280 | 0.203 |
Source: own work.
The weights shown in Table 10 are taken from the percentage weights determined by Huertas et al. (2019) through the results of AHP analysis. The weights are integrated so that the highest and lowest values can be known and taken. Thus, the Excel table data can automatically work on Equations 3, 4, and 5, which then produces the TOPSIS ranking score indicator in Figure 5.
Indicators weight
| No | Tourism destination | Weight [%] |
|---|---|---|
| 1 | Attractions | 27.27 |
| 2 | Accessibility | 27.27 |
| 3 | Amenities | 13.64 |
| 4 | Available packages | 9.09 |
| 5 | Activities | 9.09 |
| 6 | Ancillary services | 13.64 |
Sources: Huertas et al. (2019).
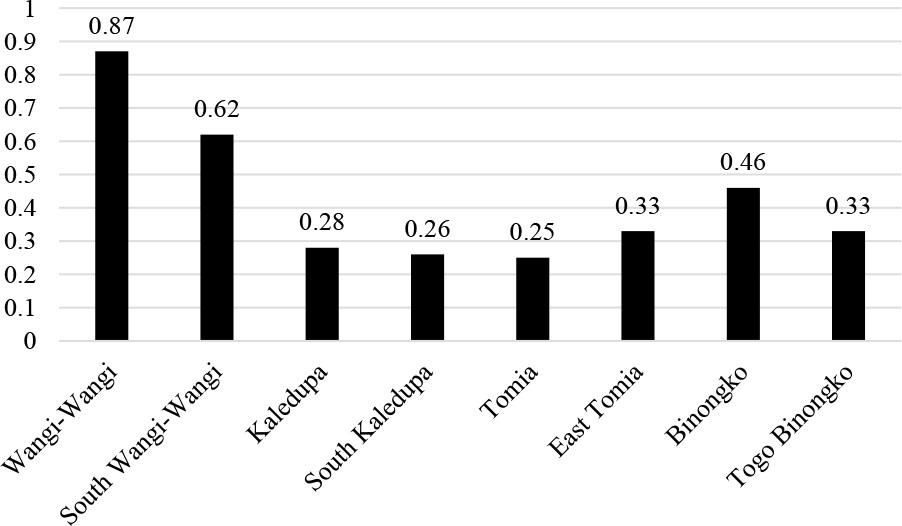
TOPSIS analysis priority scores
Source: own work.
The TOPSIS analysis ranked the islands according to their tourism potential considering the six components of the 6As framework (Fig. 5):
Wangi-Wangi: This island topped the list with a TOPSIS score of 0.87, showing its strong performance in all components, especially attractions, amenities, and accessibility.
South Wangi-Wangi: This island came in second with a score of 0.62. Its closeness to Wangi-Wangi and shared infrastructure boosted its ranking.
Binongko: Scoring 0.46, this island stood out for its one-of-a-kind attractions and rich culture. However, it needs better amenities and accessibility.
East Tomia and Togo Binongko: These islands scored (0.331 and 0.334) suggesting they have balanced potential that could grow with focused development.
Tomia, South Kaledupa, and Kaledupa: These islands scored lower, showing they need big investments in infrastructure and services to reach their full tourism potential.
The application of the 6As and TOPSIS methods to explore and implement the smart tourism destination framework has provided a comprehensive assessment concerning the Wakatobi tourism potential. Key findings and implications for the development of the region’s tourism industry have been drawn from this research.
First and foremost, Wangi-Wangi Island becomes the leading destination since it has the highest score for all variables: attractions, accessibility, amenities, available packages, activities, and ancillary services. Of course, it is well-explained that the highly developed infrastructure, several types of natural and cultural attractions, and strong tourism facilities enable the island to become one of the potential candidates for further investment and promotion as one of the smart tourism destinations; its success can set an example for other islands in the region.
Secondly, these huge disparities in the potential for tourism among the islands demand focused development strategies. For example, Kaledupa and South Kaledupa scored the lowest due to poor access and insufficient visitor facilities. To increase the islands’ attractiveness to tourism, better transport links, improved accommodation and dining, as well as more tourist activities must be developed. Indeed, investments in infrastructure and services are needed to foster an evenly distributed and inclusive tourism industry inside Wakatobi.
Thirdly, the application of the 6As framework and the TOPSIS method has been effective in providing structure and objectivity as a measure of tourism potential. These tools provide opportunities for comparative analyses of different destinations, outlining strengths and weaknesses. As such, these tools have assisted in the prioritization of issues that need to be improved. This approach can be replicated in other regions for the systematic assessment and enhancement of tourism potential.
The findings of this study also underline the importance of sustainable tourism. Maintenance of the untouched natural and cultural features of Wakatobi forms the basis for the islands’ continued attractiveness to tourists. It is therefore important to engage local communities in tourism development, promote eco-friendly practices, and ensure that tourism growth does not come at the expense of the islands’ ecological integrity.
The findings of this research may also be useful in policy decision-making. Based on a detailed assessment, this research study can convince stakeholders to invest strategically in enhancing the tourism infrastructure and services in Wakatobi. This will again increase the satisfaction level of tourists and their visitation rates, which will lead to economic development within the region.
Wakatobi has great potential as a smart tourism destination. A capitalization strategy in their natural and cultural assets, improvement of infrastructure and facilities, combined with best practices on the ground, would ensure balanced and inclusive growth in tourism for the islands. Further research is needed, specifically on accessibility, which focuses on transportation route modeling, monitoring the impacts of tourism development, and refining strategies toward sustainable and equitable growth of the tourism sector in Wakatobi.