
In the pursuit of new materials characterized by high strength, resistance to high temperatures, plasticity, and other valuable properties, composite materials based on metals, such as dispersion-strengthened materials, hold great potential. They can be divided into two groups based on particle size: first group where dimensions range from 0.01 μm to 0.1 μm and the content varies between 1% and 15% by volume of the material, and the second group where particle sizes exceed 1 μm, with a content of approximately 25% by volume of the material, hold great potential. Other examples of composite materials include materials composed of two metals or layered materials. However, in terms of a diverse range of valuable material properties, the greatest promise lies in fiber-reinforced materials, where fibers can have diameters ranging from 1 μm to several tens of micrometers, and the fiber content in the material varies from a few percent to even approximately 70% by volume.
In recent years, durable alloys and composite materials based on aluminum have been widely applied in many branches of industry, with their production made possible through casting technology (Sheng et al., 2020; Rodríguez-González, Ruiz-Navas & Gordo, 2022; Kobayashi, Funazuka, Maeda & Shiratari, 2023). However, a significant challenge lies in the fact that aluminum powder is highly oxidized, preventing it from adhering tightly to other metals, resulting in material inhomogeneity, which in turn hinders the attainment of desired mechanical properties. Additionally, aluminum powder is expensive. These issues are not present in materials produced using casting technology. On the other hand, to avoid defects in the casting process and achieve the desired fine particle structure, ensuring the desired mechanical properties, technologies utilizing high pressure, including hot extrusion, have been widely used.
For the reasons mentioned above, the research has focused on studying the state of stresses and strains, as well as changes in the structure and material properties of aluminum alloys subjected to hot extrusion. This issue appears to have significant potential for practical applications, (Johnson & Kudō, 1962; Sheng et al., 2020; Kobayashi et al., 2023).
To study deformation changes in metals, various empirical methods and in specific cases theoretical research methods are employed. These methods allow for the assessment of particle displacements in metals subjected to extrusion, quantitative and qualitative relationships between these displacements, as well as the evaluation of stress and strain states (Johnson & Kudō, 1962; Perlin & Raitbarg, 1975; Gun & Prudkovsky, 1979; Kenesei, Kádár, Rajkovits & Lendvai, 2004).
The research was conducted on cylindrical and semi-cylindrical samples of an aluminum alloy containing 5.7% of copper. In Table 1, the composition and physical properties of the used aluminum powder and in Table 2 of copper are presented.
The composition and physical properties of the used aluminum powder
| Al content [%] | Al2O3 content [%] | Fe content [%] | Humidity [%] | Bulk density [g·cm−3] |
|---|---|---|---|---|
| 93.8 | 6 | 0.2 | 0.1 | 0.9 |
The composition and physical properties of the used copper powder
| Cu content [%] | Fe content [%] | Pb content [%] | As content [%] | Sb content [%] | Bi content [%] | Bulk density [g·cm−3] |
|---|---|---|---|---|---|---|
| 99.5 | 0.02 | 0.05 | 0.005 | 0.01 | 0.30 | 2.5 |
The samples were prepared in steel molds and subjected to a pressure of 3 t·cm−2 using hydraulic work (model: P474A). In Figure 1, a mold for preparing semi-cylindrical samples is presented. The height of the samples was 45 mm, and the diameter (both for cylindrical and semi-cylindrical samples) was 25 mm.
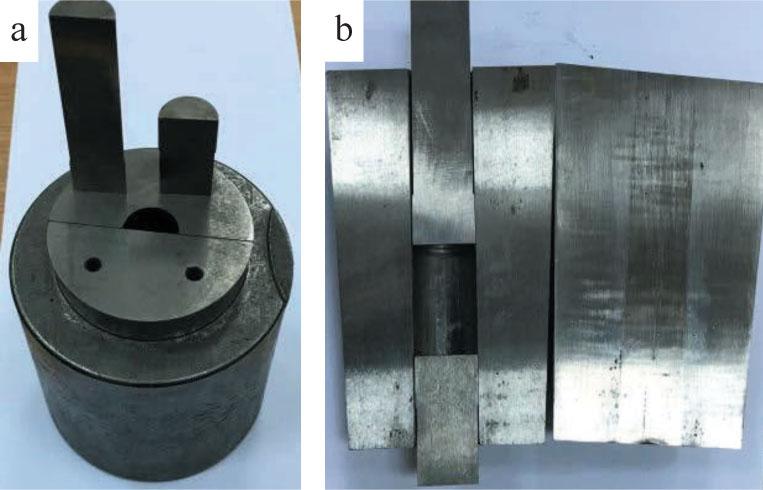
The mold for preparing samples: a – assembled; b – cross-section
Source: own elaboration.
Because in the case of uniaxial compression, the distribution of compressive pressure in the sample varies along its height, it is important to know this distribution. It will allow, for example, to determine the required compression force to obtain a sample with the desired density or porosity if a known curve, such as compression pressure – density or compression pressure – porosity is available. These curves can be obtained experimentally. To determine the pressure distribution as a function of the longitudinal coordinate (x) in the sample, one considers the equilibrium of an elemental layer of the sample with a thickness dx. Figure 2 illustrates the schematic for the calculations.

A schematic of sample creation: 1 – die, 2 – movable punch, 3 – fixed punch, 4 – metal powder
Source: own elaboration.
Let's denote po, pt as the real pressure on the top of the example and theoretical pressure calculated on the coordinate x respectively, S as the sample surface area. Then the total force acting on the sample is Po and Pt calculated according to the equations:
Now we can write the equilibrium of an elemental layer of the sample:
Substituting the above relationships into Equation (2) and simplifying it, we obtain:
Transforming Equation (3), we obtain the following ordinary differential equation with separated variables:
By integrating both sides of Equation (4), we obtain the solution:
Finally, we obtain:
Therefore, at any given moment, knowing the force acting on the upper surface of the sample and its height, the pressure distribution along the height of the sample can be determined. According to Equation (8), the pressure decreases exponentially along the height of the sample. There is a reason why lower porosity is observed in the areas closer to the press plunger. Consequently, the strength and other mechanical properties of the samples may vary in different locations.
The prepared semi-cylindrical samples had a grid of coordinates applied to them (cuts and chalk markings). Subsequently, the paired samples were heated to a temperature of 550°C and then extruded through molds with diameters of 10 mm, 12 mm, and 14 mm to form cylindrical samples. Figure 3 presents a schematic of the extruder.
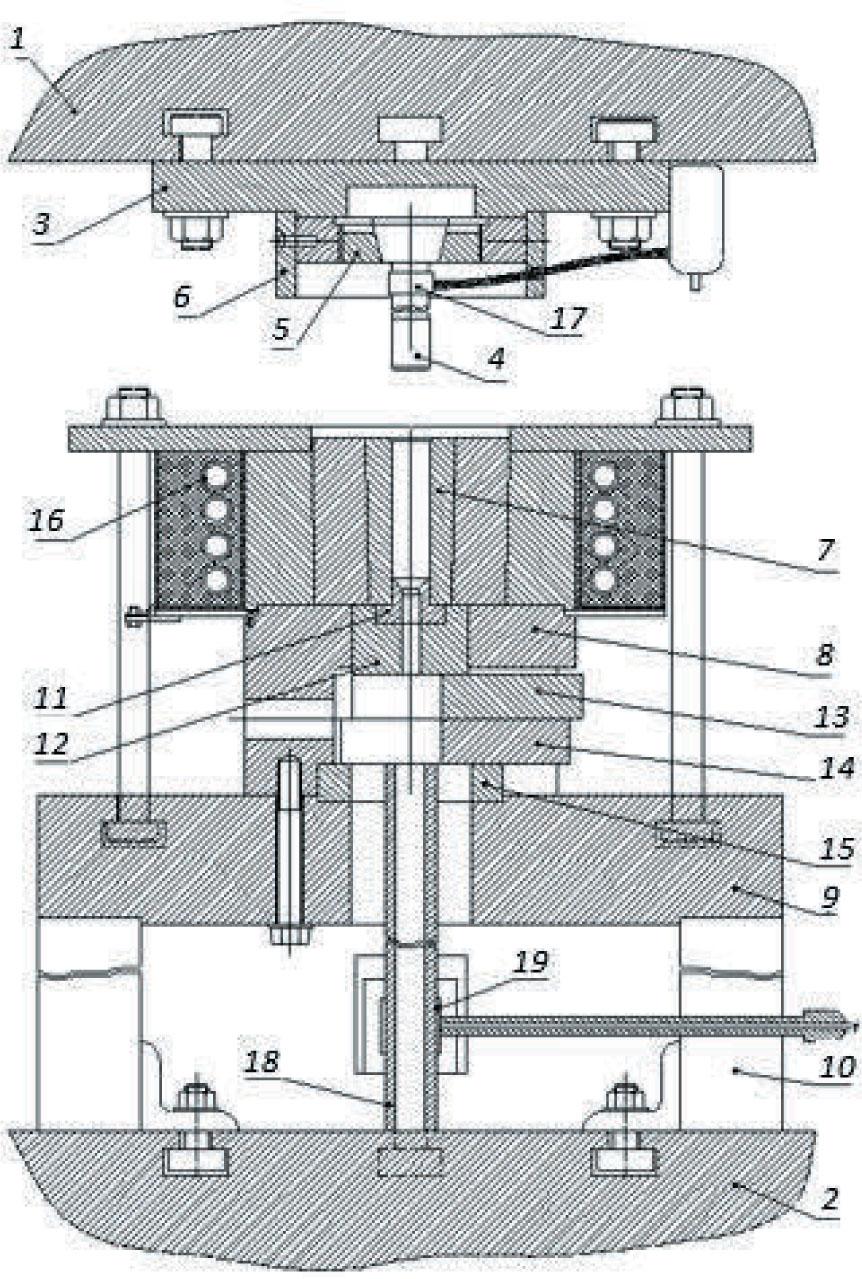
A schematic of the extruder: 1, 2 – upper and lower press plates, 3 – upper extruder plate, 4 – punch, 5 – nut, 6 – stop, 7 – container, 8 – container plate, 9 – plate, 10 – protecting pipe, 11 – die, 12 – clamp, 13 – upper wedge, 14 – lower wedge, 15 – ring, 16 – electric heater, 17 – strain gauge, 18 – force gauge, 19 – strain gauge
Source: own elaboration.
Figure 4 shows external forces and the resulting stresses generated during the compression of the sample (Aghbalyan & Stepanyan, 2006). All these forces and stresses change depending on boundary conditions, the speed at which the process occurs, and the physical state of the sample. Significant changes are particularly noticeable in the final phase of the process (Perlin & Raitbarg, 1975; Dunand, 2004; Dixit & Narayanan, 2013).
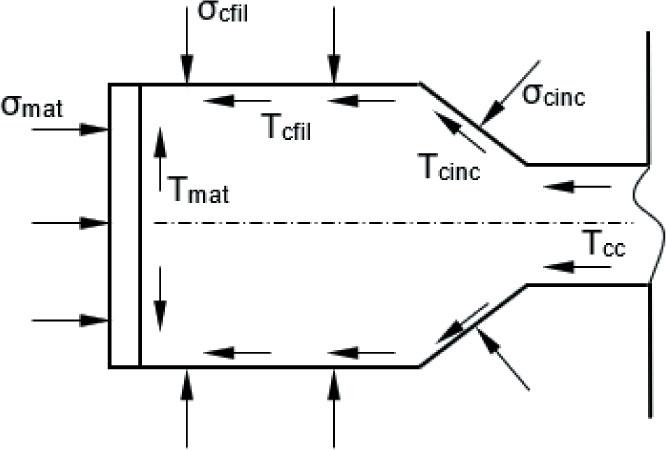
Diagram of forces and stresses acting on the sample during extrusion (in reality, the conical part has rounded walls)
Source: own elaboration.
Due to the forces acting on the sample and the deformations occurring within it, the extrusion process can be divided into three main stages (Wright, 2011):
- –
Stage I – the initial phase of the extrusion process, during which the sample is pressed into the container;
- –
Stage II – the main stage of the process characterized by a constant flow of metal;
- –
Stage III – the final phase, during which the constant flow of metal is disrupted, and the extrusion process concludes.
Each of these stages is characterized by a specific stress state, which can be determined primarily based on a chart depicting the relationship between the pressure in the extrusion process and the distance travelled through the die (Aghbalyan & Stepanyan, 2006). A schematic of such a chart is shown in Figure 5.
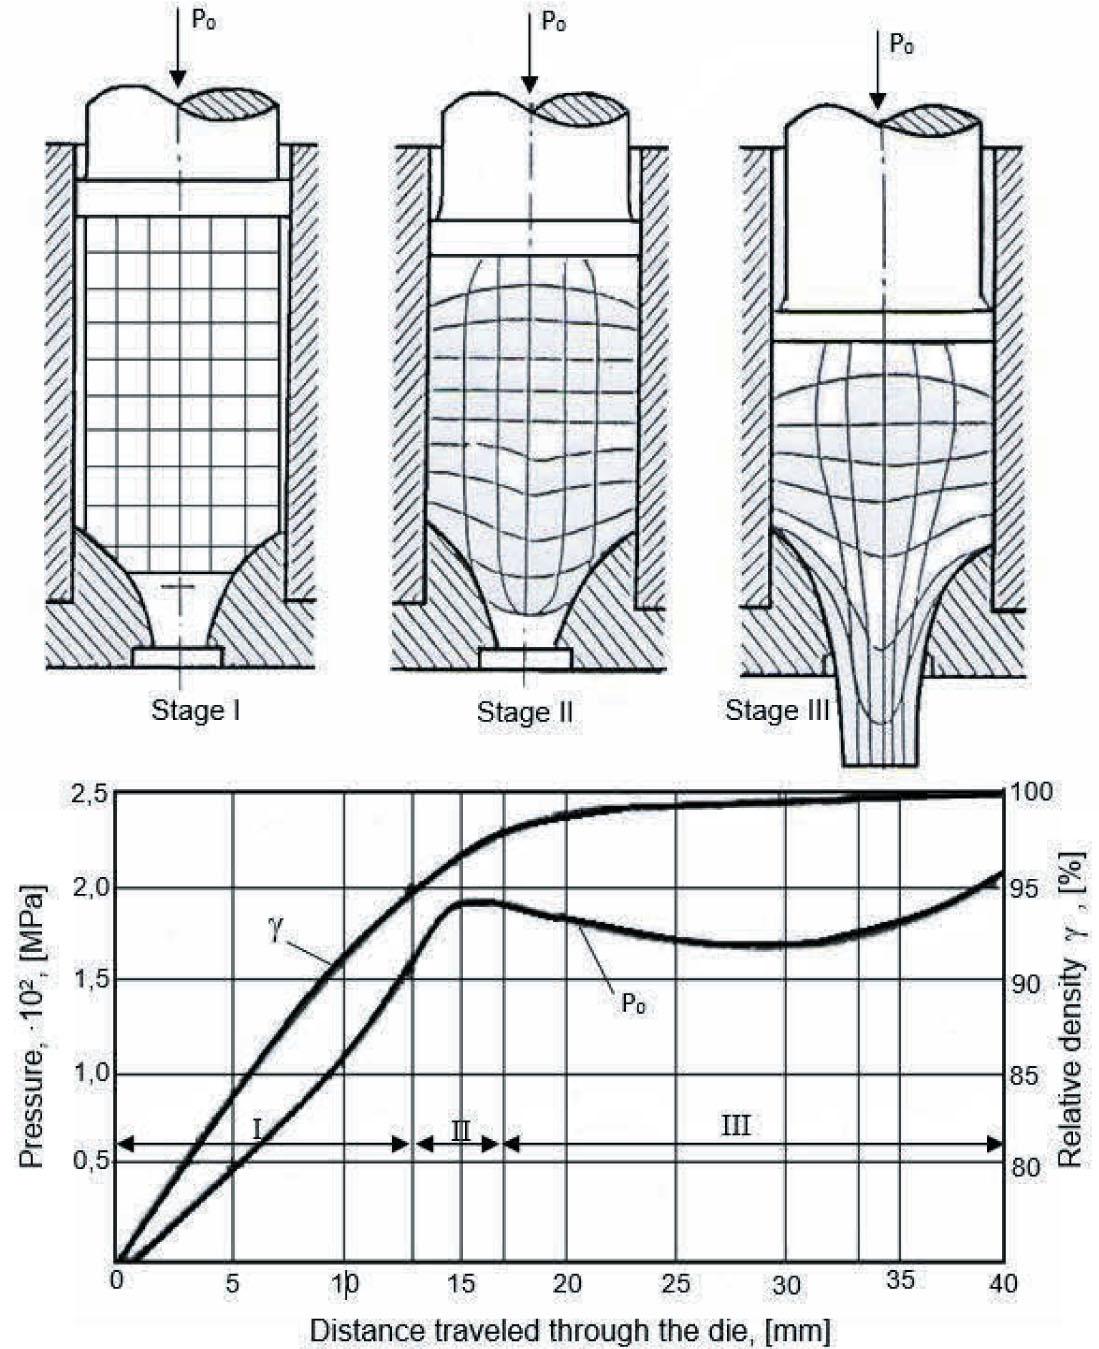
Changes in die pressure and relative density depending on the stage (I, II, III) of the hot extrusion process (Po – the total force acting on the sample during extrusion)
Source: own elaboration.
As a result of the conducted research, several interesting observations were made. In Figure 6, samples with a coordinate grid applied after the hot extrusion process are shown.

Image of samples with a coordinate grid applied after the hot extrusion process: a – for a sample with a final diameter of 10 mm; b – for samples with a final diameter of 12 mm; c – for samples with a final diameter of 14 mm
Source: own elaboration.
Based on observations from real samples, a coordinate grid scheme was created for three phases of the process. The coordinate grid and the overall deformation state diagram are presented in Figure 7. The deformation state of the metal sample subjected to hot extrusion has been determined based on a coordinate grid in each stage of the process.
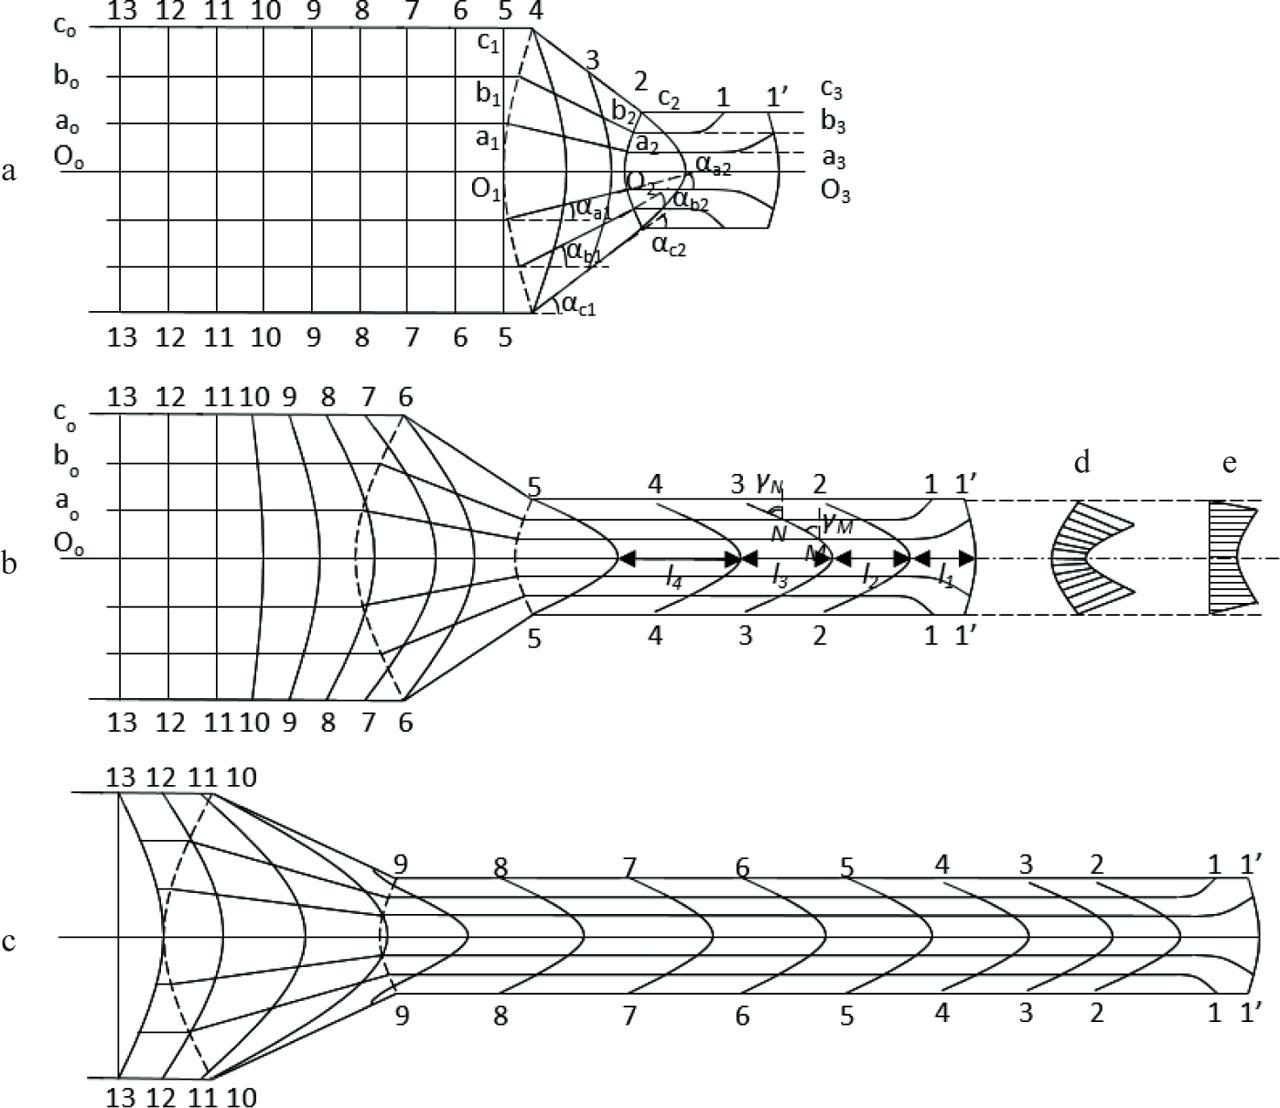
General schematic of the coordinate grid and stress state of the metal sample subjected to hot extrusion: a – in the initial phase of the process; b – in the main phase of the process; c – in the final phase of the process; d – deformation chart in the plastic deformation zone at the end of the conical part; e – deformation chart of the sample at the beginning of the conical part
Source: own elaboration.
Based on Figure 7, the following main observations have been made:
After the extrusion process, all initial longitudinal lines of the coordinate grid, except for the front part of the die, remained straight, while they curved in the conical part of the die.
The resulting curvatures are converse to each other; for example, the angles αc1 and αc2 indicate that the deformations are not monotonic.
There is a noticeable relationship: αc1 > αb1 > αa1 and αc2 > αb2 > αa2, indicating that deformations decrease towards the axis of the sample (Fig. 7).
Longitudinal lines of the coordinate grid curved in the conical part of the die – at the beginning (points c1, b1, a1) and at the end (points c2, b2, a2). This indicates that in the plastic deformation zone, the front surfaces are continuous, asymmetric surfaces with convexity directed opposite to the extrusion.
At a certain distance from the plastic deformation zone, longitudinal lines of the coordinate grid inclined towards the axis of the sample, causing the expansion of outer layers and the narrowing of inner layers.
All transverse lines of the initial coordinate grid symmetrically bulged in the direction of extrusion. This indicates that inner layers moved faster than outer layers.
Under classical extrusion conditions, transverse lines of the coordinate grid, except for the one adjacent to the front part, took on the shape of a parabola y2 = p · x. The p parameter depends on the distance of the curve from the front surface of the sample.
Transverse lines adjacent to the front surface (in this example, one line) after the extrusion process take on the shape of a broken line 1-1′-1′-1 (Fig. 7), indicating that before deformation, the ends of the grid segments moved to the lateral surfaces, and a portion of the front surface of the sample transitioned to the lateral surface.
The curvature of transverse lines of the coordinate grid increases opposite to the direction of extrusion.
In general, in the direction opposite to the extrusion direction, there is also a slight increase in the distance between transverse lines of the grid.
The inclinations of transverse lines of the coordinate grid indicate that during extrusion, the concentric layers of the sample undergo not only longitudinal and transverse deformations, but also shear ones. Shear increases towards the outer layers, as evidenced by the inequality of angles γN > γM, describing shear at points N and M.
The increase in shear towards the surface indicates that the principal tensile stresses resulting from deformations and shear also increase towards the surface.
In the zone at the end of the conical part, the directions of principal normal stresses are different – they form an angle with the axis of the sample, which also increases towards the surface.
From the observed changes in the sample, it can be concluded that throughout its volume, radial and circumferential deformations are constricting deformations.
Figure 4 depicts a schematic of the forces acting on the sample subjected to extrusion (Perlin & Raitbarg, 1975; Salonine & McQueen, 2004). If we divide the sample into layers of infinitely small thickness and neglect the influence of friction with the equipment as well as friction between the layers, it will become apparent that during the extrusion of such a multilayered element, the layers will be in a state of multi-directional, uneven compression. This means that tensile deformations will be primarily passive. Under classical extrusion conditions, where the resistance of the material to deformation is nearly constant throughout the volume of the sample, the inner layers move faster than the outer layers. As a result, additional stresses are generated: tensile stresses in the outer layers (because each inner layer, moving faster than the neighboring layer, pulls it along), and compressive stresses in the inner layers (because each outer layer, moving slower than the neighboring layer, hinders it). Consequently, in the effort to equalize the stresses, two regions are formed: a region of outer layers, which is subjected to additional longitudinal tensile stresses that decrease toward the axis of the sample, and a region of inner layers, which is subjected to longitudinal compressive stresses that increase toward the axis of the sample.
In the zone of inner layers, additional compressive stresses, superimposing with the main compressive stresses, do not alter the stress state (Fig. 8a, Zone 1).
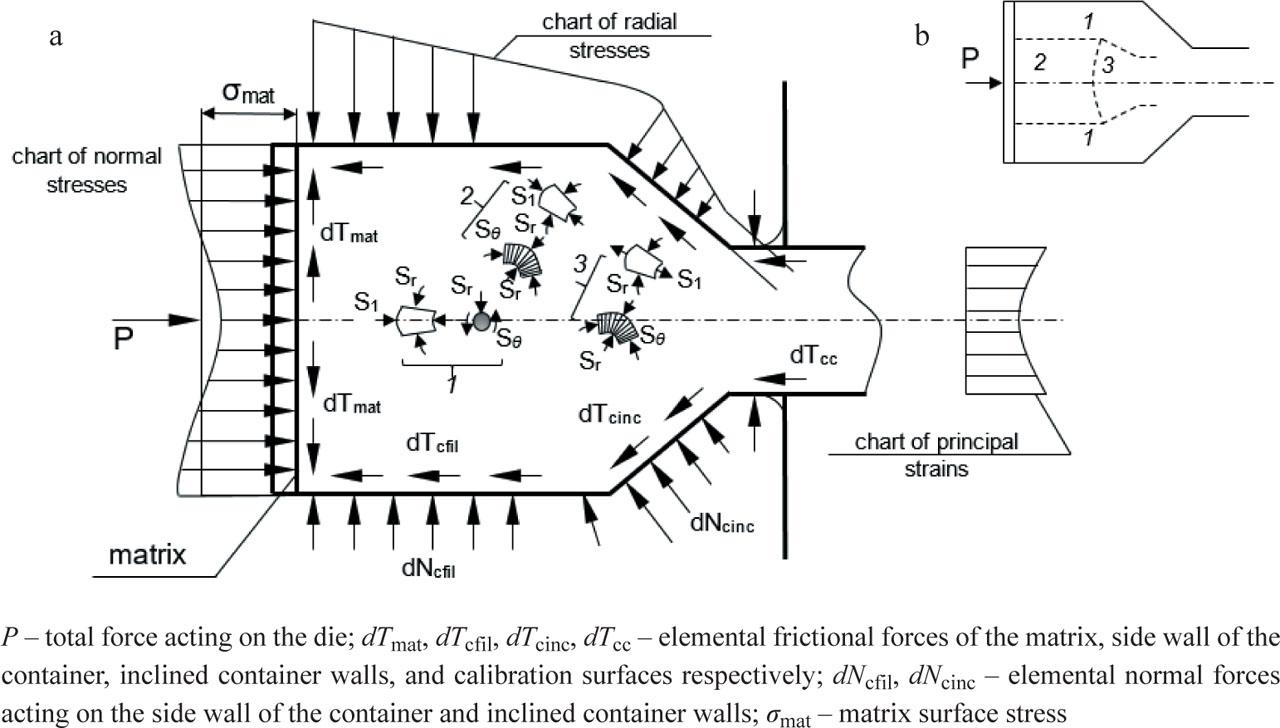
Diagram of forces acting on the sample, strain chart, and types of stress states during hot extrusion: a – under classical conditions; b – in the case of a sudden decrease in strength in the surface layer
Source: own elaboration.
In the zone of outer layers (Fig. 8a, Zones 2 and 3), the additional tensile stresses, superimposing on the main compressive stresses, reduce them and change the stress state of the sample. The multi-directional uneven compression transforms into two-directional: compression in the transverse direction to the sample and tension in the longitudinal direction (Fig. 8a, Zone 3). This part is located in the final section of the conical die, where the main stresses decrease towards the narrowing of the die, while the additional stresses increase.
In the case where the strength of the material in the outer layers is significantly lower compared to the strength of the inner layers, the outer layers move faster than the inner layers. As a result, additional stresses occur: tensile stresses in the inner layers (because each outer layer, moving faster than the neighboring layer, pulls it along), and compressive stresses in the outer layers (because each inner layer, moving slower than the neighboring layer, hinders it). Thus, in the plastic deformation zone, three regions are formed:
A region of inner layers where additional longitudinal tensile stresses decrease towards the surface (Fig. 8b, Region 1).
A region of inner layers where longitudinal compressive stresses decrease towards the axis of the sample (Fig. 8b, Region 2).
A region of inner layers subjected to transverse compression and longitudinal tension (Fig. 8b, Region 3).
During hot extrusion, factors characterizing the internal structure of the sample include particle size and shape as well as the degree of internal non-uniformity. Metals subjected to hot extrusion are characterized by a high degree of structural non-uniformity, which results from the non-uniformity of deformations. Other factors influencing non-uniformity include changes in thermal conditions and structural changes during extrusion, followed by sample cooling (Perlin & Raitbarg, 1975; Woźnicki, Leśniak, Włoch, Leszczyńska-Madej & Wojtyna, 2016).
In general, the non-uniformity of the sample is expressed through variations in particle size in both transverse and longitudinal cross-sections. Depending on the deformation state, particle size decreases from the inner layers to the outer layers and from the front of the sample to its end. These differences are visible in Figures 9 and 10, which depict the microstructure of the sample.
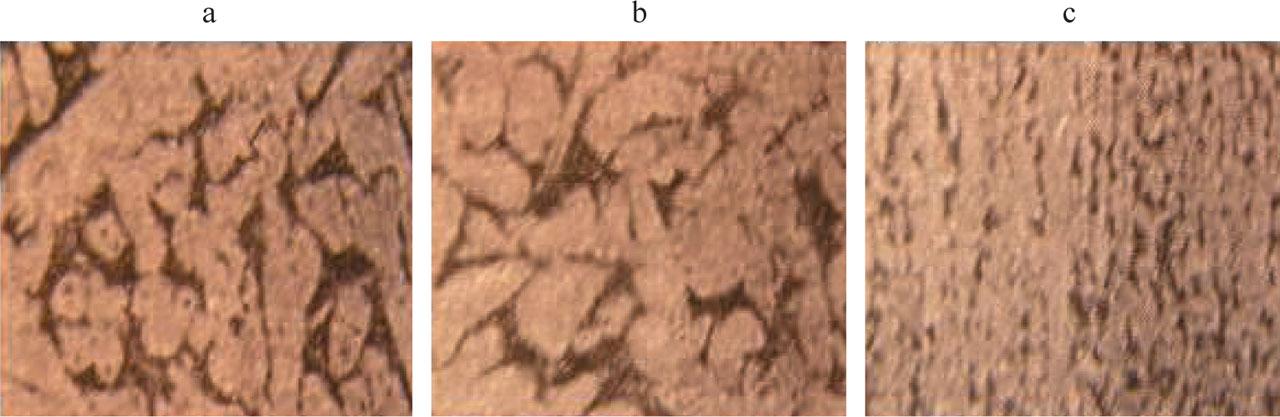
Microstructure of the internal layers of the duraluminum string (magnification ×100): a – beginning of the string; b – middle of the string; c – end of the string
Source: own elaboration.
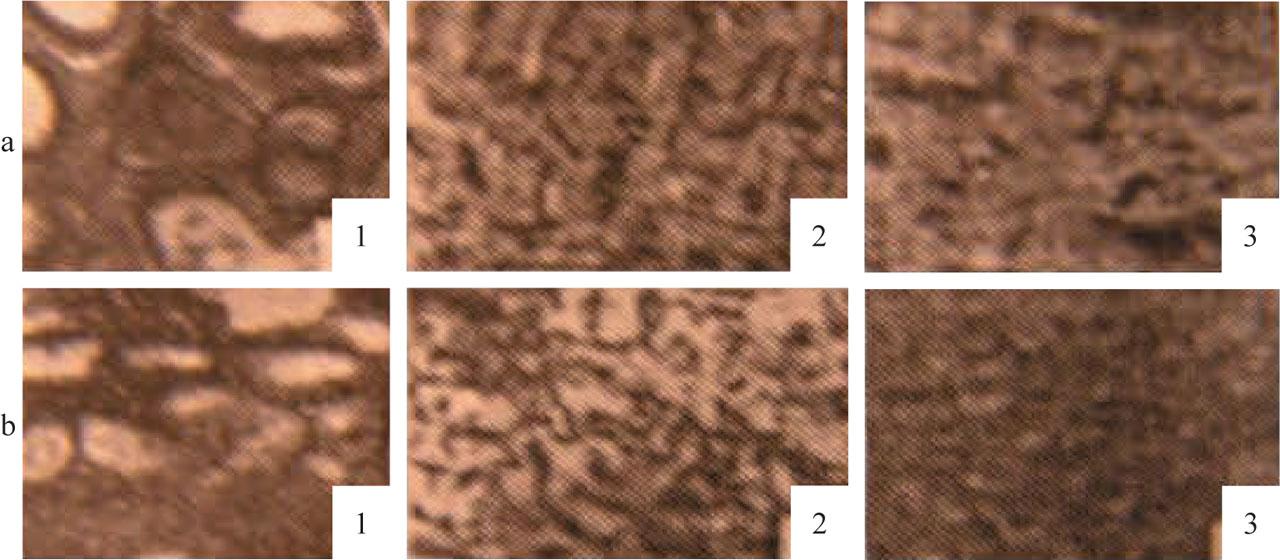
Microstructure of different sections of the duraluminum string extruded without grease (magnification ×250): a – surface of the rod; b – middle of the rod (1 – beginning of the string; 2 – middle of the string; 3 – end of the string)
Source: own elaboration.
The non-uniformity of particle dimensions increases after the sample cools down. This is because, during the heating of the sample, intense recrystallization occurs in the layers with significant deformations, resulting in the formation of an outer layer with large particles. This outer layer extends from the front of the sample towards its end. The development of such a layer and the fact that its thickness changes indicate the non-uniformity of the sample structure (Perlin & Raitbarg, 1975; Wu et al., 2020).
In the case of extrusion with the use of grease on the matrix surface or when no grease is used at all, there is either no occurrence of a layer with large particles, or it is thin.
A characteristic describing the structure of the sample is the average particle size, which depends on the conditions of the extrusion process. Increased deformation is typically accompanied by a simultaneous decrease in the average particle size, while an increase in temperature leads to a simultaneous increase in the average particle size.
In extruded samples, parallel delamination along the axis is often observed. When this effect occurs, transverse fractures exhibit a stepped surface, indicating a weakening of certain surfaces parallel to the axis of the sample. The non-uniformity of deformations and the internal structure of the sample have an impact on its mechanical properties. In the case of extrusion, the strength of the sample increases from the inner layers to the outer layer and from the front of the sample to its end. In some cases, the relative elongation follows a similar pattern but in the opposite direction.
In the case of small extrusion ratios, the mechanical properties of the sample in the inner and outer layers can differ significantly. However, when using large extrusion ratios, these differences are considerably smaller and sometimes even negligible. Many very interesting results regarding the material properties of elements subjected to hot extrusion can also be found in works (Sheng et al., 2020; Bazhenov et al., 2022; Rodríguez-González et al., 2022; Kobayashi et al., 2023).
It has been demonstrated that during hot extrusion, additional compressive stresses in the inner layers of the sample, superimposed on the main stresses, do not alter its stress state. The stress state remains constant and is characterized by uneven compression. Additional tensile stresses in the outer layers, superimposed on the main (compressive) stresses, reduce them and, in some cases, surpass them in magnitude, changing the stress state from multi-directional to two-directional compression: transverse compression and longitudinal tension.
It has been shown that the non-uniformity of deformations and the internal structure of the sample affect its mechanical properties. During extrusion, the strength of the material increases from the inner layers to the outer layer and from the front of the sample to its end. In the case of small extrusion ratios, the mechanical properties of the sample in the inner and outer layers can differ significantly. However, when using large extrusion ratios, these differences are considerably smaller and sometimes even negligible.